Spatiotemporal Brain Dynamics of Emotional Face Processing Modulations Induced by the
Serotonin 1A/2A Receptor Agonist Psilocybin
Fosco Bernasconi
1, André Schmidt
1, Thomas Pokorny
1, Michael Kometer
1, Erich Seifritz
2and Franz X. Vollenweider
1 1Neuropsychopharmacology and Brain Imaging, University Hospital of Psychiatry, University of Zurich, Zurich 8050, Switzerland
and
2Clinic of Affective Disorders and General Psychiatry, University Hospital of Psychiatry, Zurich 8050, Switzerland
Address correspondence to Dr Fosco Bernasconi, Neuropsychopharmacology and Brain Imaging Unit, University Hospital of Psychiatry, CH-8050 Zürich. Email: [email protected]
Emotional face processing is critically modulated by the serotonergic
system. For instance, emotional face processing is impaired by acute
psilocybin administration, a serotonin (5-HT) 1A and 2A receptor
agonist. However, the spatiotemporal brain mechanisms underlying
these modulations are poorly understood. Here, we investigated the
spatiotemporal brain dynamics underlying psilocybin-induced
modu-lations during emotional face processing. Electrical neuroimaging
analyses were applied to visual evoked potentials in response to
emotional faces, following psilocybin and placebo administration.
Our results indicate a
first time period of strength (i.e., Global Field
Power) modulation over the 168
–189 ms poststimulus interval,
induced by psilocybin. A second time period of strength modulation
was identi
fied over the 211–242 ms poststimulus interval. Source
estimations over these 2 time periods further revealed decreased
activity in response to both neutral and fearful faces within limbic
areas, including amygdala and parahippocampal gyrus, and the right
temporal cortex over the 168
–189 ms interval, and reduced activity
in response to happy faces within limbic and right temporo-occipital
brain areas over the 211
–242 ms interval. Our results indicate a
se-lective and temporally dissociable effect of psilocybin on the
neur-onal correlates of emotineur-onal face processing, consistent with a
modulation of the top-down control.
Keywords: 5-HT1A/2A receptors, EEG, emotional face processing,
psilocybin, source estimation
Introduction
Facial expressions provide information on our emotional state.
Therefore, accurate face processing is essential for appropriate
social interaction and behavior (
Ekman et al. 1987
).
Further-more, impaired emotional face processing has been closely
related to mood disorders (e.g., major depression and
anxiety). For instance, mood disorders patients, compared
with healthy, are characterized by an increased attentional bias
to negative stimuli (
Disner et al. 2011
) and enhanced neural
response to threat stimuli within the extensive neural network
of emotional face processing (
Stuhrmann et al. 2011
).
Several studies demonstrated that serotonergic
antidepress-ants shift the attentional bias from negative to positive, and
reduce the neurophysiolgical response to threat stimuli
(
Harmer 2008
for discussion), providing evidence for a critical
role of the serotonergic system in emotional face processing.
Selective serotonin reuptake inhibitors (SSRIs)
adminis-tration causes an overall increase of extracellular serotonin
(5-HT) level in the brain (
Savitz et al. 2009
), by reducing
pre-synaptic serotonin reuptake (
Nutt et al. 1999
). Behaviorally,
acute SSRIs administration in healthy subjects improve the
rec-ognition of both fearful (
Browning et al. 2007
) and happy
faces (
Harmer et al. 2002
), whereas prolonged administration
reduces the recognition of fearful faces (
Harmer et al. 2004
).
Furthermore, neuroimaging studies revealed a face valence
se-lective effect of SSRIs on neural processing. For instance, causing
a reduced neural response to fearful faces within the amygdala,
parahippocampal, and medial prefrontal cortex (
Del-Ben et al.
2005
;
Harmer et al. 2006
;
Anderson et al. 2007
;
Norbury et al.
2007
;
Murphy et al. 2009
). Results for happy faces processing are
less consistent, showing either an increased (e.g.,
Norbury et al.
2007
) or nonsigni
ficantly decreased (e.g.,
Murphy et al. 2009
)
amygdala activity after SSRIs administration.
Growing evidence suggests that speci
fic serotonin receptor
subtypes are critically involved in mood disorders (
Millan
2006
;
Sharp and Cowen 2011
). For instance, it has been shown
that the selective 5-HT1A/2A receptor agonist psilocybin
modulates the neural activity within circuits related to emotion
regulation (
Nichols 2004
;
Vollenweider and Kometer 2010
;
Carhart-Harris, Erritzoe, et al. 2012
;
Carhart-Harris, Leech,
et al. 2012
). Accordingly, acute psilocybin administration
modulates emotional face processing (
Kometer et al. 2012
;
Schmidt et al. 2013
). For instance,
Schmidt et al. (2013)
demon-strated
that
psilocybin
reduces the
electrophysiological
response to both neutral and fearful faces. Speci
fically, they
showed a temporal selective effect of psilocybin on emotional
face processing; psilocybin did not modulate the
first
rapid-course emotion categorization, occurring at
∼100 ms
poststi-mulus onset, but rather the
fine-grained analysis of the facial
features (i.e.,
“structural encoding”), occurring at ∼170 ms.
Taken together, these results provide a
first evidence that
the selective 5-HT1A/2A receptor agonist psilocybin modulates
emotional face processing. However, the spatiotemporal
dy-namics of the neurophysiological alterations underlying these
psilocybin-induced effects remains poorly understood.
To further elucidate this issue, in the present study we
con-ducted electrical neuroimaging analyses on visual evoked
potentials (VEPs) in response to facial expressions (fearful,
happy, and neutral) under placebo and psilocybin. Electrical
neuroimaging analyses allow to differentiate modulations in
response strength and topography, and localize effects using a
distributed source model (LAURA) (
Michel et al. 2004
;
Murray
et al. 2008
). Thus, the present study provides a differentiated
description of the neurophysiological mechanisms
underpin-ning psilocybin
’s effects on emotional face processing.
Materials and Methods
Participants
Thirty healthy (27 right-handed) participants 16 males (mean ± SEM age: 25 ± 0.6 years), with normal or corrected-to-normal vision
© The Author 2013. Published by Oxford University Press. All rights reserved. Cerebral Cortex December 2014;24:3221–3231
doi:10.1093/cercor/bht178
participated in the study. Participants were healthy according to medical history, clinical examination, electrocardiography, and blood analysis. They were screened by the DIA-X diagnostic expert system (Wittchen and Pfister 1997), a semistructured psychiatric interview to exclude individuals with personal or family (first-degree relatives) his-tories of major psychiatric disorders, and by the Symptom Checklist (SCL-90–R) (Derogatis 1994). Furthermore, they underwent to the Mini-International Neuropsychiatric Interview (M.I.N.I.), a structured psychiatric interview (Sheehan et al. 1998). Participants were ex-cluded, if they had history of drug dependence, as assessed by a self-made consumption questionnaire, or if they were currently using drugs as assessed by a urine drug test. Nevertheless, seven participants were occasional smokers (<6 cigarettes/day), 7 participants reported a sporadic or rare cannabis use in the past (<2 joints/month), one partici-pant reported previous experience with MDMA (one pill lifetime), and one reported previous experience with psilocybin (one administration lifetime).
The study was approved by the Ethics Committee of the Canton of Zurich, Switzerland. After receiving a written and oral description of the aim of this study, all participants gave written informed consent statements before inclusion. The use of psilocybin was authorized by the Swiss Federal Office for Public Health, Department of Pharma-cology and Narcotics, Berne, Switzerland.
Drug Administration
Using a randomized, double-blind, placebo-controlled design, all par-ticipants received either psilocybin or placebo in 2 separate sessions, separated by at least 2 weeks.
Psilocybin was obtained through the Swiss Federal Office for Public Health. Psilocybin (170μg/kg) and lactose placebo were administered in gelatin capsules of identical number and appearance, as previously described (Kometer et al. 2011;Schmidt et al. 2013). Participants re-mained monitored until all acute drug effects had worn off, and were subsequently released into the custody of a partner.
Psychological Assessment
The Altered State of Consciousness (ASC) questionnaire, a visual analog and self-rating scale, was used to assess the subjective psycho-logical effects induced by psilocybin (Dittrich 1998). A recent evalu-ation of the ASC questionnaire has constructed eleven new lower order scales (Studerus et al. 2010), which were used in this study. The ASC questionnaire was applied 360-min post-treatment to retrospectively rate subjective experiences since drug intake.
Stimuli and Task Design
The experiment consisted in an EEG passive-viewing emotional face task. All target emotional faces were backward masked with a neutral face. Participants were instructed to determine the emotional valence of each face (neutral, fearful, and happy) no response was required. They performed the experiment twice (distinct sessions/days), one for each treatment (i.e., placebo and psilocybin).
Stimuli were black and white images taken from the Ekman–Friesen series (Ekman and Friesen 1976). The target images were neutral and basic emotional expressions (i.e., fearful and happy faces). The masking photograph was always a neutral face of the same identity. For each face valence, 6 different identities were used. To limit con-founds by low-level face processing qualities, faces were modified using Photoshop 2.0 (Adobe Systems Incorporated, San Jose, CA, USA) such that task-irrelevant features were removed and that the only visible features of the faces were the eyes, eyebrows, nose, and mouth. Stimuli were displayed in the center of the monitor and subtended a visual angle of 3° horizontally and 4.4° vertically.
Each trial began with afixation cross-lasting for 2000 ms. The target faces (i.e., neutral, fearful, and happy) were presented for either 10 ms (unconscious condition) or 200 ms (conscious condition) (Williams et al. 2004). Each target face was immediately followed by a mask (i.e., neutral face) lasting for 150 ms. For each experimental session, a total of 40 trials (target-mask pairs) were presented for each face valence and for the 2 target durations, resulting in a total of 240 images. Target
faces were randomly presented with equal probability. The experiment was conducted in a sound attenuated and electrically shielded booth. Stimulus delivery and participants’ responses were controlled by Eprime 2.0 (Psychology Software Tools, PA, USA). Timing issues were controlled using an oscilloscope. Because recent evidence revealed that psilocybin attenuates the explicit recognition of negative expressions (Kometer et al. 2012) and that its effect on VEPs to emotional face expressions were more pronounced during conscious than nonconscious processing (Schmidt et al. 2013), in the present study, we specifically aimed to further explore the effect of psilocybin on the conscious processing of emotional faces by disentangling the spatiotemporal brain dynamics of this effect. The EEG data recorded during unconscious face processing will be included in a further study.
EEG Acquisition and Preprocessing
Continuous EEG was acquired at 512 Hz through a 64-channel Biosemi ActiveTwo AD-box referenced to the common mode sense (CMS; active electrode) and grounded to the driven right leg (DRL; passive electrode), which functions as a feedback loop driving the average potential across the electrode montage to the amplifier zero. Data pre-processing and analyses were performed using Cartool Software (Brunet et al. 2011;http://sites.google.com/site/fbmlab/cartool). The EEG epochs were defined from 100 ms prestimulus (i.e., emotional face) to 500 ms poststimulus onset. All analyses were always conducted over the full ERP epoch. EEG epochs from 100 ms pre- to 500 ms post-stimulus onset were averaged from each participant to calculate ERPs for each treatment (i.e., placebo or psilocybin) and face valence (i.e., neutral, fearful, and happy), generating separate 2 × 3 within-subject designs. In addition to visual inspection, a semiautomated ±60μV arti-fact rejection criterion was applied in order to reject epochs with eye blinks and/or other sources of transient noise. Prior to group-averaging for each experimental condition, data at artifact-contaminated electrodes from each participant were interpolated using 3D splines (Perrin et al. 1987). Data were then recalculated against the average reference and band-pass-filtered (0.18–40 Hz). The baseline was defined as the 100 ms prestimulus period. No prestimulus baseline correction was applied for the following reasons: 1) we could not assume that the preparatory processes were similar across conditions (i.e., with and without treatment) 2) baseline correction can affect the topography of the data and potentially shift statistical effects in time (Michel et al. 2009;Tzovara et al. 2012for discussion).
The average number of accepted EEG epochs per each drug con-dition were: Concon-dition 1 ( placebo) neutral face: (mean ± SEM; 32.8 ± 1.13), fearful face: (mean ± SEM; 32.5 ± 1.35), happy face (mean ± SEM; 31.86 ± 1.23); condition 2 ( psilocybin) neutral face: (mean ± SEM; 31.5 ± 1.26), fearful face: (mean ± SEM; 31.13 ± 1.26), happy face (mean ± SEM; 30.09 ± 1.19). Conditions were not signi fi-cantly different (2-way ANOVA: interaction treatment × face: F2,58= 0.177; P-values >0.8; main effect face: F2;58= 1.41; P-values >0.3; main effect treatment: F1,29= 0.64, P-values >0.5). Because the number of accepted epochs did not differ significantly across con-ditions we can exclude that our effects followed from differences in signal-to-noise ratios.
EEG Analyses and Source Estimation General Analysis Strategy
Effects of psilocybin on emotional face processing were identified with a stepwise analysis procedure referred as electrical neuroimaging, implemented in Cartool (Brunet et al. 2011; http://sites.google.com/ site/fbmlab/cartool). By analyzing the ERPs using Electrical Neuroima-ging, we were allowed to assess and differentiate effects following from: 1) strength modulations of statistically indistinguishable genera-tor configurations (i.e., Global Field Power modulations in absence of topographic modulations), 2) topographic modulations across conditions, resulting from changes in the intracranial sources con figur-ation, 3) latency shifts across conditions. Because each analyses is independent one from the other, any combination of these neurophy-siologic phenomena can be assessed (Michel et al. 2004,2009;Murray et al. 2008). Finally, we used the local autoregressive average
distributed linear inverse solution (LAURA;Grave de Peralta Menendez et al. 2001,2004) to visualize and statistically assess the likely under-lying sources of effects identified in the previous analysis steps (GFP and/or topographic modulations).
Voltage Waveform Analyses
Afirst level of analysis was performed by submitting the VEPs data to a 2-way ANOVA using the within-subject factors treatment ( placebo; psi-locybin) and face valence (neutral; fear; happy) at each scalp electrode as a function of peristimulus time. Note that only effects meeting or ex-ceeding the P-values 0.05 criterion for at∼15 consecutive milliseconds were considered reliable (Guthrie and Buchwald 1991). This analysis was included to give a visual impression of specific effects within the dataset, and to facilitate the contextualization of our results with other VEP studies (e.g.,Schmidt et al. 2013). However, due to the electrode reference-dependent nature of statistical analyses of AEP waveforms (a change of the reference electrode will result in a change in statistical outcomes (Tzovara et al. 2012for discussion), our primary analyses and basis for interpretation were the electrode reference-independent analyses detailed below.
Global Electric Field Analyses
Changes in the strength of the electricfield at the scalp were calculated using the globalfield power (GFP), a reference electrode-independent analyses (Murray et al. 2008;Koenig and Melie-García 2010), for each participant and experimental condition. GFP measures the strength of the electricfield at the scalp, independently of its spatial distribution across the electrode montage (Lehmann and Skrandies 1980;Murray et al. 2008, 2009). The GFP is calculated as the square root of the mean of the squared value recorded at each electrode and represents the spatial standard deviation of the electric field at the scalp at each instant in time. Modulations in GFP were statistically analyzed at each time-point using a 2-way ANOVA using within-subject factors of treat-ment and face valence. We would like to point out that to reduce the risk of false-positive results arising from multiple tests only effects at least of a P-values 0.05 criterion lasting at least∼15 consecutive millise-conds were considered reliable (Guthrie and Buchwald 1991, similar criterions were used previously, e.g.,De Lucia et al. 2010;Knebel et al. 2011;Cappe et al. 2012).
Topographic Modulations Analyses
Topographic modulations were identified using global dissimilarity (DISS) (Lehmann and Skrandies 1980), which is calculated as the root mean square of the difference between 2 strength-normalized vectors (i.e., the instantaneous voltage potentials across the electrode montage). The DISS value between the face valences as a function of treatment were compared time-point by time-point with an empirical distribution derived from a bootstrapping procedure (5000 permu-tations per data point), based on randomly reassigning data across con-ditions for each participants (detailed inMurray et al. 2008;Koenig et al. 2011). DISS is an electrode reference-independent analysis. More-over, GFP and DISS are 2 orthogonal analyses because DISS is insensi-tive to pure amplitude modulations across conditions. A topographic modulation is neurophysiological interpreted as a changes following from a significant differences in the configuration of the intracranial generators (Lehmann 1987). As for GFP analyses, temporal autocorre-lation was corrected through the application of a∼15 continuous milli-seconds as temporal criterion for the persistence of differential significant effects (Guthrie and Buchwald 1991, similar criterions were used previously, e.g.,De Lucia et al. 2010;Knebel et al. 2011;Cappe et al. 2012).
Source Estimations
We estimated the electrical activity in the brain using a distributed linear inverse solution applying the local autoregressive average regu-larization approach (LAURA), comprising biophysical laws as con-straints (Grave de Peralta Menendez et al. 2001; 2004;Michel et al. 2004). For the leadfield matrix calculation, we applied the spherical model with anatomical constraints (SMAC) method (Spinelli et al.
2000), which transforms the MRI to the best-fitting sphere using homo-geneous transformation operators. It then determines a regular grid of 3005 solution points in the gray matter of this spherical MRI and com-putes the leadfield matrix using the known analytical solution for a spherical head model with 3 shells of different conductivities as defined byAry et al. (1981).
The periods of significant treatment × face valence interaction deter-mined in the GFP analysis were used as period of interest, on which carry out the source estimations for each experimental condition. To increases the signal-to-noise ratio, VEPs for each participant and each experimental condition were separately averaged across the above-mentioned time periods when significant treatment × face valence interactions were identified in the GFP analysis. The inverse solution was then estimated for each of the 3005 nodes. These data were then submitted to a 2-way ANOVA using within-subject factors of treatment and face valence. To correct for multiple testing and temporal autocor-relation, only nodes with P-values <0.05 2-tailed and clusters of at least 21 contiguous nodes were considered significant (these criteria were published elsewhere, e.g.,Bernasconi et al. 2011). The spatial criterion was determined using the AlphaSim program (http://afni.nimh.nih. gov/afni/doc/manual/AlphaSim). The results of source estimations were rendered on the Montreal Neurological Institute’s average brain with theTalairach and Tournoux (1988)coordinates.
Results
Psychometrics
Psilocybin produced alterations on the global ASC scores
(Fig.
1
). A 2-way treatment × scale interaction indicated signi
fi-cant difference on speci
fic scales (F
1,319= 11.263; P < 0.001).
Furthermore, post hoc testing on this interaction showed that
psilocybin versus placebo signi
ficantly increased all scores (all
P-values <0.001; Bonferroni corrected), with the exception of
anxiety (P-value >0.9; Bonferroni corrected) and spiritual
experience scores (P-values >0.4; Bon ferroni corrected).
VEP Waveform Analysis
A
first level of analysis of the VEPs to emotional faces was
per-formed using individual voltage waveforms, visual inspection
of an occipital electrode (P8) indicate several effects:
first a
main effect of treatment, such that psilocybin appears to
reduce the N170 response and a shift in latency, to the right, at
∼200 ms poststimulus, independently of the face valence.
Second, as expected, the N170 component is modulated by the
emotional faces (fear and happy) vs. neutral face. These
obser-vations were statistically evaluated via a timewise 2-way
ANOVA (treatment × face valence). A signi
ficant (P-value
<0.05; >15 continuous milliseconds) treatment × face
inter-action was observed over the period 152
–183 and 193–265 ms
(Fig.
2
a). Furthermore, there was a main effect of treatment
(P-value <0.05; >15 continuous milliseconds) over the 152
–183
and 193
–265 ms poststimulus interval; a main effect of face
(P-value <0.05; >15 continuous milliseconds) was observed
over 66
–92, 105–220, and 230–367 ms poststimulus interval
(results not shown).
A second level of analysis of the VEPs was performed using
group-averaged VEPs evoked by emotional face (i.e., neutral,
happy and fear), which were compared as a function of
treat-ment ( placebo vs. psilocybin). Time-wise 2-way ANOVA
(treatment × face valence) analyses was performed as a
func-tion of peristimulus time at each of the scalp electrodes.
Stat-istically signi
ficant interaction between treatment and face
valence (P-value <0.05, >15 consecutive milliseconds) were
observed at
∼100–300 ms poststimulus stimulus (Fig.
2
b).
Fur-thermore, a main effect of treatment was observed over the
period:
∼120–140, ∼170–220 and ∼230–400 ms poststimulus
and a main effect of face valence over the period:
∼160–200
and
∼240–360 ms (Figs.
3
a and
4
a).
The reader should have in mind that our conclusions over
the possible causes of the psilocybin-induced modulation of
emotional face processing are based on analyses of electrode
reference-independent features of the global electric
field at
the scalp (see below).
Global Electric Field Analyses
Of main interest to the aims of the present study, the time-point
by time-point 2-way ANOVA on GFP evidenced a signi
ficant
interaction between treatment and face valence over the period
168
–189 ms (F
2,51= 8.673;
P = 0.00051)
and
211
–242 ms
(F
2,51= 7.365; P = 0.0014) after the stimulus onset (Fig.
2
c), in
accordance with a psilocybin-induced response modulation
(vs. placebo).
Post hoc t-test on GFP over the 168
–189 ms pointed out a
signi
ficant decrease in GFP for both neutral and happy
(P-values <0.01; Bonferroni corrected), while over the period
211
–242 ms a significant decrease in GFP only for happy faces
(P-value <0.01; Bonferroni corrected) (results not shown).
A main effect of treatment (t-values >3.565; P-values <0.05;
>15 consecutive milliseconds) was observed over the 94
–143
and 180
–219 ms poststimulus periods, and a main effect of
face valence (t-values >2.536; P-values <0.05; >15 consecutive
milliseconds) over the 37
–59, 105–139, 176–246 and 303–354
ms poststimulus periods (Figs.
3
b and
4
b).
By contrast, the nonparametric DISS statistics (used to
assess topographic modulations across conditions) did not
reveal signi
ficant interaction between treatment and face
valence over the 500 ms poststimulus (P-values <0.05; >15
con-secutive milliseconds; Figure
2
d). A main effect of treatment
was observed over the
−26–103; 99–219; 110–220 and 230–
304 ms poststimulus periods (Fig.
3
c) and a main effect of face
valence over the 156
–214 and 250–364 ms poststimulus
periods (Fig.
4
c).
Since the aim of the study was to identify
neurophysiologi-cal modulation induced by psilocybin to emotional face
pro-cessing,
the
2
periods
of
signi
ficant GFP interaction
(treatment × face valence) were selected as time period
sub-mitted to source estimations.
Source Estimations
LAURA distributed source estimations were calculated over the
168
–189 and 211–242 ms poststimulus time periods, which
in-dicated a signi
ficant GFP interaction between treatment and
face valence.
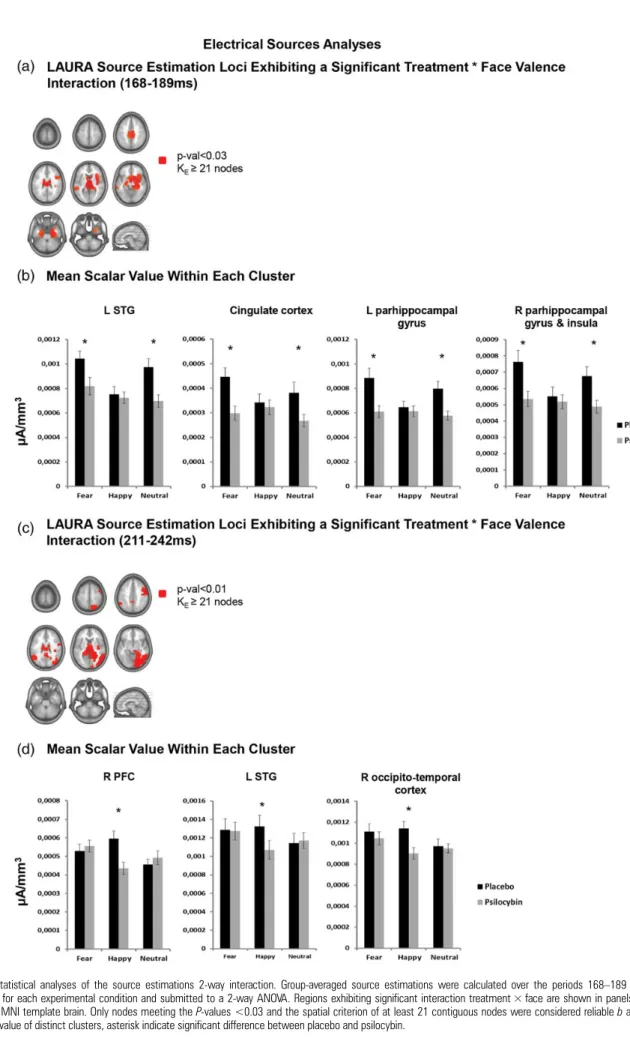
Over the 168
–189 ms period a significant interaction
treatment × face valence (F
2,58> 5.26; P-values <0.03; kE = 21
contiguous solution points) was observed within the visual
areas (right fusiform gyrus), limbic areas (bilateral
parahippo-campal gyrus, middle-posterior cingulate cortex and
amygda-la), temporoparietal areas (right insula; left middle-superior
temporal gyrus) and the prefrontal areas (right inferior frontal
cortex) (Fig.
5
a). Over the 211
–242 ms period a significant
interaction (F
(2,58)>10.13; P-values <0.01; kE = 21 contiguous
solution points) was observed within the visual area (right
lingual gyrus, fusiform gyrus and middle-inferior occipital
gyrus), the limbic areas (bilateral hippocampus and right
para-hippocampal gyrus), temporoparietal areas (middle-inferior
temporal gyrus) and the prefrontal areas (right precentral
gyrus) (Fig.
5
c).
To assess the basis of the signi
ficant treatment × face
valence, brain regions indicating signi
ficant treatment × face
interaction (see above) were subdivided in distinct clusters
ac-cording to literature (e.g.,
Fusar-Polli et al. 2009
), and the
group-average scalar values across the nodes within each
clus-ters were calculated (shown as bar graphs in Fig.
5
b and d).
Over the
first time period of interest (168–189 ms) in all 4
clus-ters (i.e., left STG; bilateral cingulate cortex; left
parahippoca-mal gyrus and right insual/parahippocampal gyrus) signi
ficant
Figure 1. Psychometrics results. Effects of psilocybin on the ASC scales. Mean scores ± SEM. Asterisks indicate significant differences between treatments. Symptoms scores were expressed as percent of scale maximum.
(P-values <0.01; Bonferoni corrected) reductions of the activity
were observed for both neutral and fearful faces, but not for
happy faces (P-values >0.5). Over the second period of interest
(211
–242 ms) for all clusters (i.e., right prefrontal cortex; right
occipito-temporal cortex; left STG) signi
ficant (P-values <0.01;
Bonferoni corrected) reductions in the neurophysiological
response were observed exclusively for the happy faces.
Discussion
We identi
fied the spatiotemporal brain dynamics underlying
emotional face processing modulations induced by psilocybin,
a serotonin 5-HT1A/2A receptor agonist. Brain mechanisms
associated with such modulations were identi
fied by applying
electrical neuroimaging analyses to the VEPs in response to
emotional faces as a function of treatment (i.e., placebo vs.
Figure 2. (a) Electrical neuroimaging results. Exemplar VEP waveform from a right occipital electrode (P8). VEP in response to neutral (black trace), fearful (red trace), happy face (green trace) under placebo. VEP in response to neutral (dark blue), fearful (light blue trace), happy face ( pink trace) under psilocybin. Traces are displayed in microvolts as a function of time relative to onset of the emotional face. The time period with a significant interaction treatment × face is indicated with a gray square (P < 0.05 for at least ∼15 consecutive milliseconds). (b) VEP voltage waveform analyses. The results of the millisecond-by-millisecond 2-way ANOVA (treatment × face valence) at each of the scalp electrodes from the group-averaged VEP waveforms are shown (only P < 0.05 for at least ∼15 consecutive milliseconds). (c) Results of the millisecond-by-millisecond 2-way ANOVA analysis (black line; interaction treatment × face) of the globalfield power over the entire epoch. Period of significant (P < 0.05 for at least ∼15 consecutive milliseconds) GFP interaction treatment × face are marked in gray. (d) Results of the millisecond-by-millisecond 2-way ANOVA of the global dissimilarity. Period of significant (P < 0.05 for at least ∼15 consecutive milliseconds) topographic interaction treatment × face are marked in gray.
psilocybin). We identi
fied 2 distinct time periods of strength
(GFP) modulation induced by psilocybin administration.
Dis-tributed source estimations over these 2 time periods further
indicated a face valence speci
fic effect of psilocybin. The
col-lective
findings support a model in which serotonin 5-HT1A/2A
receptor stimulation has selective and temporal dissociable
effects on the neuronal correlates of emotional face processing.
The latencies of our effects are consistent with a modulation
of the
fine-tuning categorization of facial expressions (
Adolphs
2002
). According to both animal intracranial recording
and human electrophysiological studies, which investigated
emotional face processing, an initial course categorization of
the face occurs already at
∼100 ms poststimulus, as suggested
by an increased electrophysiological response to both face vs.
object and emotional faces vs. neutral faces (
Sugase et al. 1999
;
Adolphs 2002
). The initial categorization is succeeded by a
fine-grained encoding (i.e., “structural encoding”) of facial
fea-tures, as suggested by an increased electrophysiological
response to emotional faces observed
∼50 ms after the course
categorization (
Pegna et al. 2008
;
Smith 2012
,
Schmidt et al.
2013
).
Furthermore, the latency of our effects are also consistent
with previous studies, which investigated effects of
serotoner-gic manipulation on faces processing. For instance,
Schmidt
et al. (2013)
demonstrated a psilocybin-induced modulation of
the structural encoding of emotional faces occurring at
∼170 ms
after the stimulus onset. However, further studies, which
investigated the effects of acute selective serotonin reuptake
inhibitors (SSRIs), observed a modulation of the emotional
“expression decoding” (occurring at ∼250 ms) but not of the
Figure 3. (a) Electrical neuroimaging results. VEP voltage waveform analyses. The results of the millisecond-by-millisecond main effect of treatment at each of the scalp electrodes from the group-averaged VEP waveforms are shown (only P < 0.05 for at least ∼15 consecutive milliseconds). (b) Results of the millisecond-by-millisecond main effect of treatment (black line) of the globalfield power over the entire epoch. Period of significant (P < 0.05 for at least ∼15 consecutive milliseconds) GFP interaction treatment × face are marked in gray. (c) Results of the millisecond-by-millisecond main effect of treatment of the global dissimilarity. Period of significant (P < 0.05 for at least ∼15 consecutive milliseconds) topographic interaction treatment × face are marked in gray.
“structural encoding” (
Kerestes et al. 2009
;
Labuschagne et al.
2010
). The incongruence with our results might be due to a
more speci
fic effect of psilocybin vs. SSRIs on the 5-HT system
(see
Nichols 2004
and
Elliott et al. 2011
for discussion).
Source estimations over the 168
–189 ms time period
re-vealed a reduced neurophysiological response to both neutral
and fearful faces within right fusiform gyrus, temporoparietal
cortices, prefrontal areas and bilateral limbic areas, as well as a
reduced response to happy faces within the right lingual
gyrus, fusiform gyrus, middle-inferior occipital gyrus, bilateral
limbic areas, temporoparietal cortices and the prefrontal areas
over the 211
–242 ms poststimulus period.
The temporal selective effects of psilocybin on emotional face
processing (i.e., initial effect on both fearful and neutral faces,
followed by effect on happy faces) are consistent with previous
ERPs studies, which suggested a faster processing of negative
compared with positive stimuli, due to the ecological
impor-tance of detecting signals of danger (
Williams et al. 2006
).
However, few ERPs studies demonstrated that happy faces are
processed faster than fearful faces (e.g.,
Batty and Taylor 2003
).
According to the authors, this counterintuitive result might be
explained by the fact that negative stimuli are processed within
a subcortical-slower pathway via the superior colliculus and
pulvinar to the amygdala, consistent with anatomical studies in
monkey (
Day-Brown et al. 2010
). Furthermore, over both
periods of interest a stronger activity was localized
predomi-nantly within the right hemisphere, in line with previous studies
that demonstrated a right lateralization of the emotional
proces-sing within the
first 200 ms poststimulus (e.g.,
Williams et al.
2006
;
Fusar-Poli et al. 2009
for discussion).
Figure 4. (a) Electrical neuroimaging results. VEP voltage waveform analyses. The results of the millisecond-by-millisecond main effect of face valence at each of the scalp electrodes from the group-averaged VEP waveforms are shown (only P < 0.05 for at least ∼15 consecutive milliseconds). (b) Results of the millisecond-by-millisecond main effect of face (black line) of the globalfield power over the entire epoch. Period of significant (P < 0.05 for at least ∼15 consecutive milliseconds) GFP interaction treatment × face are marked in gray. (c) Results of the millisecond-by-millisecond main effect of face of the global dissimilarity. Period of significant (P < 0.05 for at least ∼15 consecutive milliseconds) topographic interaction treatment × face are marked in gray.
Figure 5. Statistical analyses of the source estimations 2-way interaction. Group-averaged source estimations were calculated over the periods 168–189 and 211–242 ms poststimulus for each experimental condition and submitted to a 2-way ANOVA. Regions exhibiting significant interaction treatment × face are shown in panels a and c on axial slices of the MNI template brain. Only nodes meeting the P-values <0.03 and the spatial criterion of at least 21 contiguous nodes were considered reliable b and d. indicate the mean scalar value of distinct clusters, asterisk indicate significant difference between placebo and psilocybin.
Furthermore, our source localizations are consistent with
previous fMRI studies, which investigated neurophysiological
modulations induced by citalopram, a SSRI (
Anderson et al.
2007
;
Harmer 2008
). For instance, neurophysiological
modu-lations were observed within the
“core system” of the
emotion-al face processing network (
Haxby et al. 2000
), comprising
occipital face-sensitive areas, the lateral fusiform gyrus
(iden-tity recognition), the superior temporal cortex (expression
rec-ognition), and within the
“extended system” including the
amygdala, the orbitofrontal cortex and the posterior cingulate
cortex (emotion recognition) (
Paulus et al. 2005
;
Anderson
et al. 2007
;
Arce et al. 2008
;
Wingen et al. 2008
;
Bruhl et al.
2010
).
During emotional face processing, these regions are
func-tionally connected (e.g.,
Dima et al. 2011
;
Disner et al. 2011
;
Zhen et al. 2013
), where the key structure of this network is
the amygdala (e.g.,
Pessoa and Adolphs 2010
). Thus, the
ob-served impaired emotional face processing after psilocybin
administration might be associated with an impaired
func-tional connectivity between the amygdala and other key
struc-tures for emotional face processing (
Vollenweider and
Kometer 2010
for discussion). However, this is clearly
specu-lative. In fact, in the present study used source localization
ex-clusively to identify changes in neural activity induced by
psilocybin and did not taken into account changes in
func-tional connectivity among regions critically involved during
emotional faces processing. This issue will be addressed in
further connectivity studies.
Furthermore, the difference between the effects induced by
SSRIs (increased or no effect) and psilocybin on happy face
processing might be due to different pharmacological effect of
the 2 compounds. Whereas SSRIs increase serotonin level in
the whole brain (
Nutt et al. 1999
;
Murphy et al. 2009
;
Norbury
et al. 2007
;
Elliott et al. 2011
), psilocybin has a more speci
fic
af-finity for serotonin 2A receptors, essentially located on the
pyr-amidal cells within the PFC (
Vollenweider et al. 1997
;
Nichols
2004
). Accordingly, reduced serotonin level by acute
trypto-phan depletion (ATD) did not modulate the structural
encod-ing of emotional faces (
Jaworska et al. 2010
) providing
additional evidence for a more speci
fic pharmacological action
of psilocybin.
Mechanistically, we interpret the reduced
neurophysiologi-cal response across all face valences as modulation of selective
attention induced by psilocybin, consistent with previous
studies, which demonstrated an attenuation of the visual
atten-tional performance in a dose-dependent manner (
Gouzoulis-Mayfrank et al. 2002
;
Carter et al. 2005
;
Vollenweider et al.
2007
;
Quednow et al. 2012
).
Over both 168
–189 and 211–242 ms poststimulus intervals
we observed a pure change in response strength induced by
psilocybin, consistent with a quantitative modulation of the
at-tention level (
Hillyard and Anllo-Vento 1998
;
Luck et al. 2000
).
Accordingly,
Wronka and Walentowska
’s (2011)
ERPs study
demonstrated that when facial expressions were attended an
increased N170 was measured for facial expressions vs. neutral
faces. This was not the case when attention was directed to the
face gender, suggesting a top-down attentional control on
emotional face processing. In line with these results,
Bressler
et al. (2008)
demonstrated a reduced attentional performance
in visual tasks due to an increased top-down control.
Further-more,
Bayle and Taylor (2010)
suggested that attention
modu-lates the structural encoding of faces, which occurs at
∼170 ms
after the stimulus onset. The top-down control during
emotion-al face processing was shown to modulate the activity within
the amygdala, occipito-temporal visual cortex, orbitofrontal
and posterior cingulate cortex, independent of the emotional
valence (
Pessoa et al. 2002
;
Bayle and Taylor 2010
).
Evidence from animal and human PET imaging studies
support the putative modulation of the top-down control
induced by psilocybin. In fact, they suggest that activity within
the PFC is modulated by the 5-HT2A receptors on pyramidal
cells (
Wing et al. 1990
;
Vollenweider et al. 1997
). Thus,
stimu-lation of the 5-HT2A receptors with psilocybin results in an
en-hanced top-down control of the PFC over limbic areas
(
Vollenweider et al. 1997
;
Vollenweider and Kometer 2010
for
discussion).
Additional evidence of a serotonin-induced modulation of
the PFC top-down control over the limbic areas is provided by
studies on patients with depression and anxiety, which are
characterized by an impaired serotonergic system (
Stuhrmann
et al. 2011
for a review). Depressed patients were associated
with a reduced PFC activity as well as hyperactivity within the
amygdala, parahippocampal gyrus, and fusiform gyrus in
response to negative stimuli. Likely, the hyperactivity is due to
a reduced top-down control of the PFC (
Johnstone et al. 2007
;
Bishop 2008
).
Collectively, these results support the hypothesis of a
modu-lation of the top-down control of the PFC over the limbic areas
induced by the serotonergic system.
In conclusion, the present results are the
first reporting the
spatiotemporal brain dynamics of psilocybin-induced
modu-lations of emotional face processing in healthy volunteers,
providing new insights on the role of the serotonergic system
on emotional face processing. We demonstrated a reduced
neural response to both neutral and emotional faces induced
by psilocybin, due to a psilocybin-induced increase in
top-down control. The timing of our effects suggests that
psilocybin
modulates
the
fine-grained emotional face
categorization.
Author Contributions
F.B. performed research, analyzed data, and wrote the paper.
F.X.V. and E.S. designed, and wrote the paper. A.S. and M.K.
designed and wrote the paper. T.P. performed research.
Funding
This work was supported by a grant from Swiss Neuromatrix
Foundation (FXV). Cartool software (
http://sites.google.com/
site/fbmlab/cartool
) has been programmed by Denis Brunet,
from the Functional Brain Mapping Laboratory, Geneva,
Swit-zerland, and supported by the Center for Biomedical Imaging
(CIBM) of Geneva and Lausanne.
Notes
We thank Krähenmann R. for the proofreading the manuscript. Conflict of Interest: None declared.
References
Adolphs R. 2002. Recognizing emotion from facial expressions: psychological and neurological mechanisms. Behav Cogn Neurosci Rev. 1:21–62.
Anderson IM, Del-Ben CM, McKie S, Richardson P, Williams SR, Elliott R, Deakin JF. 2007. Citalopram modulation of neuronal responses to aversive face emotions: a functional MRI study. Neuroreport. 18:1351–1355.
Arce E, Simmons AN, Lovero KL, Stein MB, Paulus MP. 2008. Escitalo-pram effects on insula and amygdala BOLD activation during emotional processing. Psychopharmacology (Berl). 196:661–672. Ary JP, Klein SA, Fender DH. 1981. Location of sources of evoked scalp
potentials: corrections for skull and scalp thicknesses. IEEE Trans Biomed Eng. 28:447–452.
Batty M, Taylor MJ. 2003. Early processing of the six basic facial emotional expressions. Brain Res Cogn Brain Res. 17:613–620. Bayle DJ, Taylor MJ. 2010. Attention inhibition of early cortical
acti-vation to fearful faces. Brain Res. 1313:113–123.
Bernasconi F, De LM, Tzovara A, Manuel AL, Murray MM, Spierer L. 2011. Noise in brain activity engenders perception and influences discrimination sensitivity. J Neurosci. 31:17971–17981.
Bishop SJ. 2008. Neural mechanisms underlying selective attention to threat. Ann N Y Acad Sci. 1129:141–152.
Bressler SL, Tang W, Sylvester CM, Shulman GL, Corbetta M. 2008. Top-down control of human visual cortex by frontal and parietal cortex in anticipatory visual spatial attention. J Neurosci. 28:10056–10061. Browning M, Reid C, Cowen PJ, Goodwin GM, Harmer CJ. 2007. A
single dose of citalopram increases fear recognition in healthy sub-jects. J Psychopharmacol. 21:684–690.
Bruhl AB, Kaffenberger T, Herwig U. 2010. Serotonergic and noradren-ergic modulation of emotion processing by single dose antidepress-ants. Neuropsychopharmacology. 35:521–533.
Brunet D, Murray MM, Michel CM. 2011. Spatiotemporal analysis of multichannel EEG: CARTOOL. Comput Intell Neurosci. 2011: 813870.
Cappe C, Thelen A, Romei V, Thut G, Murray MM. 2012. Looming signals reveal synergistic principles of multisensory integration. J Neurosci. 32:1171–1182.
Carhart-Harris RL, Erritzoe D, Williams T, Stone JM, Reed LJ, Colasanti A, Tyacke RJ, Leech R, Malizia AL, Murphy K et al. 2012. Neural cor-relates of the psychedelic state as determined by fMRI studies with psilocybin. Proc Natl Acad Sci USA. 109:2138–2143.
Carhart-Harris RL, Leech R, Williams TM, Erritzoe D, Abbasi N, Bargio-tas T, Hobden P, Sharp DJ, Evans J, Feilding A et al. 2012. Implications for psychedelic-assisted psychotherapy: functional magnetic reson-ance imaging study with psilocybin. Br J Psychiatry. 200:238–244. Carter OL, Burr DC, Pettigrew JD, Wallis GM, Hasler F, Vollenweider
FX. 2005. Using psilocybin to investigate the relationship between attention, working memory, and the serotonin 1A and 2A receptors. J Cogn Neurosci. 17:1497–1508.
Day-Brown JD, Wei H, Chomsung RD, Petry HM, Bickford ME. 2010. Pulvinar projections to the striatum and amygdala in the tree shrew. Front Neuroanat. 4:143.
Del-Ben CM, Deakin JF, McKie S, Delvai NA, Williams SR, Elliott R, Dolan M, Anderson IM. 2005. The effect of citalopram pretreatment on neuronal responses to neuropsychological tasks in normal volunteers: an FMRI study. Neuropsychopharmacology. 30: 1724–1734.
De Lucia M, Clarke S, Murray MM. 2010. A temporal hierarchy for con-specific vocalization discrimination in humans. J Neurosci. 30 (33):11210–11221.
Derogatis L. 1994. SCL-90-R: Symptom Checklist-90-R. Administration, scoring and procedures manual. Minneapolis: National Computer Systems.
Dima D, Stephan KE, Roiser JP, Friston KJ, Frangou S. 2011. Effective connectivity during processing of facial affect: evidence for mul-tiple parallel pathways. J Neurosci. 31:14378–14385.
Disner SG, Beevers CG, Haigh EA, Beck AT. 2011. Neural mechanisms of the cognitive model of depression. Nat Rev Neurosci. 12:467–477. Dittrich A. 1998. The standardized psychometric assessment of altered states of consciousness (ASCs) in humans. Pharmacopsychiatry. 31 (Suppl 2):80–84.
Ekman P, Friesen W. 1976. Pictures of facial affect. Palo Alto: Consult-ing Psychologists.
Ekman P, Friesen WV, O’Sullivan M, Chan A, Diacoyanni-Tarlatzis I, Heider K, Krause R, LeCompte WA, Pitcairn T et al. 1987. Universals and cultural differences in the judgments of facial expressions of emotion. J Pers Soc Psychol. 53:712–717.
Elliott R, Zahn R, Deakin JF, Anderson IM. 2011. Affective cognition and its disruption in mood disorders. Neuropsychopharmacology. 36:153–182.
Fusar-Poli P, Placentino A, Carletti F, Landi P, Allen P, Surguladze S, Benedetti F, Abbamonte M, Gasparotti R, Barale F et al. 2009. Func-tional atlas of emotional faces processing: a voxel-based meta-analysis of 105 functional magnetic resonance imaging studies. J Psychiatry Neurosci. 34:418–432.
Gouzoulis-Mayfrank E, Thelen B, Maier S, Heekeren K, Kovar KA, Sass H, Spitzer M. 2002. Effects of the hallucinogen psilocybin on covert orienting of visual attention in humans. Neuropsychobiology. 45:205–212.
Grave de Peralta MR, Gonzalez AS, Lantz G, Michel CM, Landis T. 2001. Noninvasive localization of electromagnetic epileptic activity. I. Method descriptions and simulations. Brain Topogr. 14: 131–137.
Grave de Peralta MR, Murray MM, Michel CM, Martuzzi R, Gonzalez Andino SL. 2004. Electrical neuroimaging based on biophysical constraints. Neuroimage. 21:527–539.
Guthrie D, Buchwald JS. 1991. Significance testing of difference poten-tials. Psychophysiology. 28:240–244.
Harmer CJ, Bhagwagar Z, Cowen PJ, Goodwin GM. 2002. Acute admin-istration of citalopram facilitates memory consolidation in healthy volunteers. Psychopharmacology (Berl). 163:106–110.
Harmer CJ, Mackay CE, Reid CB, Cowen PJ, Goodwin GM. 2006. Antidepressant drug treatment modifies the neural processing of nonconscious threat cues. Biol Psychiatry. 59:816–820.
Harmer CJ, Shelley NC, Cowen PJ, Goodwin GM. 2004. Increased posi-tive versus negaposi-tive affecposi-tive perception and memory in healthy volunteers following selective serotonin and norepinephrine reuptake inhibition. Am J Psychiatry. 161:1256–1263.
Harmer CJ. 2008. Serotonin and emotional processing: does it help explain antidepressant drug action? Neuropharmacology. 55: 1023–1028.
Haxby JV, Hoffman EA, Gobbini MI. 2000. The distributed human neural system for face perception. Trends Cogn Sci. 4:223–233. Hillyard SA, nllo-Vento L. 1998. Event-related brain potentials in the
study of visual selective attention. Proc Natl Acad Sci USA. 95:781–787.
Jaworska N, Thompson A, Shah D, Fisher D, Ilivitsky V, Knott V. 2010. Electrocortical effects of acute tryptophan depletion on emotive facial processing in depression-prone individuals. Eur Neuropsy-chopharmacol. 20:473–486.
Johnstone T, van Reekum CM, Urry HL, Kalin NH, Davidson RJ. 2007. Failure to regulate: counterproductive recruitment of top-down prefrontal-subcortical circuitry in major depression. J Neurosci. 27:8877–8884.
Kerestes R, Labuschagne I, Croft RJ, O’Neill BV, Bhagwagar Z, Phan KL, Nathan PJ. 2009. Evidence for modulation of facial emotional processing bias during emotional expression decod-ing by serotonergic and noradrenergic antidepressants: an event-related potential (ERP) study. Psychopharmacology (Berl). 202:621–634.
Knebel JF, Javitt DC, Murray MM. 2011. Impaired early visual response modulations to spatial information in chronic schizophrenia. Psychiatry Res. 193:168–176.
Koenig T, Kottlow M, Stein M, Melie-Garcia L. 2011. Ragu: a free tool for the analysis of EEG and MEG event-related scalpfield data using global randomization statistics. Comput Intell Neurosci. 2011: 938925.
Koenig T, Melie-Garcia L. 2010. A method to determine the presence of averaged event-related fields using randomization tests. Brain Topogr. 23:233–242.
Kometer M, Cahn BR, Andel D, Carter OL, Vollenweider FX. 2011. The 5-HT2A/1A agonist psilocybin disrupts modal object completion associated with visual hallucinations. Biol Psychiatry. 69(5):399–406.
Kometer M, Schmidt A, Bachmann R, Studerus E, Seifritz E, Vollenweider FX. 2012. Psilocybin biases facial recognition, goal-directed behavior, and mood state toward positive relative to negative emotions through different serotonergic subreceptors. Biol Psychiatry. 72:898–906. Labuschagne I, Croft RJ, Phan KL, Nathan PJ. 2010. Augmenting
sero-tonin neurotransmission with citalopram modulates emotional expression decoding but not structural encoding of moderate inten-sity sad facial emotional stimuli: an event-related potential (ERP) investigation. J Psychopharmacol. 24:1153–1164.
Lehmann D. 1987. Handbook of electroencephalography and clinical neurophysiology. In: Gevins AS, Remond A, editors. Methods of analysis of brain electrical magnetic signals, Principles of spatial analysis. Vol. 1. Amsterdam: Elsevier. p 309–354.
Lehmann D, Skrandies W. 1980. Reference-free identification of com-ponents of checkerboard-evoked multichannel potential fields. Electroencephalogr Clin Neurophysiol. 48:609–621.
Luck SJ, Woodman GF, Vogel EK. 2000. Event-related potential studies of attention. Trends Cogn Sci. 4:432–440.
Michel CM, Koenig T, Brandeis D, Gianotti RRL, Wackermann. 2009. Electrical Neuroimaging. Cambridge: Cambridge University Press. Michel CM, Murray MM, Lantz G, Gonzalez S, Spinelli L, Grave de PR.
2004. EEG source imaging. Clin Neurophysiol. 115:2195–2222. Millan MJ. 2006. Multi-target strategies for the improved treatment of
depressive states: Conceptual foundations and neuronal substrates, drug discovery and therapeutic application. Pharmacol Ther. 110:135–370.
Murphy SE, Norbury R, O’Sullivan U, Cowen PJ, Harmer CJ. 2009. Effect of a single dose of citalopram on amygdala response to emotional faces. Br J Psychiatry. 194:535–540.
Murray MM, Brunet D, Michel CM. 2008. Topographic ERP analyses: a step-by-step tutorial review. Brain Topogr. 20:249–264.
Nichols DE. 2004. Hallucinogens. Pharmacol Ther. 101:131–181. Norbury R, Mackay CE, Cowen PJ, Goodwin GM, Harmer CJ. 2007.
Short-term antidepressant treatment and facial processing. Func-tional magnetic resonance imaging study. Br J Psychiatry. 190:531–532.
Nutt DJ, Forshall S, Bell C, Rich A, Sandford J, Nash J, Argyropoulos S. 1999. Mechanisms of action of selective serotonin reuptake inhibi-tors in the treatment of psychiatric disorders. Eur Neuropsycho-pharmacol. 9(Suppl 3):S81–S86.
Paulus MP, Feinstein JS, Castillo G, Simmons AN, Stein MB. 2005. Dose-dependent decrease of activation in bilateral amygdala and insula by lorazepam during emotion processing. Arch Gen Psychia-try. 62:282–288.
Pegna AJ, Landis T, Khateb A. 2008. Electrophysiological evidence for early non-conscious processing of fearful facial expressions. Int J Psychophysiol. 70:127–136.
Perrin F, Pernier J, Bertrand O, Giard MH, Echallier JF. 1987. Mapping of scalp potentials by surface spline interpolation. Electroencepha-logr Clin Neurophysiol. 66:75–81.
Pessoa L, Adolphs R. 2010. Emotion processing and the amygdala: from a‘low road’ to ‘many roads’ of evaluating biological signifi-cance. Nat Rev Neurosci. 11(11):773–783.
Pessoa L, McKenna M, Gutierrez E, Ungerleider LG. 2002. Neural pro-cessing of emotional faces requires attention. Proc Natl Acad Sci USA. 99:11458–11463.
Quednow BB, Kometer M, Geyer MA, Vollenweider FX. 2012. Psilocybin-induced deficits in automatic and controlled inhibition are attenuated by ketanserin in healthy human volunteers. Neurop-sychopharmacology. 37:630–640.
Savitz J, Lucki I, Drevets WC. 2009. 5-HT(1A) receptor function in major depressive disorder. Prog Neurobiol. 88:17–31.
Schmidt A, Kometer M, Bachmann R, Seifritz E, Vollenweider F. 2013. The NMDA antagonist ketamine and the 5-HT agonist psilocybin produce dissociable effects on structural encoding of emotional face expressions. Psychopharmacology (Berl). 225(1):227–239. Sharp T, Cowen PJ. 2011. 5-HT and depression: is the glass half-full?
Curr Opin Pharmacol. 11:45–51.
Sheehan DV, Lecrubier Y, Sheehan KH, Amorim P, Janavs J, Weiller E, Hergueta T, Baker R, Dunbar GC. 1998. The Mini-International Neuropsychiatric Interview (M.I.N.I.): the development and vali-dation of a structured diagnostic psychiatric interview for DSM-IV and ICD-10. J Clin Psychiatry. 59(Suppl 20):22–33.
Smith ML. 2012. Rapid processing of emotional expressions without conscious awareness. Cereb Cortex. 22:1748–1760.
Spinelli L, Andino SG, Lantz G, Seeck M, Michel CM. 2000. Electromag-netic inverse solutions in anatomically constrained spherical head models. Brain Topogr. 13:115–125.
Studerus E, Gamma A, Vollenweider FX. 2010. Psychometric evalu-ation of the altered states of consciousness rating scale (OAV). PLoS One. 5:e12412.
Stuhrmann A, Suslow T, Dannlowski U. 2011. Facial emotion proces-sing in major depression: a systematic review of neuroimaging find-ings. Biol Mood Anxiety Disord. 1:10.
Sugase Y, Yamane S, Ueno S, Kawano K. 1999. Global andfine infor-mation coded by single neurons in the temporal visual cortex. Nature. 400:869–873.
Talairach J, Tournoux P. 1988. Co-planar stereotaxic atlas of the human brain. New York: Georg Thieme Verlag, Stuttgart.
Tzovara A, Murray MM, Michel CM, De LM. 2012. A tutorial review of electrical neuroimaging from group-average to single-trial event-related potentials. Dev Neuropsychol. 37:518–544.
Vollenweider FX, Csomor PA, Knappe B, Geyer MA, Quednow BB. 2007. The effects of the preferential 5-HT2A agonist psilocybin on prepulse inhibition of startle in healthy human volunteers depend on interstimulus interval. Neuropsychopharmacology. 32:1876–1887.
Vollenweider FX, Kometer M. 2010. The neurobiology of psychedelic drugs: implications for the treatment of mood disorders. Nat Rev Neurosci. 11:642–651.
Vollenweider FX, Leenders KL, Scharfetter C, Maguire P, Stadelmann O, Angst J. 1997. Positron emission tomography and fluorodeoxy-glucose studies of metabolic hyperfrontality and psychopathology in the psilocybin model of psychosis. Neuropsychopharmacology. 16:357–372.
Williams LM, Liddell BJ, Rathjen J, Brown KJ, Gray J, Phillips M, Young A, Gordon E. 2004. Mapping the time course of nonconscious and conscious perception of fear: an integration of central and periph-eral measures. Hum Brain Mapp. 21:64–74.
Williams LM, Palmer D, Liddell BJ, Song L, Gordon E. 2006. The‘when’ and‘where’ of perceiving signals of threat versus non-threat. Neu-roimage. 31:458–467.
Wing LL, Tapson GS, Geyer MA. 1990. 5HT-2 mediation of acute behav-ioral effects of hallucinogens in rats. Psychopharmacology (Berl). 100:417–425.
Wingen M, Kuypers KP, van dV V, Formisano E, Ramaekers JG. 2008. Sustained attention and serotonin: a pharmaco-fMRI study. Hum Psychopharmacol. 23:221–230.
Wittchen HU, Pfister H. 1997. DIA-X-Interviews: Manual für Screening-Verfahren und Interview. Frankfurt: Swets & Zeitlinger.
Wronka E, Walentowska W. 2011. Attention modulates emotional expression processing. Psychophysiology. 48:1047–1056.
Zhen Z, Fang H, Liu J. 2013. The hierarchical brain network for face recognition. PloS one 8:e59886.