Cardiol Young 1999; 9: 556-561
© Greenwich Medical Media Ltd. ISSN 1047-9511
Original Article
Normal values of signal-averaged electrocardiographic
parameters and QT dispersion in infants and children
Emmanuelle Vialle, Rim Albalkhi, Marc Zimmerman, Beat Friedli*Hopital cantonal universitaire, Unit ofPediatric Cardiology and ^Cardiology Division, Geneve , Switzerland
Abstract Ventricular late potentials, and dispersion of the QT interval, are markers for risk of ventricular
arrhythmias. Normal values for these parameters are well established in adults, but may not apply for children. This study has investigated the age dependency of signal averaged electrocardiographic parameters and Q T dispersion in 111 normal children aged from 5 days to 16 years. The results indicate that parameters change with age: duration of filtered QRS and low amplitude ( < 40 /zV) terminal signal increase with age, especially in the younger patients. Filtered QRS is 88.9 ± 7.87 ms in infants, and increases to 108.7 ± 8.51 in teenagers (/><0.001). Low amplitude terminal signals are 17.0 ± 3.44 ms in infants, and 24.5 ± 5.64 ms in teenagers (p< 0.001). Root mean square of the last 40 ms decreases with age, but remains stable after the age of 10 years (122.4 ± 33-30 jiiV in infants, 60.9 ± 31.27 in teenagers,p<0.001). QT dispersion, on the other hand, does not change significantly with age. The mean value for the whole group is 36 ± 13.7 ms. A weak but significant correlation exists between QT dispersion and filtered QRS. Thus, age must be taken into consideration when interpreting signal-averaged electrocardiograms, but not when measuring QT dispersion.
Keywords: QT dispersion; signal-averaged electrocardiogram; arrhythmias in the young
V
ENTRICULAR LATE POTENTIALS, AS DETECTED by the high gain signal-averaged electrocar-diogram, and dispersion of the Q-T interval, are both considered markers for risk of ventricular arrhythmias and sudden death, especially in adults with coronary arterial disease.15 This has prompted similar investigations in children at risk for ventricular arrhythmias and sudden death, mostly patients who have undergone open heart surgery. Ventricular late potentials have, indeed, been observed in a certain percentage of such patients.6'8 Standards for analysis of the signal-averaged electrocardiogram and normal values in adults have been issued by an international task force.9 These criterions, however, may not apply to children. To the best of our knowledge, only 3 reports exist relating to signal-averaged electrocardiographicCorrespondence to: Beat Friedli, M.D., Hopital cantonal universitaire, Unite de Cardiologie Pediatrique, 1211 GENEVE 14, Switzerland. Tel: 41 22 382 45 80; Fax: 41 22 382 46 24 ; E-mail: [email protected]
Accepted for publication 30 June 1999
parameters in normal children and infants.10"12 Furthermore, again to our knowledge, no data have been published regarding QT dispersion as seen in the electrocardiograms of normal infants and children. The aim of the present study, therefore, was to evaluate age dependency of signal-averaged electrocardiographic parameters and QT dispersion in infants and children from birth to the age of 16 years.
Materials and methods
A total of 111 children were studied (51 girls and 60 boys). Their ages ranged from 5 days to 16 years, with a mean of 6.5 years. All were seen by a pediatric cardiologist who ruled out any significant heart defect. In 79 cases, the diagnosis was func-tional murmur. In 9 cases, a small ventricular septal defect was found which closed spontaneously in all. In the remaining children, the reason for cardiac consultation was minimal patency of the arterial duct in 13 small infants, and chest pain in 10. No child was on any medication.
Signal-averaged electrocardiograms were recorded after informed consent was obtained from the children and/or their parents.
Signal-averaged electrocardiograms were recorded on a Marquette Mac 15 intrument. Silver chloride electrodes were placed to obtain the 3 Frank orthogonal leads, after careful preparation of the skin with a mixture of ether and alcohol. The input amplifier has a frequency response of O.O5-3OO Hz. Data are acquired at 1,000 samples per second and 1.2 /zV/bit, and transmitted to the cart. The "HI-RES" software delineates QRS complexes and correlates them with a template in frequency domain to compute an average complex (40 Hz FFT filter with a 6 dB/octave roll-off). 150 to 300 beats were averaged with the aim to reduce baseline noise to less than 0.5 jJN. In this study, the high-pass filter was set at 40 Hz and the low-pass filter at 250 Hz. A vector magnitude is calculated as v = v x2 + y2 + z2 . The noise level is measured as an average in a 30-ms window in the ST segment. The end of the QRS complex is automat-ically determined at twice the baseline noise. The following parameters were measured: the filtered QRS duration , in milliseconds, the duration of low amplitude terminal signals, again in milliseconds, defined as the interval between the end of total QRS and the point determined retrogradely where the QRS voltage exceeds 40 /xV; and the root mean square voltage of the terminal 40 milliseconds of the filtered QRS complex, in / A Y1 3 H
The QT interval was measured by hand on standard 12 lead electrocardiograms at a paper spead of 25 mm/s. The measurement was from the beginning of the QRS complex until the T wave returned to the isoelectric line. U waves were rarely observed. If present, the nadir of the T wave was identified as the termination of the QT interval. The rate corrected QT interval was calculated according to BAZETT's formula :
QTc = QT
VRR
using for the correction the RR interval preceding the measured complex.
Table 1
Although this formula has its limitations, espe-cially when the heart rate is fast,15 it is still the most commonly used means of correcting the QT interval for heart rate.
QT dispersion was calculated as the longest minus the shortest QT interval, the intervals being measured in all leads on the 12 lead electrocar-diogram, except those with an isoelectric QT interval.
All measurements were made by two inde-pendant observers and the average of both meas-urements was taken. Mean interobserver difference was 5.7 ms.
Age groups
The 111 patients were divided into 4 age groups: 25 newborns and infants aged from 0 to 12 months; 36 preschool children from 1 to 5 years; 27 school children from 6 to 10 years; and 23 teenagers aged from 11 to 16 years.
Statistics
Mean and standard deviation where calculated for all parameters for each age group. The mean values of each parameter were then compared by a one way analysis of variance. If a significant difference between groups was present, multiple comparison tests were performed using the Student-Newmann-Keuls test.
Correlation between QT dispersion and the 3 signal-averaged electrocardiographic parameters were sought by linear regression analysis.
Results
Table 1 shows the results of all parameters for the different age groups. Correlation between QT dispersion and signal-averaged electro-cardiographic parameters: There was a weak but significant correlation (r = 0.26, p < 0.01) between QT dispersion and filtered QRS. Correlation coefficients with low amplitude terminal signals (r = 0.03) and root mean square of last 40 ms (r = -0.14) were very weak and insignificant.
Age group N QRSf (ms) LAS 40 (mcV) RMS 40 (mcV) dQT (ms) dQTc(ms)
0-12 mo 1-5 yrs 6-10 yrs 11-16 yrs 25 36 27 23 88.9±7.87 97.8±8.11 105.1±5.84 108.7+8.51 17.0±3.44 20.6±7.36 24.2±5.97 24.5±5.64 122.4±33.30 89.0±40.76 6l.3±28.78 60.9±31.27 31±12.7 37±11.1 39±15.4 39±15.2 48±15.1 53±15.6 46±15.2 52±14.O Table 1. Mean and standard deviation for SAECG parameters and QT dispersion (dQT) in the different age groups. dQTc refers to dispersion of rate corrected QT intervals (see text).
558 Cardiology in the Young November 1999
Signal-averaged electrocardiogram
Baseline noise for these recordings was 0.47 ± 0.17 /U-V. Filtered QRS was age related, the value progressing with age (Fig.l). Differences between age groups were highly significant between the first 3 groups (p<0.01). Progression continued in the teenagers but did not reach statistical significance compared to the other groups.
Low amplitude terminal signal duration was very low for infants, and progressed significantly up to the age of 10 years (/><0.05). After this age, no significant differences in low amplitude signals was observed compared with the younger patients (Fig.2).
Root mean square of last 40 ms decreased with age, the changes being highly significant for the groups younger than teenage {p<0.0\). This parameter did not exhibit a significant difference between the older age groups (Fig. 3).
Correlation coefficients between signal-averaged electrocardiographic parameters and respectively age, body height and body surface area are shown in Table 2.
Although height showed a marginally better correlation, we have chosen for practical reasons to make age rather than height the criterion for groups. This is because, in current practice, all documents routinely mention the age of a patient, but not necessarily their height.
QT dispersion showed a tendency to increase between infants and preschool children, but this did not reach statistical significance. No change was noted in the older patients (Fig.4).
Corrected QT dispersion was found to have surprisingly high values, compared to the uncor-rected values, and showed no changes with age. The reason for the high value was found to be sinus arrhythmia, which is common in children. Indeed, whereas changes in RR intervals are sizable in sinus
ms 130 120 110 100 90 80
QRSf
70 * p < 0.01< 1 yr 1-5 yrs 6-10 yrs 11-16 yrs
Figure 1.
Progression of the filtered QRS (QRSf) duration with age. Asterisks indicate significant differences compared to previous age group. Bars are one standard deviation.
160 140 120 100 80 60 40 20 0
I
< 1 yrRMS
i 1-5 yrs40
T TT
I
* p«0.01 6-10 yrs 11-16 yrs Figure 3.Changes with age of the root mean square of the last 40 ms (RMS 40). Asterisks indicate significant change compared to previous age group. ms 3 5 30 25 20 15 10
LAS 40
* p<0.05< 1 yr 1-5 yrs 6-10 yrs 11-16 yrs
Figure 2.
Progression of duration of low amplitude signals (< 40 \W) in the terminal QRS (LAS 40), with age. Asterisks indicate significant differences compared to previous age group.
us 301 20 10 00 90 80 70
QRSf
* p < 0.01< 1 yr 1-5 yrs 6-10 yrs 11-16 yrs
Figure 4.
Mean and standard deviation of QT dispersion (dQT) in the 4 age groups. There are no significant differences, although there is a trend towards lower QT dispersion in the infant group.
Table 2. Correlation between SAECG parameters and age, body height, body surface area (BSA)
QRSf LAS 40 RMS 40 Age r = 0.64 r = 0.32 r = 0.50 BSA r = 0.62 r = 0.31 r = 0.48 Body height r = 0.67 r = 0.36 r = 0.55 r " ' i ! ! ! ' i • i • • \ ;
arrhythmia, absolute QT intervals showed no changes. Correcting the QT intervals with the BAZETT's formula using the preceding RR interval thus leads to spurious variations in corrected QT and an overestimation of dispersion (Fig. 5, see Discussion).
Discussion
Ventricular late potentials, and abnormal QT dispersion, are well established markers indicating a risk of ventricular arrhythmias and sudden death in adults with coronary arterial disease and cardiomyopathy.15 This has prompted similar investigations in children at risk for ventricular arrhythmias, particularly those who have undergone open heart surgery,6'8 with the emphasis on the significance of ventricular late potentials. More recently, QT dispersion has also been studied in children after repair of tetralogy of Fallot.16-17
Normal values for all these parameters in adults have been compiled by an international task force,9 but they may not apply to children. There are now a few reports on normal values for the signal-averaged electrocardiogram in children,101112'1819 only 3 including infants. To our knowledge, the potential age dependency of QT dispersion has not been studied.
It is important, therefore, that our study has shown clear changes in the 3 most often used time domain criterions for the signal averaged electro-cardiogram. Thus, filtered QRS increases with age, as has been previously demonstrated, and low amplitude terminal signals also increase with age. In our study, these changes were significant for the 3 youngest age groups. In teenagers, filtered QRS showed further prolongation, but this did not reach statistical significance. Low amplitude terminal signals, in contrast, do not change between the "school-age" and the "teenage" group.
The root mean square of last 40 ms has high values in infants which decrease progressively in the later age groups. As with low amplitude terminal signals, no further changes occured between those immediately above and below the age of 10. In infants with a short QRS complex, the last 40 ms
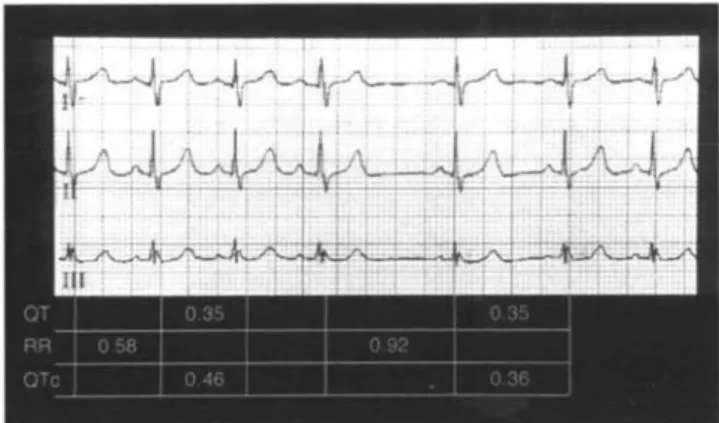
Figure 5.
Electrocardiogram of a child with sinus arrhythmia. QT interval has been measured for a short and for a long cycle. QT does not change after the long cycle. Therefore the calculation of corrected QT introduces a spurious "dispersion" (see text).
may reach into the high amplitude area of the main body of the QRS.11 Because of this, it has been advocated to use only the last 30 ms of the determi-nation of root mean square of last 40 ms. For the purpose of comparison with older children and with adults, we have chosen to keep the generally used last 40 ms of the complex
Previous studies regarding normative data in children have shown age dependent changes, similar to our population.11-12'18'19 Minor differences in absolute values may be due either to a different averaging system used or to racial differences.
QT dispersion looks at repolarization abnormal-ities, and is used increasingly to predict risk of ventricular arrhythmias. This parameter has been used in combination with abnormalities of depolar-ization (late potentials) to detect patients at risk.4 It is not known whether QT dispersion is age dependent in children. Our data indicate that there is no significant change from birth to the age of 16, although there is a tendency for the QT dispersion to increase with age, especially between infants and preschool children.
The mean and standard deviations of QT dispersion for all the ages we studied are similar to those published for adults20 and children,21 with a mean value between 30 and 40 ms. The upper 95th percentile is 0.63. Values above this, therefore can be considered abnormal.
QT dispersion or corrected Q T dispersion? It is obvious from our Table that the corrected value for QT dispersion has surprisingly high values, values which are higher than QT dispersion in all age groups. The reason for this is seen in Fig. 5. Children often have marked sinus arrhythmias. The RR interval, which enters the Bazett
560
Cardiology in the YoungNovember 1999
formula, can therefore vary widely from beat to
beat. The QT interval, in contrast, hardly
changes during sinus arrhythmia. In
conse-quence, correction for the preceding RR interval
introduces a spurious dispersion of the QT
interval. Some years ago, Garson et al.
22'
23studied
the QT interval and its variations during sinus
arrhythmia, comparing a group of patients
suffering from long QT syndrome with a control
group of normals. They observed a significant
variation of QT duration during sinus arrhythmia
in long QT patients, but not in normal controls.
It has also been shown in a recent pacing study
24that sudden change of heart rate does not change
the QT interval immediately, but only after a
delay. Because of this, we believe that corrected
QT should not be used to calculate dispersion,
especially in children in whom sinus arrhythmia
is common. Even in adults, the need for rate
correction when calculating QT dispersion has
been questioned.
25We wondered whether there would be a
corre-lation between one of the parameters looking at
depolarization, namely the signal-averaged
electro-cardiogram, and QT dispersion, which is a variable
of repolarization. In our normal population, a weak
correlation was found only between QT dispersion
and filtered QRS, with no correlation observed with
the other parameters of the signal-averaged
electro-cardiogram.
Limitations of the study
Normal values for the signal-averaged
electrocar-diogram in infants and children defined in the
present study may not be applicable to different
signal-averaging systems because they may vary
with the type of band-pass filters used, the type of
lead system, the number of averaged beats or the
definition of baseline noise.
913Also, other filter
settings may give somewhat different results. We
purposely have chosen the high pass filter at 40
Hz, this being the most commonly recommended
setting.
Despite the limitations, we conclude that
signal-averaged electrocardiographic parameters are age
dependent in infants and children. Filtered QRS
increases with age, low amplitude terminal signals
increase, and root mean square of last 40 ms
decreases. These changes are most marked in the
very young, and become minimal after age 10
years. QT dispersion on the other hand, although
somewhat lower in the infants, does not show
statistically significant changes with age. The mean
and upper limits of this parameter is similar to the
values found in the adults.
Acknowledgements
We would like to thank Dr. Rimensberger for his
help with the statistical analysis, and Mrs Dufaud
for preparing the manuscript. This study was
supported by the Swiss Cardiac Foundation and the
"Fonds Gerbex-Bourget".
References
1 Breithardt G, Borggrefe M. Pathophysiological mechanisms and clinical significance of ventricular late potentials. Eur Heart J 1986;7:364-385.
2 Simpson MB. Use of signals in the terminal QRS complex to identify patients with ventricular tachycardia after myocardial infarction. Circulation 1981;64:235-242.
3 Yunus A, Gillis AM, Duff HJ, Wyse DG, Mitchell LB. Increased precordial QTc dispersion predicts ventricular fibril-lation during acute myocardial infarction. Am J Cardiol 1996;78:7O6.
4 Goldner B, Brandspiegel HZ, Horwitz L, Jadonath R, Cohen TJ. Utility of QT dispersion combined with the signal-averaged elec-trocardiogram in detecting patients susceptible to ventricular tachyarrhythmia. Am J Cardiol 1995;76:1192-1193.
5 DJ Pinsky, RR Sciacca, JS Steinberg. QT dispersion as a marker of risk in patients awaiting heart transplantation. J Am Coll Cardiol 1997;29:1976-1584.
6 Zimmermann M, Friedli B, Adamec R, Oberhansli I. Frequency of ventricular late potentials and fractionated right ventricular electrograms after operative repair of tetralogy of Fallot. Am J Cardiol 1987;59:448-453.
7 Zimmermann M, Friedli B, Adamec R, Oberhansli I. Ventricular late potentials and induced ventricular arrhythmias after surgical repair of tetralogy of Fallot. Am J Cardiol
1991:67:873-878.
8 Janousek J, Paul T, Bartakova H. Role of late potentials in iden-tifying patients at risk for ventricular tachycardia after surgical correction of congenital heart disease. Am J Cardiol 1995;75:l46-15O.
9 Breithardt G, Cain ME, El-Sherif N, Flowers N, Hombach Y Janse W, Simson MB, Steinbeck G. Standards for analysis of ventricular late potentials using high resolution or signal-averaged electrocardiography. Eur Heart J 1991;12:473-48O. 10 Hayabuchi Y, Matsuoka S, Kubo M, Akita H, Kuroda Y
Age-related criteria for signal-averaged electrocardiographic late potentials in children. Ped Cardiol 1994;15:107-111. 11 Fallah-Najmabadi H, Dahdah NS, Palcko M, Mehta SK.
Normal values and methodologic recommendations for signal-averaged electrocardiography in children and adolescents. Am J Cardiol 1996;77:408-4l2.
12 Jimbo O, Zhang J, Seki T, Ogawa S. Criteria for evaluating abnormal signal-averaged electrocardiogram in children clas-sified by age, body surface area and height. Jpn Circ J 1996;60:228-238
13 Zimmermann M, Adamec R, Simonin P, Fromer M, Richez J. Noninvasive detection of ventricular late potentials: direct comparison of 7 different high-gain recording systems. Am J Noninvas Cardiol 1992;6:154-167.
14 Shankara Reddy BR, Christenson DW^ Rowlandson GI. High-resolution ECG on a standard ECG cart. J Electrocardiol 1988;21(supp):S74-S79.
15 Sagie A, Larson MG, Goldberg RJ Bengtson JR, Levy D. An improved method for adjusting the QT interval for heart rate (the Framingham heart study). Am J Cardiol 1992;70:797-801. 16 Daliento L, Caneve F, Turrini P, Buja G, Nava A, Milanesi O,
low-amplitude electrocardiographic signals and QT dispersion in patients operated on for tetralogy of Fallot. J Am Coll Cardiol 1995;76:408-4ll.
17 Gatzoulis MA, Till JA, Redington AN. Depolarization-repolar-ization inhomogenecity after repair of tetralogy of Fallot. Circulation 1997; 95, 401-404.
18 Vaksmann G, Elkonen M, Duhamel A, Godart F. Signal-averaged electrocardiography in healthy children : influence of age, body size and gender. PACE 1996; 19:1629-1634. 19 Davis AM, McCrindle BVC^ Hamilton RM, Moore-Coleman P,
Gow RM. Normal values for the childhood signal-averaged ECG. PACE 1996;19:793-801.
20 Hill JA, Friedman PL. Measurement of QT interval and QT dispersion. Lancet 1997;349:894-895.
21 Shah MJ, Wiesand TS, Rhodes LA, Berul CI, Vetter VL. QT and JT dispersion in children with long QT syndrome. J Cardiovasc Electroph 1997;8:642-648.
22 Garson A. How to measure the QT interval - what is normal ? AmJ Cardiol 1993;72:14B-16B.
23 Martin AB, Perry JC, Robinson JL, Zareba W, Moss AJ, Garson A Jr. Calculation of QTc duration and variability in the presence of sinus arrhythmia. AmJ Cardiol 1995;75:950-952.
24 TS. Faber, A. Jeron, A. Wurth, Just H , Zehender M. Do we need correction for heart rate when assessing QT dispersion for risk stratification? Eur Heart J 1997; 18, Abstract Supplement:
199-25 Malik M, Camm AJ. Mystery of QTc interval dispersion. A m J Cardiol 1997;79:785-78