Zeitschriftfür
Physikalische
Chemie NeueFolge,
Bd. 103, S. 165—180 (1976) ©by
Akademische Verlagsgesellschaft,Wiesbaden 1976Ozone
Induced
Chemiluminescence:
Kinetics of
Chemiluminescent Reaction between
Ozone
and Acridone in
Acetic
Acid*
By
F.Celardin
Department
of Inorganic and AnalyticalChemistry,
University of Geneva,Geneva (Switzerland) (ReceivedMarch 5, 1976)
Ozone induced chemiluminescence (CL) of acridone in acetic acid is
in-vestigated.
From preliminary spectral observations the CL emission is deter-mined to be due to energy transfer from an excitedspecies
to acridone whichemits atits fluorescence wavelength. UV-vis. spectra of the excited species as
well as some of the products are obtained. From kinetic observations of the system, a reaction sequence accordingto which CL is producedupon reaction
of an intermediary with ozone, is
proposed.
This intermediary is produceduponreaction ofaninitial oxidationproduct of acridone with anotheracridone
unit and it is thought tobe 10,10'biacridonyl. The rate constant of the first
reactionstepis determined tobe rí 30 M-1·sec-1.
Die durch Ozon induzierte Chemilumineszenz von Akridon in Essigsäure
wurde untersucht. Nach vorläufigen
Spektraluntersuchungen
ist die Emissiondie
Folge
einerEnergieübertragung
von einer angeregten Molekelart auf Akridon, das dann bei seiner Fluoreszenz-Wellenlänge emittiert. UV- und sichtbare SpektrenderangeregtenMolekelarten sowieeiniger
Produkte wurden aufgenommen. Auf Grund kinetischer Beobachtung wird eineReaktionsfolge
vorgeschlagen,
in der Chemilumineszenz durch Reaktion eines Zwischenstoffes mit Ozon eintritt. Dieser Zwischenstoff entsteht durch Reaktioneines anfäng-lichen Oxydationsprodukts des Akridons mit einer weiteren Akridon-Molekel. Er wird als, '-Biacridonyl
vermutet. DieGeschwindigkeitskonstante
derPrimärreaktion wird zu f« 30Mol-1·
s^1 bestimmt.
Acridine derivatives constitute convenient model
compounds
for theinvestigation
of bioluminescent reactions of some luciferins. As a result oftheir extensive studies on CLoxydation
ofacridan esters* Second
part of a series of
study
on ozone induced chemiluminescence.166 F.Cblabdin
and acridinium
salts,
McCapra et al. identifiedN-methylacridone
asthe
emitting species,
andpostulated
a dioxetane intermediate whosedecomposition yields
therequired
excitation energy[1].
On the other
hand,
it isinteresting
to find acridone(I)
among thelong
list ofcompounds
whichgive
rise to luminescence upon reaction with ozone[2].
Even
though
ozone is not a natural constituent ofbioorganisms,
its
strongly
CL reaction withacridone,
which is theparent
compound
ofN-methylacridone
seemed suitable for thestudy
undertakenhere,
as a contribution towards the
understanding
of the reactionleading
to bioluminescence.
From its
stoichiometry
and apreliminary analysis
of theend-products,
the reaction appears to be verycomplex.
From its kineticstudy,
it waspossible
toarrive to a reaction schemeincorporating
themain
steps
leading
toCL andto propose astructurefor onekey
inter-mediary.
Experimental
Reagent
solutionswereprepared
from Acridone(Fluka)
[recrystal-lised from ethanol-water
(m.p. 354°)]
and acetic100% (Merck
G.R.).
All other solvents were Merck G.R. and were used without furtherpurification.
Ozonegeneration
andpreparation
of its solutions in acetic acid as well as the CLrecording
set up were the same asde-scribed in a
previous
work[3],
theonly
differencesconsisting
in the use ofa 1 cmquartz
fluorescence cell for the reaction and the use ofoxygen alone for ozone
production. Phosphorescence
spectra
wererecorded on a Hitachi Perkin Elmer MPF-2A
spectrofluorimeter
withits
phosphoroscope
attachment. Mercksilicagel precoated plates
wereused for
preparative
TLC.During
all CLexperiments
as wellas all the reactions in continous ozone flow the rate ofgas flow was 30ml · min-1corresponding
to aninflow of ozone of 2.5 X IO-8 mole·
sec-1,
determined as describedpreviously
[3].
Results and discussion
Preliminary
observationsWhen a stream of ozone
containing
oxygen ispassed through
a solution of acridone(I)
in aceticacid,
there is emission ofstrong
Ozone Induced Chemiluminescence 167
a
typical
reaction where it can be noticed that the maximum shiftsfrom 430 to 425 nm as the reaction draws to its end.
As seen in
Fig.
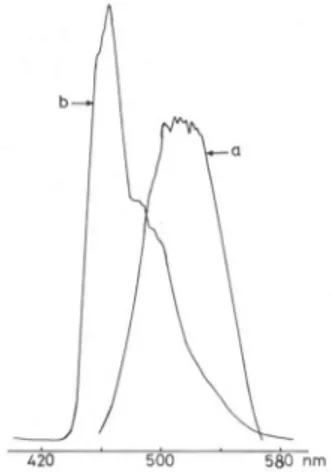
1b the CL maximumat 423—425nmoverlaps
withthe fluorescence of acridone even
though
lacking
the more structuredaspect
of the latter. It seemsthen,
that the recorded CL is due toproduction
of excitedsingulet
of acridone. Theslight
blue shift(za
5nm)
of the CL emissionduring
reaction can thus be attributedto the
disappearance
of the inner filter effect of acridonealong
itsconsumption by
ozone. From ourdeterminations,
the inner filtereffect of acridone in acetic acid at 425nm, is noticeable for concentra-tions above 4.1 10^5M and a
path length
of 1 cm.During
therecording
of CL emission the effective thickness is reduced due toozone
bubbling
and the critical concentration is at ahigher
value as seen later in therelationship
between maximum CLintensity
andinitial acridone.
Unfortunately,
for concentrations of acridone where there is no inner filtereffect,
the CLsignal
was too weak to recordsufficiently
well definedspectra,
in order to see if the blue shift stillpersists.
In the presence of
acrylonitrile,
the CL reaction isquenched
sinceozone
preferentially
reacts with this substance. As the amount ofacrylonitrile
in solution decreases the reaction with acridone becomessufficiently
competitive
as evidencedby
the appearance and increaseofa CL
signal.
Ifacrylonitrile
isaddedatthestp.ge
when the CL168 F. Celardin
0 1 2 3 4 t(min)
Fig.
2.Influenceofacrylonitrile onCLemissionat425nm v.s. time: a) normalCL decay upon ozone cut-off, without acrylonitrile addition; b) ozone ON;
c)
ozone OFF;d)
shutter closed,acrylonitrile
added; e) shutter opened; j) ozone ON240
"
320 400 nm
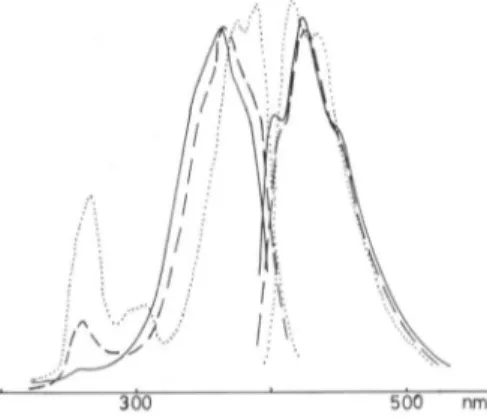
Fig.
3. Absorbance spectra of the reaction mixture at initial (-),inter-mediary
(-—)and final (-) stagesof CL emissionquenching
due to the reaction withremaining
ozone in solution canbe noticedwhen
compared
toCLdecay
withoutthequencher (Fig.
2).
OzonoInducedChemiluminescence 169 flash which can be
interpreted
asbeing
due to reaction ofaninter-mediary product
and ozone at ahigher
ratethan thequenching
reac-tion
(Fig.
2).
The CLspecies
ismostlikely
not initstriplet
statesince,
if it were so, no CL would be observed in the presence of atriplet
quencher
such asacrylonitrile assuming
thatquenching by
oxygenis not
sufficiently
efficient.Absorbance
spectra
of the reaction mixture at variousstages
(Fig.
3)
shows the appearance ofapeak
withtwo maxima at 320 and 330 nm at the expense of the two mainpeaks
of acridone at 382 and 398nm, while the band at 260 nm is shifted to 250 nm. If ozonationis continued
past
the end of CLemission,
the absorbance at 320— 330 nm decreases as a consequence of thebreakdownof the"primary"
end
product.
Thisspecies absorbing
at 320nm has a fluorescence at 374nm(excitation
320nm).
Since there is agood overlap
betweenthisfluorescence and the
absorption
spectrum
of acridone(Fig.
4),
it ispossible
that the excitedspecies
formedby
the CLstep
is thiscom-pound
in itsSi
state and that it transfers its energy toacridone which emits the observed CL. The fluorscence at 374nm is timedependent,
indicating
that the CLspecies
is of limitedstability
atroomtempera-tureinthepresenceofoxygenand
light.
Phosphorescence
spectra
of the reaction mixture show apeak
at470nm which increases as the reaction
proceeds
while thepeak
ofacridone at 520nm decreases
steadily (Fig.
5).
Phosphorescence
life-times are
approximately
the same for acridone and the emission at470nm: Tm« 1 s at 77K.
The CL
intensity
in acetic acid is several orders ofmagnitude
larger
than in any other solvent tested(methanol,
acetone,
DMSO,
DMF).
With theapparatus
athand,
only
inDMF,
a very weak CLcould be detected.
According
to Kokubun'sstudy
on the electronicspectra
of acridone[4]
itcanbe inferred that in acetic acid the neutralform of the molecule is
predominant
so that the initial ozone attackleading
to CL must occur on this form. The same observationapplies
to solvent acetone and since acridone fluorescence is the same bothin acetic and
acetone,
lowefficiency
of energy transfer from excited CLspecies
to acridone cannot account alone for thelarge
difference in CLintensity.
Acetone may bethought
of asinterfering
in akey
step
ofozonolysis
according
to Ceiegeemechanism,
whereby
it combines with the zwitterionresulting
from the dissociation of the molozonide[5]
thusimplying
thistype
ofan intermediate on the CL170 F.Cblardin
3*0 440 nm
Fig.
4. Fluorescence emission of thepresumed CLspecies
(-)superimposed
to acridone absorbance (.) spectrum420 500 580nm
Fig.
5.Phosphorescence
spectraat 77 in acetic acid, a)Acridone;b)
reaction mixtureatthe end of CL emissionWhen the ozone-acridone reaction was carried in
preparative
amounts,
five blue-fluorescentcompounds
could be isolatedby
TLC(First,
remaining
acridone was removedby
elution withchloroform-methanol 10:1
v/v.
The bluespot
corresponding
toproducts
wasthenseparated
with thesame solventsin 1:1v/v
ratio.).
Given theexcessiveozonation
required
for thissynthesis,
some of theseproducts
mustOzoneInduced Chemiluminescence 171
300 500 nm
Fig.
6. Fluorescence excitation and emission spectra ofthreemajor
compoundsisolated at the end ofextensive ozonation. (Solvent: acetic acid)
ratio of ozone to acridone
(7
moles of ozone per mole ofacridone,
determinedasdescribed inour
previous
work[3])
canthus beattribut-ed to the
multiplicity
of reactionsteps
leading
to severalproducts.
As showninFig.
6,
thefluorescencespectra
of theseproducts
are verysimilar to acridone's. A tentative
spectral
differentiationby changing
toa
non-polar
solvent(CCI4)
didn'tgive
asignificant
variation.With acridine
(II)
in acetic acid no CL could be detected and thereaction is much slower than with acridone. The same observation
applies
to xanthone(III)
aswell,
showing
theimportance
of thenitrogen
in thering
for CLproduction.
KineticsThe ozone—acridone reaction was studied
kinetically
with variousrelative amounts of the reactants. The
experimental
results could bespecifically
correlated with those calculated fromapostulated
reactionsequence.
Kinetics with continuous ozone flow
Acridone
(4.1
-5M)
decrease was monitoredby
fluorescence(exc.
396 nm, em. 425nm)
under a continousbubbling
of ozone(30
ml · min-1 2.5X IO-8mole ·
sec-1).
The interference of the CL emission on the fluorescence wasentirely negligible
at thesensitivity
of measurement. In Table
1,
thepseudo-first
order rate constants calculated fromexperimental
curves fortworuns,show thatfor about172 V. ( ·: ,ardin
,j£l
0 6I-
/
y
0 30 ' 9Ï) t(sec) *
Fig.
7.Semi-logarithmic plot
ofproduct
concentration(absorbance
at 330 ran)v.s. time
ofthe reaction
corresponds
to the initial increase and the maximumplateau
ofCL. The finalstages
nolonger satisfy
the first orderpattern
most
likely
due tocompetitive
reactionpaths
of acridonewithprod-ucts of the initial reaction
gaining
importance.
In the same
experimental
conditions asabove,
the formation ofthe
product absorbing
at 330nmproceeds
also as apseudo-first
orderreaction
(Fig.
7).
CL curves at 425 nm with various initial acridone concentrations
show that the
height
of the CLplateau
isdirectly proportional
toTable 1. Pseudo-first order rate constants calculated from acridone fluorescence decaycurvesundercontinuousozoneflow
[Acridone]o = 4.1 -5M, ozone: 30 ml ·
min-1, 2.5 X IO-8 mole·sec-1
Time Pseudo-firstorder Time Pseudo-first order
(s) rate constant (s) rate constant
Expt. 1
Expt.
2 Expt. 1Expt.
210 1.23 10~2 1.21 IO-2 60 1.24 X IO-2 1.24 IO-2
15 1.22 1.25 65 1.28 1.27 20 1.23 1.24 70 1.27 1.24 25 1.25 1.24 75 1.32 1.25 30 1.23 1.17 80 1.33 1.27 35 1.21 1.20 85 1.34 1.29 40 1.21 1.24 90 1.41 1.32 45 1.22 1.24 95 1.43 1.34 50 1.24 1.22 100 1.47 1.36 55 1.26 1.24 110 1.50 1.38
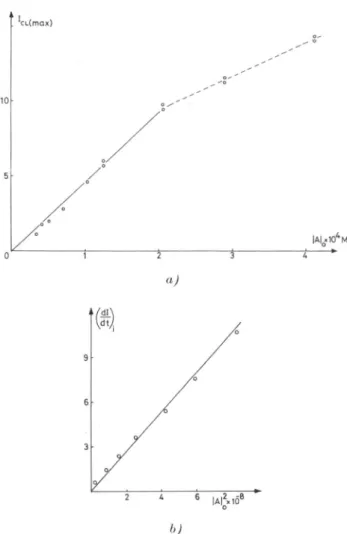
Ozone Induced Chemiluminescence 173 CL(max)
|aio«io'm
0 1 2 3 4a)
9 6 3 b)Fig.8. a) Maximum CL intensity (arbitrary units) v.s. inital acridone
con-centration, b) Initial slope of CL intensity v.s. the square ofinitial acridone
concentration
initial acridone within the limits where there is no inner filter effects
(Fig.
8a).
Note that the upper concentration limit ishigher
than theonedetermined
by
fluorescencemeasurements because of thelowering
of the thickness
by
thegasbubbling
through
thesolution.Furthermore,
from the same CL curves it appears that the initialslope
of CL emission islinearly
relatedto thesquareofinitial acridone174 F. Celardin
Kinetics in excess acridone
When,
in agiven experiment,
ozone is cut-offat theheight
of theCL
plateau,
the decrease oflight
emission thatensues isexponentially
related to the time. The results of one such
experiment
aregiven
inTable 2.
Table 2. CLdecay inexcessacridone [Acridonejo = 4.1 X IO-5 M. (CLin arbitrary units)
Time(s) InCL — kch Time(s) InCL — kCL 0 4.91 5 4.78 2.6 10-2 10 4.62 2.9 15 4.50 2.7 20 4.33 2.9 25 4.17 2.9 30 4.01 3.0 35 3.89 2.9 40 3.74 2.9 45 3.58 2.9 X 10~2 50 3.47 2.9 55 3.33 2.9 60 3.22 2.8 65 3.04 2.9 70 2.94 2.8 80 2.64 2.8 90 2.20 3.0 100 2.08 2.8
Kinetics in near-stoichiometric conditions
In these
experiments,
solutions ofozone in acetic acidwere mixedwith solutions of acridone in the same
solvent,
and the reaction wasfollowed
by
acridone absorbance at 398 nm. At theexperimental
conditions ofthis
study
(near-stoichiometric
initial concentrations ofreactants,
=25°)
the rate ofreactionturns out to bedependent
onthe square of acridone concentration
(Table 3a,b).
The
preceding experimental
kinetic results can be summed upas:with constant ozone concentration
(continous flow)
:d[A]/dt
=ka[A]
(1)
-fcL(max)
=&Cl[A]o
(2)
(cZ7CL/^)initial
=¿[A]o2
(3)
d[P]/dt
=kF[F]
(4)
with excess acridone:
Icl
=(-Ícl)o
exp
(— kt)
(5)
atnear-stoichiometric ratios ofreactants:
d[A]/dt
=ks[Af.
(6)
In an
attempt
to arrive to anexperimentally
sound scheme as aprimary guideline
for futureproposals
of a reactionmechanism,
Ozone Induced Chemiluminescence 175
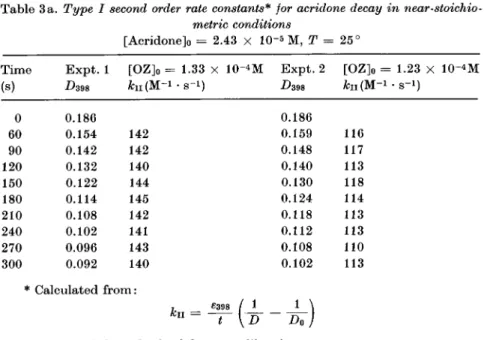
Table 3a. TypeI second orderrate constants* lor acridonedecay in
near-stoichio-metric conditions [Acridonejo = 2.43 -5 , = 25° Time (s) Expt. 1 d398 [OZ]o fcii(M-= 1.33 lO-oM ·s-i) Expt. 2 [OZ]o
kn(M-= 1.23 X 10" · s-i) (I 60 90 120 150 180 210 240 270 300 0.186 0.154 0.142 0.132 0.122 0.114 0.108 0.102 0.096 0.092 142 142 140 144 145 142 141 143 140 * Calculatedfrom: 0.186 0.159 0.148 0.140 0.130 0.124 0.118 0.112 0.108 0.102 11%
III) 117 113 118 114 113 113 110 113 , 6398 / 1 ku = —[d
where £398 = 7650asobtained froma calibrationcurve.
Table 3b. Experimental mean values of second order rate constants with respect
to acridone, forvarious initialozone concentrations
[Ozone]o (M) *n(M-1.85 1.38 1.33 1.28 1.23 X 10⁻⁴ 177 154 142 132 I 14
several reaction sequences
compatible
with thepreliminary
observa-tions were submitted to kineticanalysis.
Thefollowing
reaction sequence leads toanalytical
expressions
satisfying simultaneously
all theexperimental
kinetic results(1—6).
A
+
OZ + A -» LL
+
OZ ->+
X*X*
+
A ->A*+
X A* ->A+
hv.176 F.Celardin
Thus,
the reaction ofintermediary
with acridone(A) produces
species
Lwhich,
in thepreliminary experiments
described,
isrespon-sible ofthe CL flash uponozone reintroduction after
quenching
ofthefirst
step
by
acrylonitrile.
isthe"endproduct" absorbing
at 330nm, while X* is the excitedspecies
which transfers its energy to acridone.Experimentally,
theabsorption
at 320 nm with fluorescence at374nm, is attributed to X which reacts further and appears to be labile. The above reaction sequence is reduced to the main
steps
leading
toCL;
the various dark deactivationpaths
for X* as well asother
possible
darkreactionsinvolving
ozone are omitted.The
stoichiometry
of 7 moles of ozone per mole of acridone andthe
multiplicity
of "finalcompounds"
found on ozonationpast
theend of CL
emission,
indicates that the total reaction is morecomplex
than the
postulated
sequence.Nevertheless,
since our kineticexperi-ments were not continued
past
the end ofCLemission,
thefollowing
reaction sequences where the latter
stages
are considered to beneg-ligible,
constitute asatisfactory
basis for the mathematicalanalysis
in ordertosee if the
experimental
kinetic behaviour is verified.With constant ozone and
considering
the rate of energy transferto be very fast
relatively
to the othersteps,
the reaction scheme takes thesimplified
form:A -ii- d
[A]/dt
= —h
[A]
-k2
[A] [B]
(
7)
+
A—^Ld[B]/dt
=jfci[A]
—ife2[A][B]
(8)
L + + hvd[L]/dt
=fc2[A][B]
—fc3[L]
(9)
/cl
=**[L].
(10)
Assuming
asteady
state concentration forB,
(8)
yields:
[B]
=*i/*2.
(11)
Substituting
(11)
into(7):
d[A]/dt
= -2h
[A]
and
[A]
=[A]o
exp(—
2ki
t)
(12)
as observed
experimentally
(1).
At the maximum
intensity
of CL(/cL(max)) (10)
becomes:Ozone Induced Chemiluminescence 177 Since at this
stage
dlch/dt
=0,
itresults thatd[~L]/dt
= 0so that(9)
gives [L]max
=(&2/&3)[A][B]
which is substituted in(13):
ÍCL(max) =
fa[A][B].
(14)
Assuming
asteady
state concentration forB,
(8)
yields: [B]
=fa/fa
and we arriveto:
icL(max)
=h
[A]
=fa
[A]0
exp
(—2 kit).
(15)
Since,
as observedexperimentally,
the time to reach the maximumCL is the same for a
given
ozoneinflow,
theexponential
term in(15)
is constant and in accord with
experimental
results we find thaticL(max)
islinearly
dependent
on[A]0
(2).
Differentiating
(10)
andsubstituting
(9):
dlcildt
=fa fa
[A] [ ]
—fa2
[L].
(16)
Furthermore:[A]
=[A]„
-([B]
+
[L]
+
+
ifÎ)
which atthe very initial
stages
of the reactionapproximates
to:[ ],
=] -[ ]|
(17)
(17)
in(16)
gives:
(d/cL/<ft)<
=fa k3
([A]o
-
[B],)
[B]t.
Since
[ ],
is verysmall weneglect
the squareterm in[B]¿:
(dIcL/dt)i
=k2h[A]o[B]l.
(18)
Integration
of(8)
where[A]
is substitutedby
(17)
and the square term in[ ],·
isneglected, yields
:™
=rak
1
-exp(-kl
1-hiA]o
t)}-For t
sufficiently
close to zero, weapproximate
theexponential
tothefirst two terms of its series
expansion
:exp
{-
(fa
+
A2[A]o)
t}^l-(fa
+
fa[A]o
t)
and arriveto:[B],
=*i[A]0f
which upon substitution in
(18)
gives:
(dlci/dt)i
=fa fa
k3
[A]021
which is consistent with the
experimental
result(3).
178 F. Celakdin
In excessacridone the
proposed
reaction sequence reducesto:OZ
d[OZ]/dt
=-
h'[OZ]
-k3'[L] [OZ]
-feU
Ld[B]/eft
=Jfei'fOZ]
-k2'[B]
L+
OZ + X+
d[L]/dí
=k2'[B]
-fc3'[L] [OZ]
/ =¿s'[L][OZ]
Since
[B]
and[L]
areverysmallatall timeswe can assume astationary
concentration state and obtain:
[B]
=(h'/k2')[OZ]
[L]
=h'/fa'
and
/cl
=h'IOZ]
=
Ai'[OZ]o
exp(—2¿i'í)
=
(/cL)oexp
(-2h't)
in accord with the
experimental
relation(5).
Finally,
the fact thatexperimentally
the reaction rate is first order for acridone in excess ozone and second order innear-stoichio-metric
conditions,
is in accord with the mathematical treatment oftype
IIsecond order reactions{—
(d[C]/dt)
—
&[C][D]}
where thetwo reactants are in stoichiometric or near-stoichiometricconcentrations,
since it is shown that in such cases the
integration
of the rateexpres-sion leadsto aresult
resembling
that for atype
I{—
(d[C]/dt
=k[G]2}
second order reaction
[6].
In the
present
case, where the stoichiometric ratio was found tobe 7 moles ofozone per mole of
acridone,
if:A <
[A]o/4
whereA =
([OZ]o/7)
-[A]0
the
analytical
result would be:where
[A]'oJ=[A)oJ
+
(A/2)
o: initialOzoneInduced Chemiluminescence 179
Fig.
9.120 240 t(sec)
v.s. time for two
experiments.
[A]o = 2.43 -5 M[A]+ [A/2]
(·): [OZ]o= 1.33 X 10-"M; (Q): [OZ]0 1.23 -4 M
(II) Acridine
(III) Xanthone
(IV) 10,10'Biacridonyl From the
experimental
conditions(Table
3a,b)
it can be verifiedthat falls within the limit for the above result to be
applicable
sothat therate appears to be second order in acridone.
With the
experimental
data of Table 3a theslopes
of(1/[ ]'
v. s.timefortwoexperiments (Fig.
9)
dividedby
7 1- 4 |2[A].' [A],
r)
gives
32 and 28 M-1 · s~xrespectively
for the actual second order rateconstant.
From these results it is
possible
topostulate,
as astarting point
for further
investigations,
that the main CL reaction occurs via an180 F. Celabdin
intermediary
such as 10—10'biacridonyl
(IV),
whichaccording
toour kinetic
scheme,
would be formed upon reaction of an initialoxidation
product
of acridone(B
inthereactionscheme)
withanother acridone unit. 10—10'biacridonyl
(L
in the reactionscheme)
wassynthesized
originally by
oxidation of acridone with chromic acid[7]
and it isquite
plausible
that it is also formedby
ozonation. Further-more, thiscompound
is known to be non-fluorescent and this is in accord with our own observationswhereby
the decrease of acridone is notaccompanied by
an immediate appearance of a noticeablefluorescence
showing
an evolutionexpected
for areacting
inter-mediary.
References
1. F.McCapra, Pure
appi.
Chem. 24 (1970) 611.2. R. L. Bowman and N.Alexander, Science 154 (1966) 1454.
3. F.Celardin and M.Marcantonatos, Z.
physik.
Chem. NeueFolge
96(1975) 109.
4. H.KoKUBUN, .Elektrochem.,Ber.Bunsenges.
physik.
Chem. 62(1958)599. 5. J. D. Robebts and M.Casebio, BasicPrinciples
of OrganicChemistry,
p. 192. Benjamin,New York 1964.
6. S.W.Benson, The Foundations of Chemical Kinetics, p. 20. McGraw-Hill, New York 1960.
7. R.M.Acheson, Acridines, in: The Chemistry of Heterocyclic
Compounds,
a series of monographs. A.Weissbebgee, editor. Interscience, New York