doi:10.1351/pac200880091893 © 2008 IUPAC
Macroscopic control of plasma polymerization
processes*
Dirk Hegemann
Empa, Materials Science and Technology, Advanced Fibers, Lerchenfeldstrasse 5, 9014 St. Gallen, Switzerland
Abstract: Plasma polymerization covers a broad range of plasma deposits from soft to hard
coatings. Nanoscale coatings are formed within a dry and eco-friendly process on different substrate materials and structures. To gain a deeper insight into plasma polymerization, a macroscopic approach using the concept of chemical quasi-equilibria might be useful. Following this macroscopic approach, the reaction parameter power input per gas flow W/F, which represents the specific energy invested per particle within the active plasma zone, solely determines the mass deposition rate. Hence, plasma polymerization can be described by measuring the deposited mass and examining the power input and gas flow which con-tributes to it. Thus, the control, investigation, and up-scaling of plasma polymerization processes are enabled. Different examples are given to make use of the macroscopic ap-proach.
Keywords: plasma deposition; monomer; reaction parameter; deposition rate; process
engi-neering.
PLASMA POLYMERIZATION
When adverting to plasma polymerization, a radical-dominated plasma chemical vapor deposition process (PCVD) is thought of, resulting in macromolecule formation, i.e., mainly amorphous, more or less cross-linked structures. The underlying growth mechanism is known as rapid step-growth poly-merization (RSGP) [1]. Gaseous monomers are fed into the active plasma zone, where activation and dissociation processes take place. The recombination of these reactive species, which are mainly radi-cals, and the reactivation of reaction products determine the plasma polymerization. The main reaction cycles consist either of reactions of reactive species with a single reactive site, or are based on divalent reactive species. Cross-cycle reactions might occur. Furthermore, the surface takes part in plasma poly-merization by recombination, yielding deposition and etching processes leading to ablation and re-dep-osition, considered as a passive zone [2].
This concept of chemical quasi-equilibria (i.e., the separation into an active and a passive zone) enables a macroscopic approach to plasma polymerization [3]. Following this macroscopic approach, the reaction parameter power input per gas flow (W/F), which represents the energy invested per parti-cle within the active plasma zone, determines the mass deposition rate (Rm) using the following rela-tionship:
(1)
*Paper based on a presentation at the 18thInternational Symposium on Plasma Chemistry (ISPC-18), 26–31 August 2007, Kyoto,
Japan. Other presentations are published in this issue, pp. 1883–2023. R F G E W F m = − a exp
where G is the reactor depending geometrical factor; W, the power input; F, the gas flow; and Ea, an (apparent) activation energy corresponding to the used monomer [4,5].
If eq. 1 holds, a linear fit is obtained using an Arrhenius-type plot for the mass deposition rate per gas flow depending on the (inverse) energy input as shown by the straight line in Fig. 1 around the ac-tivation energy [6,7]. The negative slope of the linear fit represents the acac-tivation energy, which can be considered to be the dissociation energy to obtain the radicals that predominantly lead to plasma poly-mer growth [8]. Deviations from this straight line might be found at low specific energies due to oligomerization and at high energies due to ion-induced effects such as enhanced nucleation sites, etch-ing, sputteretch-ing, or temperature effects [9]. At rather energetic plasma conditions or long durations, an increasing temperature during plasma polymerization has to be taken into account that might strongly influence the deposition rate depending on the type of monomer used.
While the actual interaction of plasma particles and plasma-induced radiation influence the ab-solute deposition rates depending on the reactor geometry described by the geometrical factor in eq. 1, the activation energy merely depends on the plasma chemistry of the considered monomer and is thus independent of the reactor design. To demonstrate the general meaning of the activation (dissociation) energy, the true energy consumed within the active plasma zone yielding the measured deposition rate (concept of chemical quasi-equilibria) has to be known [9]. Besides the knowledge of the absorbed power and the gas flow, a geometrical consideration enables the finding of the general activation energy corresponding to the used monomer through the similarity parameter (S), as shown below:
(2)
where dactis the length of the active plasma zone; dgas, the (mean) distance between gas inlet and dep-osition area; Vgas, the volume occupied by the gas; and Vdis, the volume occupied by the gas discharge [6,10]. Equation 2 helps to find out the specific energy consumed within the active plasma zone which determines the measured deposited mass. Replacing W/F by S within eq. 1, the general activation en-ergy of a certain monomer gas can be derived.
At an energy input below the activation energy, oligomers can take part in the film growth lead-ing to an increased deposition rate compared to eq. 1. High energy inputs, on the other hand, might also yield a deviation from the straight line (Fig. 1). However, the macroscopic approach helps to identify the range of (basic) plasma polymerization, in which distinct plasma species (film-forming radicals)
de-Fig. 1 Arrhenius-type plot of deposited mass vs. (inverse) energy input yielding the (apparent) activation energy
derived from the straight line.
S W F d V d V = act gas gas dis
termine the plasma chemistry yielding deposition, and gives hints to optimize the film properties. In a low-pressure plasma, these conditions are given for different monomers and gas mixtures within a broad parameter range, even when additional gases are added to obtain plasma copolymerization [9]. In the latter situation, the total gas flow is given by adding the different gases, considering a flow factor that weights its contribution to the plasma polymerization process using the following relationship:
F = Fm+ a Fc (3)
where Fmis the monomer gas; Fc, the nonpolymerizable or carrier gas; and a, the reaction cross-sec-tion (flow factor) which is smaller than 1. Equacross-sec-tions 1–3 enable control, investigacross-sec-tion, and up-scaling of plasma polymerization processes.
The concept using W/FM (energy per mass of monomer; M: molecular mass of monomer) as a reaction parameter, the so-called Yasuda factor, is well described and used within the literature [4,11–14]. This approach is valuable in particular when comparing homologous series of monomers. However, the plasma geometry is not considered, whereas the reaction parameter W/F (energy per plasma volume) gives the energy input into the active plasma zone. Moreover, we introduced the use of an Arrhenius-type plot (with W/F instead of temperature) to evaluate the deposited mass per area out of the active plasma zone. Hence, the regime of plasma polymerization (radical-dominated, etching, in-fluence of oligomers or ions) can easily be identified. Recently, more and more groups adapt this ap-proach [15] and start to make use of the Arrhenius-type plot to optimize their plasma polymerization processes [16].
RESULTS AND DISCUSSION
Equation 1 can be used to analyze each data set of plasma polymerization in order to identify the re-gion of the linear fit (validity of eq. 1 around the activation energy) and deviations from it (see Fig. 1). However, the real energy invested per particle within the active plasma zone might not be known, yield-ing a process and reactor-related activation energy. Nevertheless, this approach can already be used for process optimization and up-scaling.
Symmetric reactors
To gain deeper insights into plasma polymerization, a well-defined reactor geometry is helpful, such as a symmetric, plane parallel electrode set-up (Fig. 2). The power absorption W can easily be measured using a V/I probe, since the electrodes constitute the reactor vessel. Using a gas shower covering the electrode area, the gas flow F through the active plasma zone is also well defined and the volume of gas discharge equals the volume where the gas is spread, i.e., Vdis= Vgas. For deposition rates measured at the bottom electrode, the gas particles travel on average a distance related to the electrode distance del. Thus, eq. 2 is simplified, giving
(4)
The active plasma zone is defined as the bulk plasma between the two plasma/sheath boundaries, where excitation and dissociation processes are taking place. As long as the process conditions do not vary too much or the distance of the electrodes is too big (the plasma builds up a gap in the center of the reactor) dactcan be considered a constant (i.e., also independent on pressure) and eq. 4 gives the ac-tual specific energy dissipated in the active plasma zone to generate film-forming radicals. Note that a zoo of plasma species is generated; by measuring the deposited mass, however, merely the film-form-ing species are covered, yieldfilm-form-ing plasma polymerization.
S W F d d = act el
Now, this set-up can be used to investigate different monomers and mixtures to determine the monomer-related activation energy, which gives the dissociation energy to obtain the radicals that pre-dominantly lead to plasma polymer growth [17]. Moreover, the influence of nonpolymerizable gases can be examined to obtain the amount of energy consumed by the additional gases, again with respect to their contribution to film formation [9].
Asymmetric reactors
Many plasma reactors, however, are more or less asymmetric, since the electrode is mounted inside a reaction vessel. The degree of asymmetry depends on the areas (the capacities) of driven electrode to counter electrode (e.g., the total recipient). Due to the concentration of the electric fields in front of the driven (smaller) electrode and the development of a self-bias, large potential drops can be obtained across the plasma sheath, yielding a strong interaction with energetic particles during film growth. Moreover, the expansion of the active plasma zone now directly depends on the external plasma parameters such as power input W, pressure p, and gas composition. For volume-dominated discharges (e.g., hydrocarbons or mixtures of monomers with carrier gases at sufficiently low pressure) Vdis≈Vgas
might still be assumed, thus, the variation of dactwith W and p can be examined [18]. The expansion of the active plasma zone can be obtained from the luminosity distribution assuming that radiation scales with excitation processes.
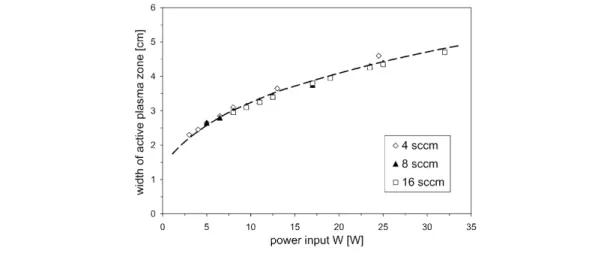
The enhancement of deposition rates and the scale-up of plasma polymerization processes are of practical relevance, for example. Since the gas-phase processes of plasma polymerization (plasma chemistry) solely depend on the reaction parameter W/F, as can be seen from eq. 1, W/F might be kept constant while increasing the monomer flow (and thus the power input) to obtain higher deposition rates. However, this results in broadening of the active plasma zone [18]. A thorough examination of
dact(W, F) for methane discharges at constant pressure (7.5 Pa) reveals that the width of the active plasma zone reliably scales with power input (Fig. 3).
Thus, the similarity parameter of eq. 2 is given by
(5)
Equation 5 can now be used for scale-up and enhancement of deposition rates while maintaining the plasma chemistry, e.g., retention of functional groups. Nevertheless, the increasing interaction of en-ergetic particles during film growth has to be taken into account for increasing power input. The film
Fig. 2 Schematic drawing of a symmetric, plane parallel electrode set-up.
S W F d W d = act gas ( )
microstructure and morphology might thus be influenced [19]. In case the film properties are strongly affected, the increase in potential drop might be balanced by adjusting the degree of asymmetry of the plasma reactor or by an increase in pressure (and thus more particle collisions).
A change in pressure, however, also influences the plasma expansion by the varying plasma length dact, which increases with decreasing pressure. Moreover, the transition between volume-domi-nated, i.e., Vdis≈Vgas, and corner-dominated discharge with Vdis< Vgashas to be considered looking at pressure variations [20]. In all cases, the way of the incoming gas particles through the active plasma zone(s) (i.e., their residence time) determine their degree of activation and thus the formation of film-forming radicals. This is regarded in eq. 2 in order to compare different plasma conditions and reactors.
Addition of reactive gases
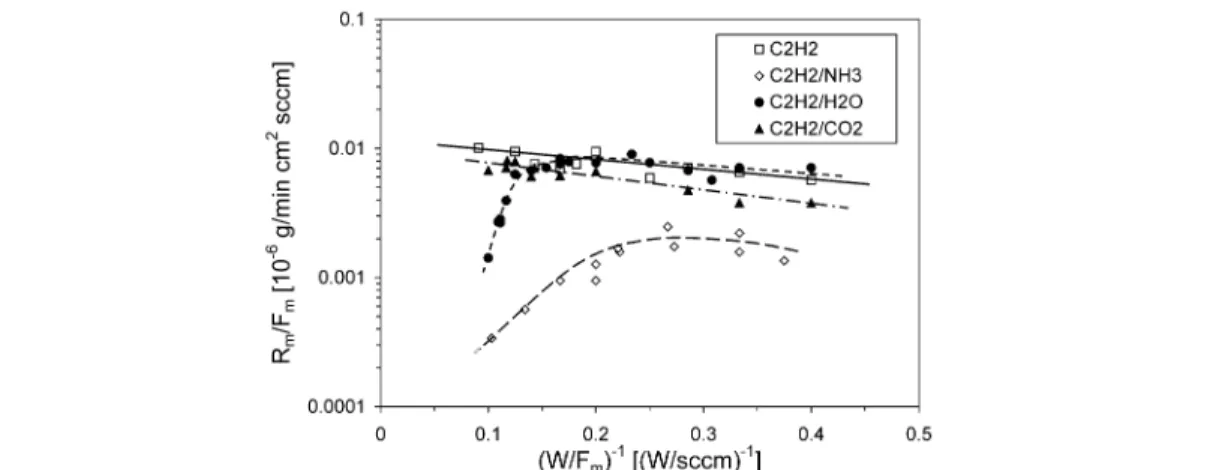
Equations 1–3 can also be used to control the influence of additional (carrier or reactive) gases on plasma polymerization. The presented concept was successfully used to identify different regimes in-dicating radical-dominated deposition (area of linear fit within the Arrhenius-type plot) or etching and sputtering effects as shown in Fig. 4 [2,9]. Chemical etching effects can be seen by a reduction in dep-osition rate (as for C2H2/CO2), while a drop in the deposition rate indicates sputtering (as for C2H2/NH3 at enhanced energy input) or a change in the deposition mechanism according to the RSGP model (as for C2H2/H2O) [1]. Rivaling deposition/etching effects can then be used to obtain nanostructured plasma coatings [21,22].
Most of all, the addition of nitrogen-containing gases to hydrocarbons is of high interest, since the flow factor a in eq. 3 was found to be high (0.35 for N2, 0.5 for NH3) [9,17]. This means that nitro-gen-containing radicals (mainly NH2and CN) participate in film formation [23]. Moreover, CN was also identified as an etching radical, while N2+ions yield sputtering effects [24]. Looking at the litera-ture dealing with a-C:N:H coatings, it remains often unclear whether etching or sputtering effects pre-vail. The conditions might also differ a lot, comparing the deposition at the cathode (i.e., the RF-driven electrode) and the anode (i.e., the counter electrode) within an asymmetric set-up. Zhang et al. ex-plained their finding of a strong reduction in deposition rate with increasing N2 partial pressure (N2/(N2+CH4) ratio) at the cathode (self-bias of –650 V, pressure of 40 Pa) mainly by ion bombardment (N2+), while the almost constant deposition rate obtained at the anode was not easy to explain [24]. However, using the macroscopic approach to describe plasma polymerization, the situation becomes much clearer as depicted in Fig. 5. Here, eqs. 1 and 3 with a = 0.35 were used.
The evaluation of the deposited mass reveals that the conditions at the anode mainly follow eq. 1, the regime of plasma polymerization. The increased deposition at higher energy input might be due to the onset of ion-induced effects. The reduced deposited mass for increasing energy input at the cathode, on the other hand, is clearly indicative of N2+ion bombardment and the formation of hard coatings due to the high bias voltage of –650 V, whereas the coatings deposited on the anode were found to be poly-mer-like due to low interaction of energetic particles [24]. Thus, the presented macroscopic approach can also be utilized to re-engineer plasma polymerization experiments.
Fluorocarbon discharges
Furthermore, the approach using macroscopic kinetics enables us to look at different monomers that are of interest (e.g., fluorocarbons). Depositions from fluorocarbon discharges undergo rivalling deposi-tion/etching effects, and it is controversially discussed whether they can be considered as radical-dom-inated plasma [2,13]. Silverstein et al. were using an asymmetric RF plasma with hexafluoropropylene (HFP) around 200 Pa and tried to plot the deposited mass of HFP vs. W/FM [12]. To fit their data, they proposed a reaction parameter W/F3(instead of W/F), which is proportional to Wτ2/FM with the
resi-Fig. 4 Deposited mass vs. energy input for different gas mixtures. Deviations from a straight line indicate etching
and sputtering effects.
dence time τof the reacting species in the reactor, in order to describe the reduction in deposition rate at enhanced energy inputs. However, using the Arrhenius-type plot with the specific energy W/F as re-action parameter, it can be seen that a linear fit is no longer appropriate for energies above the apparent activation energy (Fig. 6). It can be assumed that etching effects prevail, since the high pressure used does not favor sputter effects. It is known from spatially resolved laser-induced fluorescence (LIF) measurements on growing fluorocarbon films that CF2radicals are generated at the substrate surface through plasma interactions with the growing film [25]. Recently it was shown that the CF2surface pro-duction is linearly correlated to the mean ion energies within the fluorocarbon discharges [26]. Therefore, the concept of chemical quasi-equilibria might not be applicable, since the plasma polymer-ization might be strongly influenced by energetic particles (no radical-dominated process) and the sub-strate surface cannot be considered as passive zone. Hence, fluorocarbon discharges can be described by macroscopic kinetics merely at low energy inputs. Nevertheless, the described approach helps to identify the regime in which one is working.
CONCLUSIONS
The macroscopic approach to describe plasma polymerization can successfully be used to control plasma polymerization processes. By evaluation of the deposited mass (per area out of the active plasma zone) the regime of plasma polymerization (i.e., radical-dominated film growth) can be identified as well as etching or sputtering effects by using an Arrhenius-type plot. Hence, the plasma chemistry within the active plasma zone as well as the conditions at film growth can be controlled and influenced. (Re-) engineering and up-scaling of plasma polymerization is thus enabled.
It should be noted that by measuring the deposited mass, only processes yielding film formation are governed. Thus, it is a different approach compared to using plasma diagnostics, which gives in-formation about all plasma chemical processes in the gas phase. Both techniques should thus be com-bined to learn more about the film growth mechanisms.
Fig. 6 Deposited mass vs. energy input for HFP discharges. The reduced deposition rates at enhanced energies
REFERENCES
1. H. Yasuda. Luminous Chemical Vapor Deposition and Interface Engineering, Marcel Dekker, New York (2005).
2. D. Hegemann. Indian J. Fibre Text. Res. 31, 99 (2006).
3. A. Rutscher, H.-E. Wagner. Plasma Sources Sci. Technol. 2, 279 (1993). 4. S. Y. Park, N. Kim. J. Appl. Polym. Sci., Appl. Polym. Symp. 46, 91 (1990). 5. D. Hegemann, H. Brunner, C. Oehr. Plasmas Polym. 6, 221 (2001).
6. D. Hegemann, D. J. Balazs, M. Amberg, A. Fischer. Proc. 17thInt. Symp. Plasma Chem., Toronto,
Canada (2005).
7. D. Hegemann. Proc. 18thInt. Symp. Plasma Chem., Kyoto, Japan (2007).
8. D. Hegemann, U. Schütz, A. Fischer. Surf. Coat. Technol. 200, 458 (2005). 9. D. Hegemann, M. M. Hossain. Plasma Process. Polym. 2, 554 (2005).
10. D. Hegemann. In Plasma Polymers & Related Materials, M. Mutlu (Ed.), pp. 191–200, University Press, Ankara, Turkey (2005).
11. H. Yasuda. Plasma Polymerization, Academic Press, New York (1985). 12. M. S. Silverstein, R. Chen, O. Kesler. Polym. Eng. Sci. 36, 2542 (1996). 13. M. A. Gilliam, Q. Yu, H. Yasuda. Plasma Process. Polym. 4, 165 (2007).
14. L. Ledernez, H. Yasuda, F. Olcaytug, F. Gemetz, G. Urban. Plasma Process. Polym. 4, S794 (2007).
15. M. Bauer, T. Schwarz-Selinger, H. Kang, A. von Keudell. Plasma Sources Sci. Technol. 14, 543 (2005).
16. F. Truica-Marasescu, M. R. Wertheimer. Plasma Process. Polym. 5, 44 (2008).
17. D. Hegemann, M. M. Hossain, E. Körner, D. J. Balazs. Plasma Process. Polym. 4, 229 (2007). 18. D. Hegemann, U. Schütz. Thin Solid Films 491, 96 (2005).
19. G. Capote, R. Prioli, F. L. Freire Jr. J. Vac. Sci. Technol., A 24, 2212 (2006). 20. D. Hegemann. Thin Solid Films 515, 2173 (2006).
21. D. Hegemann, M. M. Hossain, D. J. Balazs. Prog. Organic Coat. 58, 237 (2007). 22. M. M. Hossain, A. S. Herrmann, D. Hegemann. Plasma Process. Polym. 4, 135 (2007). 23. D. Liu, E. R. Fisher. J. Vac. Sci. Technol., A 25, 368 (2007).
24. M. Zhang, Y. Nakayama, T. Miyazaki, M. Kume. J. Appl. Phys. 85, 2904 (1999). 25. N. E. Capps, N. M. Mackie, E. R. Fisher. J. Appl. Phys. 84, 4736 (1998). 26. I. T. Martin, J. Zhou, E. R. Fisher. J. Appl. Phys. 100, 013301 (2006).