H I V / A I D S
B R I E F R E P O R T
JC Virus Antibody and Viremia as
Predictors of Progressive Multifocal
Leukoencephalopathy in Human
Immunodeficiency Virus-1–Infected
Individuals
Raphael P. Viscidi,1,a Nina Khanna,2,3 Chen S. Tan,4,5 Xiuhung Li,6 Lisa Jacobson,6David B. Clifford,7Avindra Nath,8Joseph B. Margolick,9 Keerti V. Shah,9Hans H. Hirsch,2,3,aand Igor J. Koralnik4,5,a
1Department of Pediatrics, Johns Hopkins University School of Medicine, Baltimore, Maryland;2Division of Infectious Diseases and Hospital Epidemiology, and3Institute for Medical Microbiology, Department of Biomedicine, University of Basel, Basel, Switzerland;4Department of Medicine, and5Department of Neurology, Beth Israel Deaconess Medical Center, Boston, Massachusetts; 6Department of Epidemiology, Johns Hopkins Bloomberg School of Public Health, Baltimore, Maryland;7Department of Neurology, Washington University School of Medicine, Saint Louis, Missouri;8Department of Neurology, Johns Hopkins University School of Medicine, and9Department of Molecular Microbiology and Immunology, Johns Hopkins Bloomberg School of Public Health, Baltimore, Maryland
We examined whether prediagnostic JC virus (JCV) anti-bodies and viremia are predictors of progressive multifocal leukoencephalopathy (PML) in 83 PML cases and 240 human immunodeficiency virus (HIV) disease-matched controls. JCV viremia was not predictive of PML, but some patients showed higher anti-JCV immunoglobulin G (IgG) responses 6 months prior to diagnosis.
Progressive multifocal leukoencephalopathy (PML) is a de-myelinating disease of the central nervous system caused by lytic infection of oligodendrocytes with JC polyomavirus (JCV). PML occurs in immunosuppressed individuals with AIDS or hematological malignancies, transplant recipients, and patients treated with immunomodulatory medications for autoimmune diseases [1–3].
Clinically useful predictors for PML are lacking. We therefore performed nested case-control studies within the Multicenter-AIDS and the Swiss-HIV (human immunodeficiency virus) cohort studies (MACS and SHCS) to examine whether JCV-specific virological and serological markers are predictors of PML.
METHODS
The study was approved by the institutional review board (IRB) at each participating center and each MACS location.
Study Populations
Two nested case-control studies were performed using archived samples from the MACS, a prospective study of HIV/AIDS in homosexual men in the United States begun in 1984, and the SHCS, a prospective study of HIV-1 infected Swiss adults ini-tiated in 1988. Demographic and clinical data, plasma, serum, and peripheral blood mononuclear cells (PBMC) were col-lected every 6 months for 2.5 years prior to PML diagnosis, and additionally for 1 year after diagnosis in the SHCS. Thirty PML patients from MACS were diagnosed between 1985 and 1996 by brain histology in 16 (53%), radiographic and clinical signs in 9 (30%), and clinical diagnosis in 5 (17%) patients. Cases were matched with 81 HIV-seropositive participants, who did not develop PML. In the SHCS, 53 patients were diagnosed with PML between 1995 and 2006 by brain histology in 7 (13%), detection of JCV by polymerase chain reaction (PCR) in ce-rebral spinal fluid in 18 (34%) and radiographic and clinical signs in 28 (53%) patients. Cases were matched with 149 HIV-seropositive participants. Criteria for matching are described in
supplementary materials.
JCV PCR Assays
Plasma and PBMC samples were tested by quantitative PCR (QPCR) for JCV DNA (as described elsewhere [4] and
supplementary materials).
JCV Serology Assays
A virus-like particle-based enzyme-linked immunosorbent assay (ELISA) was used to detect antibody to JCV capsids (as de-scribed elsewhere [5] andsupplementary materials).
Statistical Analysis
Conditional logistic regression, with adjustment for age and CD41 T-cell counts at diagnosis, was used to investigate the
Received 8 March 2011; accepted 29 June 2011.
a
R. P. V., H. H. H., and I. J. K. contributed equally to the study.
Correspondence: Raphael P Viscidi, MD, Johns Hopkins Hospital, Blalock Bldg Rm 1105, 600 N Wolfe St, Baltimore MD 21287 ([email protected]).
Clinical Infectious Diseases 2011;53(7):711–715
Ó The Author 2011. Published by Oxford University Press on behalf of the Infectious Diseases
Society of America. All rights reserved. For Permissions, please e-mail: journals.permissions@ oup.com.
1058-4838/2011/537-0013$14.00 DOI: 10.1093/cid/cir507
temporal relationship between PML and levels of log-transformed immunoglobulin (Ig) G, IgA, and IgM optical density values, serostatus, and plasma JCV DNA copy number.
RESULTS
Study Population
Within each study, demographic characteristics of cases and controls were similar (Table 1). MACS participants were men, while one-fifth of SHCS patients were women. Intravenous drug use was more common in SHCS (39.6%) than in MACS (12.6%). One case in MACS received combined antiretroviral therapy (cART), but 30 (57%) cases in SHCS were treated with cART. Within SHCS, cases and controls were well matched at entry and at PML diagnosis, while median CD41 T-cell counts of MACS cases at the time of PML diagnosis were lower than that of controls (139 cells/uL vs 171 cells/uL, P 5 .01).
Serological Studies
Among the 83 PML cases and 230 controls, JCV IgG seropre-valence was 58% and 49%, respectively, 1–1.5 years before
diagnosis, and did not differ substantially during other 6-month intervals before PML diagnosis. IgA seroprevalence among cases and controls 1–1.5 years before diagnosis was 16% and 11%, while IgM seroprevalence was 2.2% and 3.4%, respectively. After PML diagnosis, IgG seroprevalence increased to 96% in the 6 months following diagnosis, while IgA and IgM seroprevalence increased to 50% and 12.5%, respectively (analysis restricted to SHCS). Among subjects with 2 or more IgG measurements, 8 cases (15.1%) and 15 controls (9.4%) seroconverted. Fluctu-ating serostatus was observed in 8.6% of controls and 11.3% of cases. Treatment with cART had no effect on JCV-specific capsid IgG and IgM levels, whereas a trend for IgA seropositivity was seen (adjusted odds ratio [OR], 3.1, 95% confidence interval [CI], .99–9.74, P 5 .052).
The distribution of IgG, IgA, and IgM seroreactivity to JCV capsids during 6-month time intervals prior to PML diagnosis is shown inFigure 1. Six months prior to diagnosis, median (in-terquartile range) IgG levels for cases and controls were 0.23 (0.13, 0.40) and 0.18 (0.08, 0.35), respectively, and the median difference between matched case-control sets was 0.06 (20.11, 0.23). Controlling for CD41 T-cell count and age, a 1 log10
Table 1. Characteristics of Study Populations
MACS SHCS
Variable Cases (n 5 30) Controls (n 5 81) Cases (n 5 53) Controls (n 5 149)
Gender, N (%)
Male 30 (100%) 81 (100%) 33 (77%) 118 (79%)
Female 0 (0%) 0 (0%) 10 (23%) 31 (21%)
Age, median (IQR) 39 (36, 44) 40 (36,51) 39 (34, 43) 38 (35, 43)
Race/ethnicity, N (%)
White 29 (97%) 79 (98%) 44 (83%) 129 (87%)
Black 0 (0%) 2 (2%) 1 (2%) 8 (5%)
Other/unknown 1 (3%) 0 (0%) 8 (15%) 12 (8%)
Ever IV drug use, N (%)
No 26 (87%) 71 (88%) 32 (60%) 70 (47%)
Yes 4 (13%) 10 (12%) 21 (40%) 79 (53%)
Ever smoking, N (%)
No 7 (23%) 31 (38%) NA NA
Yes 23 (77%) 50 (62%) NA NA
Years on study, median (IQR) 6.6 (4.0, 8.4) 7.1 (4.9, 9.3) 4.6 (0.25, 7.8) 6.4 (1.8, 9.7)
PML diagnostic criteria
Histological/virological 16 (53%) NA 25 (47%) NA
Clinical/radiographic 14 (47%) NA 28 (53%) NA
Calendar Yr Dx, median (IQR) 1991 (1989, 1994) NA 1999 (1997, 2002) NA
Entry CD4, median (IQR) 549 (363, 631) 483 (375, 636) 274 (90, 440) 216 (105, 430)
CD4 at Dx, median (IQR) 139 (87, 206) 171 (90, 280) 139 (44, 257) 120 (57, 218)
cART in 2 yrs before PML
No 29 (97%) 81 (100%) 23 (43%) NA
Yes 1 (3%) 0 (0%) 30 (57%) NA
Abbreviations: cART, combined antiretroviral therapy; IQR, interquartile range; MACS, Multicenter AIDS Cohort Study; NA, not available; SHCS, Swiss HIV Cohort Study.
increase in JCV capsid-specific IgG level in cases compared with controls was associated with a 75% increase in the odds of developing PML (hazard ratio [HR], 1.75, 95% CI, 1.19– 2.58, P 5 .0046). The association of IgG with risk of PML was observed in the combined analysis of 83 PML cases and in the 53 SHCS cases, but only a non-significant trend was seen in the 30 MACS cases. IgA and IgM levels were not associated with risk of PML. Comparable results were obtained when the
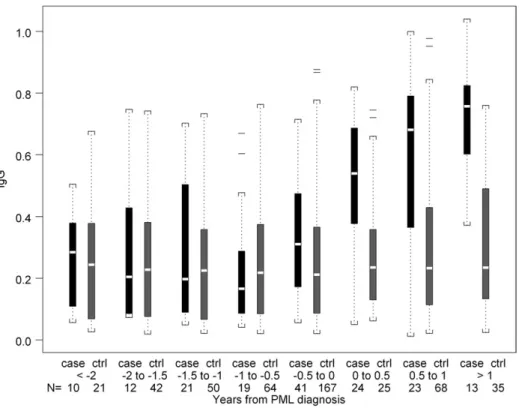
analysis was restricted to the 36 PML cases confirmed histo-logically and/or virohisto-logically and their 114 controls. Antibodies to JCV capsid increased post PML diagnosis. The median IgG level was higher in SHCS cases compared with controls during the first 6-month interval (0.54 vs 0.24, P , .0001) and the 6–12 month interval (0.68 vs 0.23, P ,.001) after diagnosis (Figure 2).
Virological Studies
JCV DNA was detected by QPCR in plasma from 14 (17%) of 83 cases and 28 (12%) of 230 controls. The median detectable level of JCV DNA was 168 copy numbers per mL of plasma (interquartile range, 108–364). Detecting JCV viremia prior to diagnosis was not associated with a risk of developing PML. Of 42 subjects with viremia at 1 or more visits, 12 (29%) were seronegative at all visits. Six (26%) of 23 PML cases had de-tectable JCV DNA in PBMC samples during the 2 years prior to the diagnosis of PML, and the corresponding number for controls was 15 (17%) of 90 patients (P 5 .36).
DISCUSSION
We combined data from 2 nested case-control analyses to examine risk factors for development of PML in HIV-infected patients. Our study population of 83 PML cases is large for this rare disease. A striking finding was that JCV viremia did not have any diagnostic use for the risk of developing PML in the 2 years before diagnosis. The frequency of JC viremia in our study (13.4%) was lower than that reported for HIV-positive patients in some studies, which ranged between 20% and 40% [6–8].
The prevalence of IgG to JCV capsids and the level of an-tibody did not differ between cases and controls during any 6-month time window between 2.5 and 0.5 years before PML diagnosis. However, in the 6 months immediately preceding diagnosis of PML, the level of JCV capsid antibody was ele-vated in cases compared with controls, as reported elsewhere [9]. The association was largely due to the contribution of 53 cases from the SHCS. We cannot rule out that undefined technical and clinical factors, such as sample size, storage conditions, or the use of cART, contribute to this difference. The temporal proximity to the diagnosis of PML suggests that this association may reflect underlying disease. In a previous study in MACS, higher titers of JCV IgG were associated with JCV viruria but not to a diagnosis of PML [10] In total, 25% of HIV-positive individuals who developed PML were sero-negative on 1 or more visits during the 2 years prior to di-agnosis. It is not clear if seronegative patients were truly negative or if they had levels of antibodies too low to be scored as positive by our assay. In total, 29% of patients with JCV viremia were seronegative, supporting the notion that the
Figure 1. Distribution of IgG, IgA, and IgM absorbance values of sera from PML cases and HIV disease matched controls in the MACS and SHCS at time intervals before the diagnosis of PML. The summary statistics of each distribution are displayed in a box plot. The length of the box corresponds to the interquartile range with the upper boundary of the box representing the 75th percentile and the lower boundary the 25th percentile. The horizontal clear line in the box represents the median value. The 10th and 90th percentiles are shown by the small bar at the end of the line extending downward or upward, respectively, from the box. Each outlier value is shown individually by a solid line. The number of outliers that are not displayed in the graph space is indicated at the top of each graph. The number of samples contributing to each distribution is indicated at the bottom of the figure.
assay was not very sensitive in the setting of advanced HIV infection. We speculate, therefore, that an increase in JCV IgG activity may reflect recent exposure to JCV antigen, which, in a severely immunosuppressed patient, might also indicate an increased risk of developing PML, while a stable IgG titer does not preclude subsequent development of PML.
One limitation of our study is the use of samples that had been kept frozen for long periods of time. It is possible that degradation of viral DNA precluded efficient amplification of JCV sequences. The JCV seroprevalence was lower in MACS (42%) than SHCS (67%) and lower than that reported in other populations [11,12]. Nevertheless, the absence of viremia before PML diagnosis is consistent with models of pathogenesis, which hypothesize that PML is caused by reactivation in the brain either from virus resident in the brain or from virus in cells that traffic to the brain.
Interest in prediagnostic markers of PML has been triggered by the recent development of PML in multiple sclerosis and Crohn’s disease patients treated with natalizumab, and psoriasis patients treated with efalizumab [3]. The selective impairment in T-cell activation and trafficking caused by these drugs differs from immunosuppression seen in AIDS. Therefore, while it is not clear if the findings of our study are readily applicable to patients treated with these drugs, the study does suggest that monitoring these patients for JCV viremia is unlikely to predict who will develop PML.
Supplementary Data
Supplementary materialsare available at Clinical Infectious Diseases on-line (http://www.oxfordjournals.org/our_journals/cid/). Supplementary materialsconsist of data provided by the author that are published to benefit the reader. The posted materials are not copyedited. The con-tents of allsupplementary dataare the sole responsibility of the authors. Questions or messages regarding errors should be addressed to the author. Notes
Acknowledgments. Data in this manuscript were collected by the Multicenter AIDS Cohort Study (MACS) with centers (Principal Inves-tigators) at the Johns Hopkins Bloomberg School of Public Health (Joseph B. Margolick, Lisa P. Jacobson), Howard Brown Health Center, Feinberg School of Medicine, Northwestern University, and Cook County Bureau of Health Services (John P. Phair, Steven M. Wolinsky), University of California, Los Angeles (Roger Detels), and University of Pittsburgh (Charles R. Rinaldo). Web site located athttp://www.statepi.jhsph.edu/macs/macs.html.
The members of the Swiss HIV Cohort Study are M. Battegay, E. Bernasconi, J. Bo¨ni, HC. Bucher, Ph. Bu¨rgisser, A. Calmy, S. Cattacin, M. Cavassini, R. Dubs, M. Egger, L. Elzi, M. Fischer, M. Flepp, A. Fontana, P. Francioli (President of the SHCS, Centre Hospitalier Universitaire Vaudois, CH-1011- Lausanne), H. Furrer (Chairman of the Clinical and Laboratory Committee), C. Fux, M. Gorgievski, H. Gu¨nthard (Chairman of the Scientific Board), H. H. Hirsch, B. Hirschel, I. Ho¨sli, Ch. Kahlert, L. Kaiser, U. Karrer, C. Kind, Th. Klimkait, B. Ledergerber, G. Martinetti, B. Martinez, N. Mu¨ller, D. Nadal, M. Opravil, F. Paccaud, G. Pantaleo, A. Rauch, S. Regenass, M. Rickenbach (Head of Data Center), C. Rudin (Chairman of the Mother & Child Substudy), P. Schmid, D. Schultze, J. Schu¨pbach, R. Speck, P. Taffe´, P. Tarr, A. Telenti, A. Trkola, P. Vernazza, R. Weber, S. Yerly.
We wish to thank Nadine Doppler from the institute for Medical Microbiology for technical assistance.
Figure 2. Distribution of absorbance values of IgG in sera from PML cases and HIV disease matched controls in the SHCS at time intervals before and after the diagnosis of PML. Data are represented in box plots as described in the legend to Figure 1.
Financial support. This work was sponsored in part by grants from the Neurologic AIDS Research Consortium (U01 NS322228 to D. C. and I. J. K., R01 NS 041198, NS 047029, and K24 NS 060950); Johns Hopkins NIMH Center (5P30MH075673 to A. N.); and a Biogen Idec research grant (to I. J. K.). The MACS is funded by the National Institute of Allergy and Infectious Diseases, with additional supplemental funding from the National Cancer Institute (UO1-AI-35042, 5-MO1-RR-00052 [GCRC], UO1-AI-35043, UO1-AI-35039, UO1-AI-35040, UO1-AI-35041). This study has been supported by the Swiss HIV Cohort Study and the Swiss National Science Foundation (SHCS project Nr. 512).
Potential conflict of interest. D. C. has received fees for the following: consultancy from Biogen Idec, Genentech, Millennium, Genzyme, BMS, and Pfizer; expert testimony from Biogen Idec; payment for lectures or speakers bureaus from GSK, Millennium, Biogen; development of edu-cational presentations from Millennium; travel/meeting expenses from Biogen Idec. A. N. has received fees for consultancy from Biogen and Diogenix. All other authors report no potential conflicts.
All authors have submitted the ICMJE Form for Disclosure of Potential Conflicts of Interest. Conflicts that the editors consider relevant to the content of the manuscript have been disclosed.
References
1. Berger JR. Progressive multifocal leukoencephalopathy in acquired immunodeficiency syndrome: explaining the high incidence and dis-proportionate frequency of the illness relative to other immunosup-pressive conditions. J Neurovirol 2003; 9(Suppl 1):38–41.
2. Khanna N, Elzi L, Mueller NJ, et al. Incidence and outcome of pro-gressive multifocal leukoencephalopathy over 20 years of the Swiss HIV Cohort Study. Clin Infect Dis 2009; 48:1459–66.
3. Carson KR, Focosi D, Major EO, et al. Monoclonal antibody-associated progressive multifocal leucoencephalopathy in patients treated with rituximab, natalizumab, and efalizumab: a Review from the Research
on Adverse Drug Events and Reports (RADAR) Project. Lancet Oncol 2009; 10:816–24.
4. Ryschkewitsch C, Jensen P, Hou J, Fahle G, Fischer S, Major EO. Comparison of PCR-southern hybridization and quantitative real-time PCR for the detection of JC and BK viral nucleotide sequences in urine and cerebrospinal fluid. J Virol Methods 2004; 121:217–21.
5. Rollison DE, Helzlsouer KJ, Lee JH, et al. Prospective study of JC virus seroreactivity and the development of colorectal cancers and adeno-mas. Cancer Epidemiol Biomarkers Prev 2009; 18:1515–23.
6. Koralnik IJ, Boden D, Mai VX, Lord CI, Letvin NL. JC virus DNA load in patients with and without progressive multifocal leukoencephalop-athy. Neurology 1999; 52:253–60.
7. Ferrante P, Caldarelli-Stefano R, Omodeo-Zorini E, et al. Compre-hensive investigation of the presence of JC virus in AIDS patients with and without progressive multifocal leukoencephalopathy. J Med Virol 1997; 52:235–42.
8. Hirsch HH, Meylan PR, Zimmerli W, Iten A, Battegay M, Erb P. HIV-1-infected patients with focal neurologic signs: diagnostic role of PCR for Toxoplasma gondii, Epstein-Barr virus, and JC virus. Clin Microbiol Infect 1998; 4:577–84.
9. Grabowski MK, Viscidi RP, Margolick JB, Jacobson LP, Shah KV. Investigation of pre-diagnostic virological markers for progressive multifocal leukoencephalopathy in human immunodeficiency virus-infected patients. J Med Virol 2009; 81:1140–50.
10. Khanna N, Wolbers M, Mueller NJ, et al. JC virus-specific immune responses in human immunodeficiency virus type 1 patients with progressive multifocal leukoencephalopathy. J Virol 2009; 83:4404–11. 11. Egli A, Infanti L, Dumoulin A, et al. Prevalence of polyomavirus BK and JC infection and replication in 400 healthy blood donors. J Infect Dis 2009; 199:837–46.
12. Knowles WA, Pipkin P, Andrews N, et al. Population-based study of antibody to the human polyomaviruses BKV and JCV and the simian polyomavirus SV40. J Med Virol 2003; 71:115–23.