HAL Id: hal-00298113
https://hal.archives-ouvertes.fr/hal-00298113
Submitted on 24 Aug 2005HAL is a multi-disciplinary open access
archive for the deposit and dissemination of sci-entific research documents, whether they are pub-lished or not. The documents may come from teaching and research institutions in France or abroad, or from public or private research centers.
L’archive ouverte pluridisciplinaire HAL, est destinée au dépôt et à la diffusion de documents scientifiques de niveau recherche, publiés ou non, émanant des établissements d’enseignement et de recherche français ou étrangers, des laboratoires publics ou privés.
Tree-ring width wavelet and spectral analysis of solar
variability and climatic effects on a Chilean cypress
during the last two and a half millennia
N. R. Rigozo, D. J. R. Nordeman, E. Echer, L. E. A. Vieira, M. P. S. Echer,
A. Prestes
To cite this version:
N. R. Rigozo, D. J. R. Nordeman, E. Echer, L. E. A. Vieira, M. P. S. Echer, et al.. Tree-ring width wavelet and spectral analysis of solar variability and climatic effects on a Chilean cypress during the last two and a half millennia. Climate of the Past Discussions, European Geosciences Union (EGU), 2005, 1 (1), pp.121-135. �hal-00298113�
CPD
1, 121–135, 2005
Solar variability and climatic effects from
tree rings width
N. R. Rigozo et al. Title Page Abstract Introduction Conclusions References Tables Figures J I J I Back Close
Full Screen / Esc
Print Version Interactive Discussion
EGU
Climate of the Past Discussions, 1, 121–135, 2005 www.climate-of-the-past.net/cpd/1/121/
SRef-ID: 1814-9359/cpd/2005-1-121 European Geosciences Union
Climate of the Past Discussions
Climate of the Past Discussions is the access reviewed discussion forum of Climate of the Past
Tree-ring width wavelet and spectral
analysis of solar variability and climatic
e
ffects on a Chilean cypress during the
last two and a half millennia
N. R. Rigozo1,2,3, D. J. R. Nordeman2, E. Echer2, L. E. A. Vieira2, M. P. S. Echer1,2, and A. Prestes2
1
Faculdade de Tecnologia Thereza Porto Marques – FAETEC, CEP 12308-320, Jacare´ı, Brazil
2
National Institute for Space Research – INPE, S.J. Campos, Brazil
3
LARAMG – Laborat ´orio de Radioecologia e Mudanc¸as Globais/Departamento de Biof´ısica e Biometria da Universidade do Estado do Rio de Janeiro, Rio de Janeiro – RJ, CEP
20550-013, Brazil
Received: 28 June 2005 – Accepted: 15 August 2005 – Published: 24 August 2005 Correspondence to: N. R. Rigozo ([email protected])
CPD
1, 121–135, 2005
Solar variability and climatic effects from
tree rings width
N. R. Rigozo et al. Title Page Abstract Introduction Conclusions References Tables Figures J I J I Back Close
Full Screen / Esc
Print Version Interactive Discussion
EGU
Abstract
Spectral and wavelet analysis were performed on a tree ring width time series obtained from a 2500 yr old cypress tree (Fitzroya cupressoides) from Costa del Osorno, Chile. The periods for analysis were selected at 95% confidence level. Both periodicities characteristic of solar activity and climatic variations were found in this tree ring width
5
series. The 11 and 22 years solar cycle periods were present in tree ring data with a confidence level above 98%. This indicates the solar modulation of climatic variations is being recorded by the tree ring grown. However wavelet analysis shows that these are present only sparsely. Short-term variations, between 2–5 years, are also present in tree ring data, and are shown by wavelet maps to be a more permanent
character-10
istic. This time scale is a signature of ENSO events. Long-term variations, above 200 years, are also present in tree ring data. The spectral analysis performed in this work shows that this species has the ability to record solar-ENSO variations that seems to be affecting the local environment of tree growth, and also that this region was influenced by ENSO events at least in the past 2500 yr interval covered by this study.
15
1. Introduction
ENSO has a very strong influence on the climate in the South America and through teleconnections it may cause climatic anomalies in remote locations of the world, as for example driving droughts in Africa and floods in North America (Neelin and Latif, 1998). Both Southern Brazil and Chile, regions studied in this work, have high annual
20
positive anomalies precipitation in periods of El Ni ˜no (Dai and Wigley, 2000).
Tree growth rings have been used to reconstruct both past climate and solar vari-ability (Dutilleul and Till, 1992; Hughes et al., 1982; Kurts et al., 1993). The growth of tree ring depends of the amount of water precipitation and of temperature. Thus it is expected that precipitation and temperature fluctuations caused by ENSO, and
oth-25
CPD
1, 121–135, 2005
Solar variability and climatic effects from
tree rings width
N. R. Rigozo et al. Title Page Abstract Introduction Conclusions References Tables Figures J I J I Back Close
Full Screen / Esc
Print Version Interactive Discussion
EGU
ring. In the South America region, researches with tree ring chronologies were made in order to study climate records in samples from Chile and Argentina (Hughes et al., 1982).
A new methodology was developed by Rigozo (1998) to study the solar activity and others geophysical signals in tree ring samples. Rigozo (1998), Rigozo and
Norde-5
mann (2000a), Rigozo et al. (2002, 2003, 2004a), Nordemann and Rigozo (2003) have identified the 11 year solar cycle in tree ring samples from Southern Brazil, using spec-tral analysis. ENSO signal on tree rings from Southern Brazil (Rigozo et al., 2003) and Chile (Rigozo et al., 2004b) have been investigated for the last 150 year interval. In this paper a case study of solar variability and climatic effects was performed on a Chilean
10
cypress tree (ca. 565 AC-1991 AD) growth ring width time series using multitaper and wavelet spectral analysis in order to study the influence of solar activity and ENSO signals on tree growth ring from Chile during a very long period (2500 years).
2. Methodology
The tree ring width time series obtained from a 2556-yr cypress tree (Fitzroya
cupres-15
soides) collected at Costa del Osorno (Lat.: 40◦S; Long.: 73◦500W; Alt.: 1000 m), Chile in 1991. The Fitzroya cupressoides species is sensible to both temperature and precipitation (Lara et al., 2000) and one of its main advantages is that individual series are generally over 900 years, so they represent an excellent source for the study of low-frequency signals (Wolodarskyh-Franke et al., 2002).
20
An image of a polished section of this tree was scanned by one of the authors (N.R. Rigozo) at the Department of Botany, University of Chile at Santiago (with Dr Aravena’s kind support). The growth ring time series were obtained from digitized images of an adequately polished slice side, by a method developed by us and named Interactive Treatment of Tree Ring Images – ITTRI (Rigozo, 1998). The errors on the determination
25
of ring thickness were estimated as about 1 pixel/ring per sample. The main positive points of this method are its low cost (necessary equipment is only a microcomputer
CPD
1, 121–135, 2005
Solar variability and climatic effects from
tree rings width
N. R. Rigozo et al. Title Page Abstract Introduction Conclusions References Tables Figures J I J I Back Close
Full Screen / Esc
Print Version Interactive Discussion
EGU
and a scanner) and that it does not need chemical treatments, radioactivity or mass spectrometric measurements, as occurs in isotopic methods.
The obtained tree ring width time series is normalize in function of its variance in the final growth rate tree, by choosing a function representing the growth trend (exponential fit) for the initial growth rate (ca. 565–88 AD) and final growth rate tree (89–1991 AD).
5
3. Spectral analysis methods
In spectral analysis, the use of a single taper in a time series reduces much of the bias due to spectral leakage in the spectral estimator, however, it also reduces the sample size and causes information to be lost (Parks, 1987). Thomson (1982) introduced the idea of using multiple tapers to recover the information lost while still maintaining
ac-10
ceptable bias. The method is known as the Multiple Taper Method – MTM. The MTM uses orthogonal windows (or tapers) to obtain approximately independent estimates of the power spectrum and then combines them to yield an estimate. This estimate exhibits more degrees of freedom and allows easier quantification of the bias and vari-ance trade-offs, compared to conventional Fourier analysis. The MTM has the ability
15
to detect small amplitude oscillations in a short time series without the necessity of filtering the signal. It has also an internal statistical F-test (F distribution) to obtain the significance level of the periodicity found (Thomson, 1990).
The parameter that controls the compromise between low variance and low bias is the product time*bandwidth (NW- number of windows or tapers). This is a resolution
20
parameter directly related to the number of tapers used to compute the spectrum. As NW increases, there are more estimates of the power spectrum and the variance of the estimate decreases. However, the bandwidth of each taper is also proportional to the NW, so as NW increases, each estimate exhibits more spectral leakage (wider peaks) and the overall spectral estimate is more biased. For each data set a specific value of
25
NW must be used (Thomson, 1982, 1990).
per-CPD
1, 121–135, 2005
Solar variability and climatic effects from
tree rings width
N. R. Rigozo et al. Title Page Abstract Introduction Conclusions References Tables Figures J I J I Back Close
Full Screen / Esc
Print Version Interactive Discussion
EGU
mits the identification of main periodicities in a time series and the evolution of their re-spective amplitude, frequency and phase. The wavelet transform of a discrete data se-ries is defined as the convolution between the data sese-ries and a scaled/translated ver-sion of a chosen wavelet function (Torrence and Compto, 1998; Percival and Walden, 2000).
5
By varying the wavelet time scale and interval, it is possible to construct a picture showing the amplitude variations for every periodicity. In this work, the complex Morlet wavelet analysis was used because it is the most adequate to detect variations in the periodicities of geophysical signals along time scales. The Morlet wavelet is a sine wave modulated by a classical Gaussian function (Torrence and Compto, 1998).
10
4. Results
A study of the spectral signal was performed by multitaper analysis on the tree ring width time series (Fig. 1a) obtained from a 2556-yr old cypress tree (Fitzroya
cupres-soides) sampled in 1991. The growth rate shows a decreasing tendency for all the tree
life with a clear growth rate decrease at about 100 AD which probably corresponds to
15
a drastic (local/regional/global) change of environmental/meteorological/climatic condi-tions at that moment. Wolodarskyh-Franke et al. (2002) have observed in their chronol-ogy of 5666 years from a nearby region in Chile (Contao, 41◦350S, 72◦300W), a period with growth below the average from 100 BC to 200 AD, coincident with sharp decrease in tree ring width the observed in this work. Other nearby chronology from Ayacara
20
was commented by these authors as presenting also the same trend, reinforcing the idea that there might be one or a combination of environmental factors (climate and or volcanism) which caused this reduction in growth. At present it is not possible to assess if this environmental factors was local/regional, but it does not seems probable to be a global one.
25
In order to remove this long trend, an exponential fit (white curve in Fig. 1a) is applied to tree ring width data and a tree ring detrended time series is obtained (Fig. 1b).
CPD
1, 121–135, 2005
Solar variability and climatic effects from
tree rings width
N. R. Rigozo et al. Title Page Abstract Introduction Conclusions References Tables Figures J I J I Back Close
Full Screen / Esc
Print Version Interactive Discussion
EGU
It can be observed that this series shows highly variable character, but a long-term modulation can be seen even by visual inspection. The obtained tree ring width time series is normalized in function of the variance (Fig. 1c) in the final growth rate tree (88–1991 AD) by multiplying variances rate ratio (initial variance/final variance) by the width time series.
5
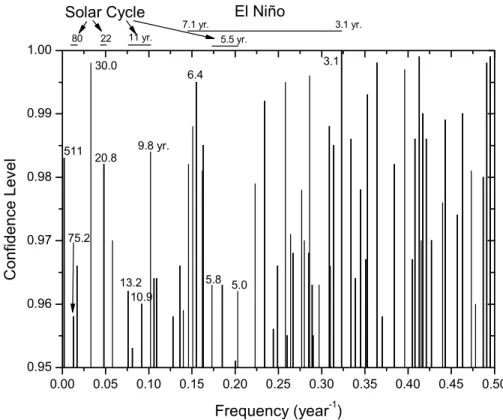
After removal of the long range tendencies, as above described, from tree ring time series, the spectral analysis is performed. Figure 2 shows the confidence level spec-trum obtained by MTM. The presence of peaks at both lower and high frequencies suggests that this species, growing at high altitudes sites, is very responsive to longer and shorter periods and to climatic factors influencing growth patterns.
10
The statistical estimate of significance of the frequency registered in the growth rings, above 95% of confidence, has been calculated using the multitaper method (Fig. 3). This figure shows high periodicities at 511 yr and short periods at 30, 20, 11, 7, 6, 5, 4, 3 and 2 yr. It may be observed that there exist peaks, with a high statistical estimate, close to the 75, 22, 11 and 5.5 years. Assuming that these signals have a solar origin,
15
it would appear that the length of the solar cycle over this period was between 9.8 to 13.1 years near the current average of 11.1 years obtained by Murphy (1990). The same result was observed also in tree rings by Murphy and Palmer (1992), who found during a 426 year interval around AD 177, a mean period of 10.5 years for the length of the “11-year” solar cycle. An equivalent result was observed by these authors, for
20
the “22-year” solar cycle, who obtained for the length of this solar cycle in the tree ring index a value of between 19.4 to 23.9 years.
Figure 2 shows high statistical estimates for the short periods, this represents a strong response of the tree rings to environmental influences. Some of these observed periods present estimated statistical significance above 99%, as it is the case of 6.6,
25
3.5, 3.1, 2.5, and 2.0 years.
The wavelet analysis was performed after removing from the original series the long term tendency function obtained by exponential function fit (Fig. 1a). The results of the wavelet analysis on the detrended series are shown in Fig. 3 and 4, respectively
CPD
1, 121–135, 2005
Solar variability and climatic effects from
tree rings width
N. R. Rigozo et al. Title Page Abstract Introduction Conclusions References Tables Figures J I J I Back Close
Full Screen / Esc
Print Version Interactive Discussion
EGU
for periods 2 to 2116 yr and 2 to 33 yr. Figure 3 evidences a strong period of 530 yr, sparse periodicities with variable amplitudes for periods between 530 yr and 11 yr. The enhancement of periods greater than about 100 yr correspond to the faster growth intervals from 100 BC to 120 AD seen in Fig. 1. In Fig. 4, the expected periodicity at about 11 yr (of possible solar origin) appears only sparsely. Periodicities between 3 to
5
6 yr clearly appear in the El-Ni ˜no domain but only after the growth decrease at 120 AD which was probably associated to permanent more severe environmental conditions and consequent greater sensitivity to external factors such as those induced by El-Ni ˜no.
5. Discussion
10
The long-standing suggestion that variations in the Sun’s total irradiance (the “solar constant”) on time scales of decades to millennia may have been the cause of long-term climate variations has been revived in recent years by spacecraft radiometric mea-surements (Wilson and Hudson, 1988) showing that the Sun’s total irradiance has var-ied more or less in phase with solar magnetic activity as measured by the sunspot
num-15
ber since peak of solar cycle 21 in 1980. As was originally pointed out by Eddy (1976), the Maunder minimum coincided roughly with one the coldest episodes of the Little Ice Age, when global temperatures have been estimated to have been 1 to 1.5◦C colder than modern temperatures (Crowley and North, 1991; Bradley and Jones, 1993).
Thus, it may be thought that variations in the total irradiation from the Sun can induce
20
variations in tree growth by some mechanisms which involve sun induced global and regional climatic variations and specific sensitivity of trees to ambient variations which intervene as limiting factors when in stress conditions.
Confirmation of ring width variations may be attributed, at least in part, to anomalous solar activity. Many early spectral studies failed to find any significant evidence of
25
solar periodicities (La Marche and Fritts, 1972). However, recent spectral studies have shown strong evidences of a 11-year period in tree ring data. Murphy (1990) found
CPD
1, 121–135, 2005
Solar variability and climatic effects from
tree rings width
N. R. Rigozo et al. Title Page Abstract Introduction Conclusions References Tables Figures J I J I Back Close
Full Screen / Esc
Print Version Interactive Discussion
EGU
evidences of a 11-year solar signal in tree ring data from Australia, with a time lag of 3 years. He also found periods close to the 22-year and 75 year (Gleissberg cycle) solar cycles. We also found a period close to the 11 year-old solar cycle and a strong evidence of the signal of the 22-year cycle.
These same results were found by Kurths et al. (1993) in samples of Miocene trees
5
from Germany, where they observed periods of 12.5 years and the second harmonic of 11 year cycle in 5.5 years. We observed the second harmonic solar cycle between 4.9 to 5.8 years in tree ring index from Chile. Rigozo (1998) also found periods of 11 years and 22 years of solar origin in two different tree ring chronologies obtained at Conc ´ordia, southern Brazil, of 160 years (1837–1996) and of 200 years (1797–1996).
10
Rigozo and Nordemann (2000b) also found periods around solar cycles of 11-year and 22-year in a tree ring chronology (1931–1996) obtained from 15 trees from S ˜ao Francisco de Paula, southern Brazil.
This spectrum analysis (Fig. 2) also presents variations with periods of 3 to 7 years, this may be an indication of the response of the tree rings growth to the environmental
15
conditions at their location. These results also show a non-stationary behavior of the local climatic conditions that could represent possible influences of El-Ni ˜no events and variations in the environmental conditions of the region where trees grew. Rigozo and Nordemann (2000a) observed in tree ring width time series many periods with weak amplitudes, between 2 to 7 years. Gray et al. (1992), in their model studies, have found
20
a variation in the period of occurrence of El Ni ˜no events, between 3 and 7 years. Wiles et al. (1998) also have found evidences of El Ni ˜no events with periods between 3 and 7 years in tree ring time series.
6. Conclusions
The spectral analysis of tree ring data from Chile presented strong evidences for the
11-25
year solar cycle and the Hale cycle. We observed also the second harmonic between 4.9 to 5.8 years. The results found are in agreement with other record studies of
CPD
1, 121–135, 2005
Solar variability and climatic effects from
tree rings width
N. R. Rigozo et al. Title Page Abstract Introduction Conclusions References Tables Figures J I J I Back Close
Full Screen / Esc
Print Version Interactive Discussion
EGU
the solar activity in the past, such as the concentrations of the cosmogenic isotopes carbon-14 (Stuiver and Quay, 1980) and beryllium-10 (Beer et al., 1988), and of tree ring data from Formosa, Colorado, Australia, Germany and Brazil.
The short periods observed can be due the environmental influences and climatic. The spectral analysis also presents variations with periods of 3 to 7 years, which are
5
visible for some intervals. This may be an indication of the response of the tree rings growth to the environmental conditions at their location. These results show a non-stationary behavior of the local climatic conditions that may represent possible influ-ences of El Ni ˜no events and the variations in the environmental conditions of the region where trees have grown up.
10
More studies of regional tree ring data, as this, become necessary to determine the relative importance of the solar influences in the Sun-Earth system, in the past, since tree rings are seemingly becoming an excellent proxy data base for solar variability. Acknowledgements. The authors wish to thank Conselho Nacional de Desenvolvimento Cien-tifico e Tecnol ´ogico – CNPq for support granted to this research (Projects PQ 300992/2003-3
15
and APQ 474185/2003-6) and post-doctoral fellowship (150102/2005-4) and to FAPESP post doctoral research Project 02/12723-2.
References
Bradley, R. S. and Jones, P. D.: “Little Ice Age” summer temperature variations: Their nature and relevance to recent global warming trends, The Holocene, 3, 367–376, 1993.
20
Corwley, T. J. and Noth, G. R.: Paleoclimatology, Oxford University Press, New York, 1991. Dai, A. and Wigley, T. M. L.: Global Patterns of ENSO-induced Precipitation, Geophys. Res.
Lett., 27, 1283–1286, 2000.
Dutilleul, P. and Till, C.: Evidence of periodicities related to climate and planetary behaviors in ring-width chronologies of Atlas Cedar (Cedrus Atlantica) in Marocco, Canadian J. Forest
25
Res., 22, 1469–1482, 1992.
CPD
1, 121–135, 2005
Solar variability and climatic effects from
tree rings width
N. R. Rigozo et al. Title Page Abstract Introduction Conclusions References Tables Figures J I J I Back Close
Full Screen / Esc
Print Version Interactive Discussion
EGU
Gray, W. M., Sheaffer, J. D., and Knaff, J. A.: Hypothesized mechanism for stratospheric QBO influence on ENSO variability, Geophy. Res. Let., 19, 107–110, 1992.
Hughes, M. K., Kelly, P. M., Pilcher, J. R., and LaMarche, V. C.: Climate from tree ring, Cam-bridge University Press, 1982.
Kurths, J., Spiering, C., M ¨uller-Stoll, W., and Striegler, U.: Search for solar periodicities in
5
Miocene tree ring widths, Terra Nova, 5, 359–363, 1993.
La Marche, V. C. and Fritts, H. C.: Tree-rings and sunspot numbers, Tree-Ring Bulletin., 32, 19–33, 1972.
Lean, J. and Rind, D.: Solar variability: implications for global change, EOS, 75, 1–7, 1994. Murphy, J. O.: Australian tree ring chronologies a proxy data for solar variability, Proceedings
10
ASA, 8, 292–297, 1990.
Murphy, J. O. and Palmer, J. G.: Ring Width Variation in Sub-Fossil Wood Samples as an Indicator of Shortterm Solar Variability 2000-yr B.P., Proc. Astron. Soc. Aust., 10, 68–70, 1992.
Murphy, J. O.: The downturn in solar activity during solar cycles 5 and 6, Proceedings ASA, 9,
15
330–331, 1991.
Neelin, J. D. and Latif, M.: El Ni ˜no Dynamics, Physics Today , 51, 32–36, 1998.
Nordemann, D. J. R., Rigozo, N. R., and Faria, H. H.: Solar activity and El-Ni ˜no signals ob-served in Brazil and Chile tree ring records, Advances in Space Research 35, 891–896, 2005.
20
Parks, J., Lindberg, C. R., and Vernon III, F. L.: Multitaper spectral analysis of high-frequency seismograms. J. Geophys. Res., 92, 12 675–12 684, 1987.
Rigozo, N. R.: Registros da atividade solar e de outros fen ˆomenos geof´ısicos em an´eis de ´arvores, Thesis (Doctorate in Space Geophysics), National Institute for Space Research, Brazil, 132 p., 1988
25
Rigozo, N. R. and Nordemann, D. J. R.: Records Solar Activity in Tree Rings from S ˜ao Francisco de Paula – RS (Brazil), Braz. J. Geophys., 18, 01, 91–97, 2000a.
Rigozo, N. R. and Nordemann, D. J. R.: Solar Activity Records in Tree-Ring, Revista Geofisica, 50, 163–170, 2000b.
Rigozo, N. R., Nordemann, D. J. R., Echer, E., Zanandrea, A., and Gonzalez, W. D.: Solar
30
Variability Effects Studied by Tree-Ring Data Wavelet Analysis, Adv. Spa. Res., 29, 1985– 1988, 2002.
Solar-CPD
1, 121–135, 2005
Solar variability and climatic effects from
tree rings width
N. R. Rigozo et al. Title Page Abstract Introduction Conclusions References Tables Figures J I J I Back Close
Full Screen / Esc
Print Version Interactive Discussion
EGU
ENSO imprints in tree ring data from Southern Brazil in the last century, Climatic Change, 60, 329–340, 2003.
Rigozo, N. R., Vieira, L. E. A., Echer, E., and Nordemann, D. J. R.: Search for Solar Periodicities in Tree-Ring Widths from Conc ´ordia (S.C., Brazil), PAGEOPH, 161, 221–233, 2004a. Rigozo, N. R., Nordemann, D. J. R., Echer, E., and Vieira, L.E.A.: ENSO influence on tree
5
growth ring from Chile and Brazil, Geofisica Internacional, 43, 287–294, 2004b.
Thomson, D. J.: Quadratic-inverse spectrum estimates: applications to palaeoclimatology, Phil. Trans. R. Soc. Lond. A, 332, 539–597, 1990.
Thomson, D. J.: Spectrum estimation and harmonic analysis, Proc. IEEE, 70, 1055–1096, 1982.
10
Torrence, C. and Compto, G. P.: A Practical Guide to Wavelet Analysis. Bulletin of the American Meteorological Society, 79, 61–78, 1998.
Wiles, G. C., D’Arrigo, R. D., and Jacoby, G. C.: Gulf of Alaska atmosphere-ocean variability over recent centuries inferred from coastal tree-ring records. Climatic Change, 38, 289–306, 1998.
15
Wilson, R. C. and Hudson, H. S.: Solar luminosity variations in solar cycle 21, Nature, 332, 810–812, 1988.
Wolodarsky-Franke, A., Lara, A., and Aravena, J. C.: Development of a 5666 year chronology from Fitzroya cupressoides tree-rings in southern Chile, 6th International Conference on Dendrochronology Proceedings, 379–381, 2002.
CPD
1, 121–135, 2005
Solar variability and climatic effects from
tree rings width
N. R. Rigozo et al. Title Page Abstract Introduction Conclusions References Tables Figures J I J I Back Close
Full Screen / Esc
Print Version Interactive Discussion
EGU
Figure 1 – (A) Original tree ring width time series and linear fitting (white curve). (B) Tree ring detrended time series and variance (white curve) for both growth rate (before 88 and after 89 AD). (C) Tree ring normalized time series.
Fig. 1. (a) Original tree ring width time series and linear fitting (white curve). (b) Tree ring
detrended time series and variance (white curve) for both growth rate (before 88 and after 89 AD).(c) Tree ring normalized time series (Nordemann et al., 2005).
CPD
1, 121–135, 2005
Solar variability and climatic effects from
tree rings width
N. R. Rigozo et al. Title Page Abstract Introduction Conclusions References Tables Figures J I J I Back Close
Full Screen / Esc
Print Version Interactive Discussion EGU 0.00 0.05 0.10 0.15 0.20 0.25 0.30 0.35 0.40 0.45 0.50 0.95 0.96 0.97 0.98 0.99 1.00 C onfi dence Le ve l Frequency (year-1) 9.8 yr. 13.2 20.8 511 10.9 30.0 75.2 3.1 5.8 6.4 El Niño 7.1 yr. 3.1 yr. 5.0 5.5 yr. 11 yr. 22 80 Solar Cycle
Figure 2 – Frequency multiple taper spectrum of the confidence level registered in the growth rings, above 95% of confidence level.
Fig. 2. Frequency multiple taper spectrum of the confidence level registered in the growth rings,
CPD
1, 121–135, 2005
Solar variability and climatic effects from
tree rings width
N. R. Rigozo et al. Title Page Abstract Introduction Conclusions References Tables Figures J I J I Back Close
Full Screen / Esc
Print Version Interactive Discussion
EGU
Figure 3 - Wavelet amplitude map for periods from 2 to 2116 yr ) with cone of
influence (smooth curve) and significance levels contour for 95%. A strong periodicity
may be seen at about 530 yr as well as some weaker ones. The enhancement of periods greater than about 100 yr correspond to the faster growth intervals from 100 BC to 120 AD seen in Fig. 1.
Fig. 3. Wavelet amplitude map for periods from 2 to 2116 yr with cone of influence (smooth
curve) and significance levels contour for 95%. A strong periodicity may be seen at about 530 yr as well as some weaker ones. The enhancement of periods greater than about 100 yr correspond to the faster growth intervals from 100 BC to 120 AD seen in Fig. 1.
CPD
1, 121–135, 2005
Solar variability and climatic effects from
tree rings width
N. R. Rigozo et al. Title Page Abstract Introduction Conclusions References Tables Figures J I J I Back Close
Full Screen / Esc
Print Version Interactive Discussion
EGU
Figure 4 - Wavelet amplitude map for periods from 2 to 33 yr with cone of influence
(smooth curve) and significance levels contour for 95%. The expected periodicity at
about 11 yr (of possible solar origin) appears only sparsely. The El-Niño domain (with periods between 2 to 6 yr) clearly appears, but only after the growth decrease (by a factor 2) since 70 AD-120 AD which was probably associated to permanent more severe environmental conditions and consequent greater sensitivity to external factors such as those induced by El-Niño.
Fig. 4. Wavelet amplitude map for periods from 2 to 33 yr with cone of influence (smooth
curve) and significance levels contour for 95%. The expected periodicity at about 11 yr (of possible solar origin) appears only sparsely. The El-Ni ˜no domain (with periods between 2 to 6 yr) clearly appears, but only after the growth decrease (by a factor 2) since 70 AD-120 AD which was probably associated to permanent more severe environmental conditions and consequent greater sensitivity to external factors such as those induced by El-Ni ˜no.