The
flavonoid 4,4′-dimethoxychalcone promotes
autophagy-dependent longevity across species
Didac Carmona-Gutierrez et al.
#Ageing constitutes the most important risk factor for all major chronic ailments, including
malignant, cardiovascular and neurodegenerative diseases. However, behavioural and
phar-macological interventions with feasible potential to promote health upon ageing remain rare.
Here we report the identification of the flavonoid 4,4′-dimethoxychalcone (DMC) as a natural
compound with anti-ageing properties. External DMC administration extends the lifespan of
yeast, worms and
flies, decelerates senescence of human cell cultures, and protects mice from
prolonged myocardial ischaemia. Concomitantly, DMC induces autophagy, which is essential
for its cytoprotective effects from yeast to mice. This pro-autophagic response induces a
conserved systemic change in metabolism, operates independently of TORC1 signalling and
depends on speci
fic GATA transcription factors. Notably, we identify DMC in the plant
Angelica keiskei koidzumi, to which longevity- and health-promoting effects are ascribed in
Asian traditional medicine. In summary, we have identi
fied and mechanistically characterised
the conserved longevity-promoting effects of a natural anti-ageing drug.
https://doi.org/10.1038/s41467-019-08555-w
OPEN
Correspondence and requests for materials should be addressed to G.K. (email:[email protected])
or to F.M. (email:[email protected]).#A full list of authors and their affiliations appears at the end of the paper.
123456789
T
he medical and socioeconomic advances experienced in
developed countries over the last century have greatly
extended life expectancy. However, health span has not
increased at the same pace, resulting in the growing incidence and
prevalence of age-related pathologies. Indeed, ageing remains the
main risk factor for all major chronic maladies, including
cardi-ovascular diseases, neurodegeneration and cancer
1. Since the
majority of ageing people are polymorbid, even considerable
advances against a single age-related disease may only marginally
improve health span. Therefore, tackling age-onset diseases by
targeting their commonality, the ageing process itself, appears the
most expedient approach. To date, only a few efficient dietary or
pharmacological anti-ageing interventions exist; these include
calorie restriction (the permanent reduction of total caloric intake
without malnutrition) and administration of pro-longevity drugs
like spermidine, rapamycin, metformin, NAD
+precursors, or
resveratrol
2,3. Further approaches that are able to regress (or at
least delay) the onset of pathogenic age-related decline are
urgently needed.
Interestingly, epidemiological studies suggest that the regular
consumption of polyphenol-rich foods may decrease the risk of
many chronic conditions
4, and certain polyphenols—most
pro-minently resveratrol—have been shown to extend life and/or
health span in several model organisms ranging from yeast to
mice
5.
Polyphenols
are
phytochemicals
widely
dispersed
throughout the plant kingdom with manifold functions in planta
ranging from pollinator attraction to pathogen and UV
protec-tion. Among them, the
flavonoids represent the largest
poly-phenol subgroup and many of them show anti-inflammatory,
anti-carcinogenic, anti-neurodegenerative and general
cytopro-tective properties
6,7. However, reports specifically addressing the
long-term effects of chemically defined flavonoids on ageing
remain rare.
Most if not all behavioural, nutritional, pharmacological, and
genetic manipulations that are known to extend lifespan stimulate
macroautophagy (hereafter referred to as autophagy). In fact,
autophagy seems to be a causal effector of these protective
characteristics. For instance, the longevity drugs resveratrol,
rapamycin, and spermidine, all lose their efficacy when autophagy
is suppressed
2. Autophagy is an intracellular recycling process, in
which damaged or superfluous macromolecules and organelles
are sequestered in two-membraned vesicles (autophagosomes)
and then targeted to lysosomes for bulk degradation
8. This
facilitates the supply of recycled components for biosynthesis and
thus contributes to cytoplasmic renewal and consequent cellular
rejuvenation. Conversely, impairment or dysregulation of
autophagic function results in age-related pathologies
9,10.
Alto-gether, autophagy is largely associated with cytoprotection and
overall health.
Here we report the identification of the flavonoid
4,4′-dime-thoxychalcone (DMC) as a natural autophagy inducer with
phylogenetically conserved anti-ageing properties. We found that
administration of DMC promotes cytoprotection and autophagy
across species and that autophagy induction is required for the
beneficial effects of this compound. Autophagy activation by
DMC depends on specific GATA transcription factors, but not on
the TORC1 kinase, a major regulatory instance of autophagy.
This suggests synergistic potential with other anti-ageing
inter-ventions that do rely on TORC1 signalling.
Results
4,4′-dimethoxychalcone (DMC) promotes longevity across
species. In an effort to identify novel natural compounds with
anti-ageing properties, we screened a library of 180 compounds
representing different subclasses of
flavonoids (Supplementary
Table 1) for their ability to counteract age-related cellular demise.
For this purpose, we monitored cellular health during yeast
chronological ageing—an established model for the ageing of
human post-mitotic cells
11–13—in the presence of each of these
flavonoids at a concentration of 50 µM. Using a high-throughput
approach (Fig.
1
a, Supplementary Fig. 1a–e), we determined in
parallel (i) cellular membrane integrity (survival) by means of
propidium iodide (PI) staining (Fig.
1
b, Supplementary Fig. 1d),
(ii) the clonogenic potential (outgrowth) of aged cells (Fig.
1
b,
Supplementary Fig. 1e), and (iii) the production of reactive
oxygen species (ROS) detectable as the ROS-driven conversion of
dihydroethidium to
fluorescent ethidium (Fig.
1
c). In each of
these three independent assays, DMC emerged as a top
cyto-protective hit. Upon further determining the concentration
dependency of DMC’s rescuing effect, we established the optimal
dose in yeast to be at 100 µM (Supplementary Fig. 2a). DMC’s
potential to reduce chronological age-related cell death (as
assessed by PI staining) was thereby comparable to that of several
compounds previously reported as cytoprotective in ageing
models. Precisely, DMC partly outperformed other polyphenols,
including resveratrol and specific flavonoids (at 100 µM, as
DMC), and yielded a similar protective capacity as rapamycin (at
its optimal dosage of 40 nM) (Supplementary Fig. 2b).
Con-firming and extending our screening results, DMC treatment
reduced the age-related increase in apoptotic and necrotic cell
populations as determined by AnnexinV/PI co-staining,
dimin-ished the population of ROS-accumulating cells and promoted
clonogenicity during ageing (Fig.
1
d–f, Supplementary Fig. 2c, d).
We next examined whether DMC would act as an anti-ageing
compound in two multicellular organisms, namely, the nematode
Caenorhabditis elegans and the fruit
fly Drosophila melanogaster.
Remarkably, chronic DMC treatment (41.6 µM for worms, 200
µM for
flies) prolonged the median lifespan of both model
organisms by approximately 20% (Fig.
1
g, h, Supplementary
Fig. 3a–k, Supplementary Table 2). Of note, DMC did neither
affect food intake (Supplementary Fig. 4a) nor fecundity
(Supplementary Fig. 4b) of
flies, and its longevity-extending
effects were independent of the food composition (Supplementary
Fig. 4c–e). DMC (50 µM) also largely prevented the
senescence-mediated decrease of clonogenic survival in highly confluent
human cells (U2OS osteosarcoma, HeLa cervical carcinoma,
and H4 neuroblastoma cells) (Fig.
1
i, j, Supplementary Fig. 3l).
Altogether, these results suggest that DMC mediates
phylogen-etically conserved anti-ageing effects.
Autophagy is required for the beneficial effects of DMC. Most
anti-ageing interventions depend on autophagy to exert their
protective properties
2, and several
flavonoids have been reported
to stimulate autophagy
14. Thus, we tested whether DMC would
activate autophagy. Indeed, in yeast cells subjected to
chron-ological ageing, DMC increased the autophagy-dependent
redis-tribution of a GFP-Atg8 fusion protein towards vacuoles and its
subsequent degradation to yield free GFP (Fig.
2
a–c,
Supple-mentary Fig. 5a–c). Moreover, DMC treatment stimulated the
activity of Pho8ΔN60, a truncated form of alkaline phosphatase
(ALP), the vacuolar delivery and activation of which depends on
autophagy
15,16(Fig.
2
d, Supplementary Fig. S5d, e). In worms,
DMC feeding for 48 h resulted in increased formation of
autop-hagosomes as indicated by microscopic analysis of mCherry-fused
LGG-1, the worm homologue of Atg8 (Fig.
2
e, f). Moreover,
brains of aged
flies fed with DMC for 30 days exhibited reduced
abundance of Ref(2)P, the
fly homologue of human
sequestosome-1 (SQSTMsequestosome-1/p62), suggesting increased autophagic
flux, which
generally leads to reduced abundance of Ref(2)P
17(Fig.
2
g, h).
lines (U2OS, colorectal carcinoma HCT116, hepatoma HepG2), as
determined by immunochemical detection of LC3 lipidation
(LC3-II) and microscopic detection of cytoplasmic GFP-LC3 dots
in the absence or presence of chloroquine, which stalls lysosomal
autophagosome degradation (Fig.
2
i, j, Supplementary Fig. 6a–h).
In addition, DMC caused a reduction of SQSTM1/p62 levels in
HCT116 and HepG2 cells (Supplementary Fig. 6i–k). Finally,
DMC administered intraperitoneally efficiently triggered
autop-hagic
flux in the heart and liver from wild type (WT) C57BL/6
mice, as shown by increased LC3 lipidation, even after leupeptin
treatment,
a
lysosomal
protease
inhibitor
(Fig.
3
a,
b,
Supplementary Fig. 6l, m). In conclusion, DMC induces
autop-hagic
flux in all model systems tested from yeast to mammals.
We next examined a possible causality between the induction
of autophagy and the protective effects of DMC. DMC reduced
the infarction area in mice subjected to prolonged myocardial
ischemia (with no reperfusion), an autophagy-associated and
ageing-relevant setting
18–20, but only in wild type animals and
not in mice with cardiac-specific autophagy deficiency (Fig.
3
c, d,
Supplementary Fig. 6n). Importantly, this dependence on
autophagy also held true for the longevity phenotype. The
knockout or knockdown of autophagy-related (ATG) genes,
c
a
b
h
i
g
Human U2OS cells 0 60 100 80 20 Survival (% of Ctrl. at day 1) 40 120 1 2 3 4 5 7 Age (days) 6 S. cerevisiae P < 0.001 (T) P < 0.001 (A) P < 0.001 (T x A) Ctrl. DMC 0 20 40 60 80 100 0 50 D. melanogaster Age (days) Ctrl. DMC 100 75 25 Survival (%) log-rank:P < 0.001 2 O 4 O –6 –4 –2 2 4 Survival (Z-score) Outgrowth (Z-score) 6 O 6 1 25 50 75 100 125 150 175 –7 –3 –2 –1 0 1 2 3 ROS (O 2 –) reduction (Z-score) Flavonoids 0 10 20 30 40 0 50 C. elegans Age (days) Ctrl. DMC 100 75 25 Survival (%) log-rank:P < 0.001d
e
Ctrl. DMC 0 5 10 15 20 25 30 35 Stained cells (%) AnnexinV AnnexinV/PI PI Day 3 1 2 3 4 5 6 7 0 10 20 30 40 50 ROS (O 2 –) accumulation (% population) Age (days) S. cerevisiae Ctrl. DMCf
BY4742 yeast, glucose medium 5 3 2 Day: 1 96-deep-well plate 0 Chronological ageing (2x) Survival (PI) ROS Outgrowth Flavonoid treatment (50 μM) P < 0.001 (T) P < 0.001 (A) P < 0.001 (T x A) Ctrl. DMC***
DMC DMCj
0 100 200 300Survival (colony number)
Ctrl. DMC
**
–4 –2
–6
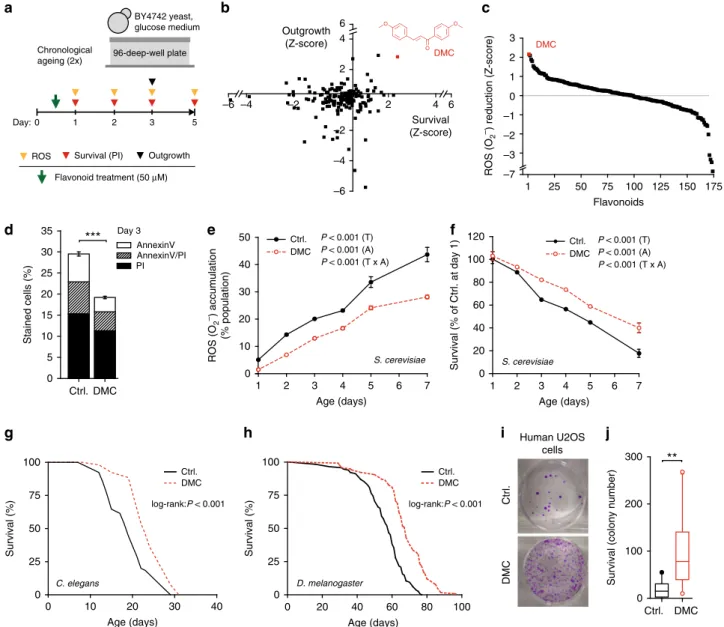
Fig. 1 4,4′-dimethoxychalcone promotes longevity in yeast, nematodes, flies and human cells. a Screening procedure for anti-ageing flavonoids in a yeast chronological ageing model.b, c Z-scores of AUCs obtained for eachflavonoid during the yeast screen and for each assay performed: PI staining, outgrowth capacity (b), and DHE to ethidium conversion (c); data obtained in 1–2 independent runs with three replicates each. Each data point represents one flavonoid. The data point and the structure of 4,4′-dimethoxychalcone (DMC) are shown in red. d–f Phosphatidylserine externalisation and membrane dysintegrity (d), ROS production (e) and survival (f) of DMC-treated yeast cells (100µM) at indicated time points of chronological ageing using AnnexinV/PI costaining (d), ***P < 0.001, n= 18, DHE to ethidium conversion, n = 6 (e) and clonogenicity, n = 8 (f) independent biological replicates; P-values represent T, treatment; A, age; T ×A, interaction.g, h Survival of C. elegans (g) or D. melanogaster (h) during ageing with supplementation of food with DMC (41.6µM for worms, 200 µM for flies). For other ageing replicates, see Supplementary Figure 2 (yeast) and 3 (nematodes, flies). i, j Replicative viability of DMC-treated (50µM) U2OS cells. Representative images (i) and quantification (j) are shown, **P = 0.0069, n = 11 independent biological replicates. Data in (d) represent means ± SEM; box plots in (j) represent IQR (line at median) and whiskers 10–90 percentile. Significance in (d, j) was assessed by two-sided Student’s t-test, in (e, f) by repeated measures two-way ANOVA. Source data for (b–f, j) are provided as a Source Data file
which code for essential components of the autophagic
machinery, abolished DMC-mediated lifespan extension in yeast,
worms, and
flies (Fig.
4
, Supplementary Fig. 7a–h). Altogether,
this indicates that autophagy induction is indeed necessary for the
beneficial effects of DMC.
DMC targets the yeast GATA transcription factor Gln3. Next,
we asked via which pathway(s) DMC might promote autophagy.
DMC did neither impair proteasome activity nor induce
endo-plasmic reticulum stress (Supplementary Fig. 8a, b), thus ruling
out two possible xenobiotic-mediated, pro-autophagic routes
21–23.
We then decided to examine the anti-ageing effects of DMC in
several yeast mutants deficient for genes/proteins known to be
involved in autophagic signalling
24(Fig.
5
a). The disruption of the
GATA transcription factor GLN3
25was the genetic intervention
that most prominently abated DMC-mediated cytoprotection
(Fig.
5
a, b, Supplementary Fig. 8c, d). Of note, this phenotype
b
a
d
h
e
Ctrl. DMCc
GFP-Atg8 25 35 Free GFP GAPDH Ctrl. DMC (kDa) Day 3 0 2 Day 3*
Ctrl. DMCVacuolar ALP activity
(RFU * 10 3 * μ g protein –1) 4 6 Ctrl. DMC 0 Autophagy induction
(mCherry::lgg-1 foci per animal)
C. elegans
***
100 200 300 400f
Ctrl. DMCg
0 Ref(2)P intensity (AU normalised to Ctrl.) Ctrl. DMC D. melanogaster**
1 2 3j
i
–Chlq. +Chlq. Ctrl. DMC 0 10 20 30 40 50 + Chlq. – Chlq. Ctrl. DMC Ctrl. DMC***
U2OS cells P < 0.001 (T) P < 0.001 (C) P < 0.001 (T x C) CytoplasmicGFP-LC3 dots per cell
Ctrl.
DMC
DIC GFP/PI overlay Day 3 0 2 4 6 8 10 12 Day 3
**
Autophagic flux(free GFP to GAPDH ratio)
Ctrl. DMC 40
Fig. 2 4,4′-dimethoxychalcone induces autophagy across species. a–d Autophagic flux in DMC-treated (100 µM) yeast indicated by the vacuolar accumulation of GFP-Atg8 (green); a representative micrograph is shown in (a), where propidium iodide (PI) counterstaining served to visualise dead cells (magenta). Corresponding quantification was performed by analysing the free GFP/GAPDH ratio (b). **P = 0.0024, n = 19 (Ctrl.), 18 (DMC) independent biological replicates;c representative immunoblot. Autophagy measured via alkaline phosphatase (ALP) activity of Pho8ΔN60 strains (d). *P = 0.0020, n= 11 independent biological replicates. See Supplementary Figure 5d for other time points. e, f Quantification (e) and representative pictures (f) of mCherry-foci in the intestine cells of DMC-fed (41.6µM) young adult worms expressing Pnhx-2::mCherry::lgg-1. ***P < 0.0001, n = 61 (Ctrl.), 65 (DMC) animals. Scale bar: 50µm. g, h Immunofluorescence analysis (g) and representative pictures (h) of ref.2P-marked protein aggregates infly brains after
30 days DMC feeding (200µM). **P = 0.0026, n = 12 (Ctrl.), 11 (DMC) animals. Scale bar: 50 μm. Significance in (b, e, g) was assessed by two-sided Student’s t-tests, in (d) by ANOVA/Bonferroni. i, j Videomicroscopic analysis (i) and representative pictures (j) of DMC-treated (50 µM) U2OS cells expressing GFP-LC3 with or without chloroquine, cell nuclei were stained with Hoechst 33342. Comparisons by two-way ANOVA (T, treatment; C, chloroquine; T × C, interaction) followed by Bonferroni-corrected simple main effects, ***P < 0.0001, n= 22 (Ctrl.-Chlq), 21 (DMC-Chlq), 18 (Ctrl. + Chlq), 30 (DMC+ Chlq) independent biological replicates. Scale bar: 10 μm. Box plots represent IQR (line at median) and whiskers 10–90 percentile. Source data for (b, d, e, g, i) are provided as a Source Datafile
could be reversed by episomal Gln3 expression (Supplementary
Fig. 8e, f), indicating that the observed effects were functionally
linked to the deletion. DMC-mediated cytoprotection was also
abrogated upon disruption of the Gln3 regulator protein
phos-phatase 2A (PP2A), either by deletion of its catalytic (PPH21/
PPH22) or one of its regulatory (TPD3) subunits (Fig.
5
a). The
three other yeast GATA transcription factors (Gat1, Dal80 and
Gzf3) failed to affect DMC treatment (Supplementary Fig. 9).
Consistently, DMC treatment could not induce autophagy in the
absence of Gln3 (Fig.
5
c, d). This suggests a crucial and specific
role of this GATA transcription factor in the execution of DMC
effects.
Gln3 is involved in the co-regulation of general amino acid
control
26, and interference with amino acid metabolism has been
linked to lifespan extension and autophagy induction across
species
27–29. In accordance with an impact of DMC on Gln3
function, the metabolomic and proteomic profiles of
DMC-treated yeast cells showed a pronounced influence on amino acid
metabolism (Fig.
5
e, Supplementary Fig. 10c, f, g). A similar
metabolic repercussion was detected upon metabolomic analysis
of heart and liver tissue of mice treated with DMC
intraper-itoneally (Supplementary Fig. 10a, b, d, e). Notably, the metabolic
imprint of DMC-treated wild type yeast seems to be very similar
to that of gln3 deletion mutants both with respect to the amino
acid profile
30(Fig.
5
e) and the metabolome in general (Fig.
5
f).
This suggests that the impact of DMC may suppress Gln3
activity. To test this, we monitored the expression of the
β-galactosidase-encoding lacZ gene placed under the control of the
Gln3-inducible MEP2 promoter, which is specifically targeted by
Gln3
31. In wild type yeast cells, DMC treatment reduced lacZ
activity to levels close to those observed in the GLN3 knockout
strain (Fig.
5
g). This further supports the possibility that DMC
mediates its effect by inhibiting Gln3 activity. We reasoned that in
this case, the genetic disruption of GLN3 should per se also
promote cytoprotection and autophagy. Indeed, GLN3 deletion
mutants exhibited decreased age-related cell death and higher
autophagy levels than wild-type cells (Fig.
5
b–d, Supplementary
Fig. 8c, d). Thus, Gln3 deletion and DMC treatment have similar,
epistatic effects on yeast cells with respect to autophagy induction
and cytoprotection, supporting the idea that both act on the same
pathway. Altogether, our data argue for an anti-autophagic role of
a
0.5 1.0 1.5 + Leup. Vehicle DMC Ctrl. Ctrl. DMC**
*
0.0 Autophagic flux(LC3II to GAPDH ratio)
Mouse heart 0 20 40 60 80 Ctrl. DMC Ctrl. DMC Atg7cKO WT
*
Infarct size * AAR
–1 (%) Ctrl. DMC (kDa) LC3I LC3II 18 16 GAPDH 38 Mouse heart LC3I LC3II 18 16 GAPDH 38 + Leup. Vehicle Ctrl. DMC WT Atg7cKO
b
c
d
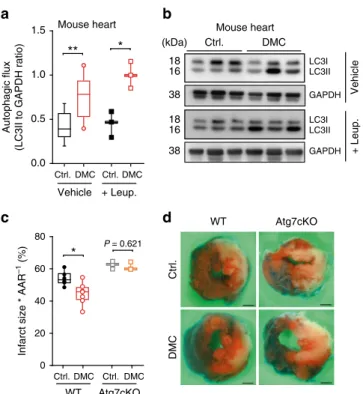
P = 0.621Fig. 3 4,4′-dimethoxychalcone promotes autophagy and cardioprotection in mice.a, b Autophagy induction in mouse heart tissue (a) determined by LC3 lipidation with leupeptin or vehicle injection after intraperitoneal injection of DMC (100 mg/kg) or DMSO (Ctrl.). n= 9 (Ctrl. Vehicle), 10 (DMC Vehicle), 3 (Leup.) animals, *P= 0.0105, **P = 0.0028; b representative immunoblot.c, d Infarction area per area at risk (AAR) (c) and representative images of left ventricular myocardial sections (scale bar: 1 mm) (d) after DMC treatment as in (a–b) followed by 3 h prolonged ischaemia in wild type (WT) and cardiac-specific Atg7 knockout mice (Atg7cKO). *P= 0.0134, n = 5 (Ctrl.), 6 (DMC), 3 (Atg7cKO) animals. Significance in (a, c) was assessed by two-sided Student’s t-tests between Ctrl. and DMC. Box plots represent IQR (line at median) and whiskers 10–90 percentile. Source data for (a, c) are provided as a Source Datafile
b
0 10 20 30 40 0 50 C. elegans Age (days) 100 75 25 Survival (%) WT Ctrl. WT DMC atg-5 (RNAi) Ctrl. atg-5 (RNAi) DMC P (WT) < 0.001 P (atg-5) = 0.688 0 20 40 60 80 100 0 50 D. melanogaster Age (days) Survival (%) 100 75 25 WT Ctrl. WT DMC Atg7–/– Ctrl. Atg7–/– DMC P (WT) < 0.001 P (Atg7–/–) = 0.064c
a
Ctrl. DMC Ctrl. DMC Δatg5 WT Ctrl. DMC Δatg7 Day 5***
0 5 10 15 20Cell death (PI positive)
normalised to Ctrl. at day 1
P > 0.999 P = 0.695
Fig. 4 Autophagy induction is essential for 4,4’-dimethoxychalcone-mediated protection. a Survival of DMC-treated (100 µM) yeast wildtype (WT), ATG5-deficient, and ATG7-deficient mutant strains at day 5 of chronological ageing measured by PI staining. Data are normalised to the WT Ctrl. at day 1. Comparisons by two-way ANOVA with treatment and strain as independent variables, followed by Bonferroni-corrected simple main effects. ***P < 0.001, n= 6 independent biological replicates. Box plots represent IQR (line at median) and whiskers 10–90 percentile. Refer to Supplementary Figure 7 for other time points and other replicate experiments. Source data for (a) are provided as a Source Datafile. b, c Survival of DMC-fed (41.6µM) control and autophagy-deficient Atg5 RNAi nematodes (b) or female wildtype (WT) and Atg7-deficient (Atg7−/−) mutantflies (c) during ageing. Refer to Supplementary Figure 7 for other replicate experiments. P-values represent pairwise comparisons (Ctrl. vs. DMC) by log-rank analysis
Gln3 during chronological ageing that can be suppressed by
DMC.
DMC acts independently of TORC1. We next asked how DMC
might target Gln3 activity. The classical model of Gln3
cytoplasmic-nuclear
translocation
and
activation
involves
TORC1-dependent negative regulation
32. Thus, TORC1
inhibi-tion, which is consistently connected to longevity
33, actually
sti-mulates Gln3 activity and does not suppress it as DMC.
Accordingly, treatment with rapamycin, an inhibitor of the
TORC1 kinase complex with well-established anti-ageing effects,
promoted activation of the Gln3-inducible MEP2 promoter, and
this effect was completely lost upon GLN3 deletion as previously
described
31(Supplementary Fig. 11a). Intriguingly, however,
rapamycin continued to mediate both cytoprotection and
autophagy induction under these GLN3-defective conditions.
Deletion of Gln3 did neither preclude the reduction of
age-dependent cell death (as determined by PI staining) nor the
sti-mulation of autophagic
flux (as determined by GFP liberation)
induced by rapamycin (Fig.
6
a–c, Supplementary Fig. 11b, c).
These results indicate that DMC and rapamycin mediate
cyto-protection
via
independent
pathways.
Consequently,
the
combinatorial treatment with both agents, which consistently
reduced Gln3 activity compared to rapamycin supplementation
alone (Supplementary Fig. 11d), resulted in additive
cytoprotec-tive effects (Supplementary Fig. 11e). Thus, DMC seems to
operate independently from TORC1. Indeed, neither deletion of
the main TORC1 component TOR1 nor YPK1, a downstream
target kinase of TORC2 involved in the positive regulation of
autophagy during amino acid starvation
29, influenced DMC
effects (Fig.
5
a). In line, as opposed to rapamycin, DMC did not
influence ribosomal protein S6 (Rps6) phosphorylation, a
downstream marker of TORC1 activity (Fig.
6
d; Supplementary
Fig. 11f). These data suggest that DMC regulates Gln3 activity in
a manner that differs from the classical TORC1-dependent route.
We further unveiled a functional interaction of DMC with the
Gln3 regulator PP2A. Its genetic inactivation by deletion of both
its functionally redundant catalytic subunits (PPH21, PPH22)
receded DMC effects (Fig.
5
a, Supplementary Fig. 11g). These
catalytic subunits can form distinct complexes with multiple
regulatory/specificity subunits relevant for Gln3 regulation. One
of these complexes is formed with the scaffold module Tpd3, the
deletion of which we found to revert DMC-mediated effects
(Fig.
5
a, Supplementary Figure 11g), similar to PPH21/22
disruption. Notably, this specific complex—as opposed to the
a
c
***
0 5 10 15 20 P < 0.001 (T) P < 0.001 (S) P < 0.001 (T x S) Day 5Cell death (PI positive)
normalised to Ctrl. at day 1 Ctrl. DMC Ctrl. DMC Δgln3 WT DMC rescue effect (fold of rescue in WT) 0.00 0.25 0.50 0.75 1.00 1.25 1.50 1.75 2.00 2.25 WT Δgcn4Δgln3Δmsn2Δmsn4 Δpph21/22
Δras2Δrim15Δsch9Δsir2Δsnf1Δsnf4Δtor1Δtpd3Δtpk1Δtpk2Δtpk3Δure2Δypk1
***
***
***
**
*** ***
***
***
b
6 8 –2 0 2 –4 –6 –8 0 2 4 –2 –4 –6 Day 1 PC 2 (24.5%) PC 3 (13.8%) WT Ctrl. WT DMC Δgln3 Ctrl. Δgln3 DMCd
e
(kDa)f
Alanine Arginine Asparagine Aspartic acid Glutamine Glutamic acid Glycine Histidine (Iso-)Leucine Lysine Methionine Phenylalanine Proline Serine Threonine Tryptophan Tyrosine Valine Ctrl. DMC Ctrl. DMC Δgln3 WT –2 0 2 log2-ratio: 0 1 2 3 4MEP2 promoter activation
(Miller Units * fraction alive
–1) Ctrl. DMC Ctrl. DMC Δgln3 WT P < 0.001 (T) P < 0.001 (S) P < 0.001 (T x S) Day 3
***
g
GFP-Atg8 25 35 Free GFP GAPDH 40 Δgln3: – + DMC: – + – – + + Day 3 P = 0.348 Ctrl. DMC Ctrl. DMC Δgln3 WT Autophagic flux(free GFP to GAPDH ratio)
0 2 4 6 Day 3 P = 0.094 (T) P = 0.011 (S) P = 0.040 (T x S) * P > 0.999 P = 0.155
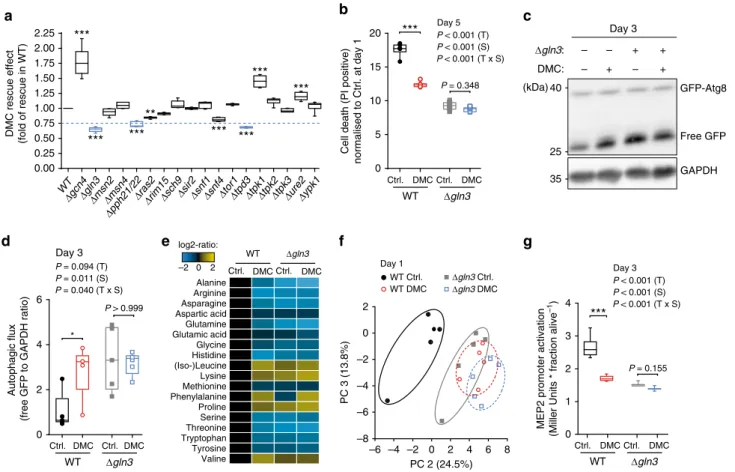
Fig. 5 Gln3 is a functional target of 4,4’-dimethoxychalcone. a DMC-rescuing effect determined as the AUC of PI-positive cells (day 1–5) upon DMC treatment (100µM) of yeast deletion mutants involved in autophagic signalling, normalised to the rescuing effect in wildtype (WT) cells. Hits below the threshold (0.75) are depicted in blue. Comparisons by ANOVA/Bonferroni. **P < 0.01, ***P < 0.001, n= 6 independent biological replicates. b Cell death at day 3 of chronological ageing of DMC-treated (100µM) yeast wildtype (WT) and GLN3-deficient mutant strains determined by PI staining normalised to Ctrl. at day 1 (b), ***P < 0.001, n= 6 independent biological replicates. (c, d) Autophagy induction of DMC-treated (100 µM) yeast wildtype (WT) and GLN3-deficient mutant strains indicated by the free GFP to GAPDH ratio normalised to WT Ctrl. (d), *P = 0.0242, n = 5 independent biological replicates; representative immunoblot in (c). e, f Changes in intracellular amino acid concentrations (e) and principal component analysis of yeast metabolites (f) 24 h after DMC-treatment (100µM) in wildtype (WT) and GLN3-deficient yeast cells. g Gln3-dependent MEP2 expression using a PMEP2-LacZ reporter at day 3 after DMC-treatment (100µM) in wildtype (WT) and GLN3-deficient yeast cells. **P = 0.0056, n = 12 (WT) n = 9 (Δgln3) independent biological replicates; Comparisons in (b, d, g) by two-way ANOVA (T, treatment; S, strain; T × S, interaction) followed by Bonferroni-corrected simple main effects. Box plots represent IQR (line at median) and whiskers 10–90 percentile. Source data for (a, b, d–g) are provided as a Source Data file
one with Tap42—is rapamycin-insensitive
34,35, supporting the
idea that TORC1 is not involved in DMC effects. In aggregate,
our data suggest that DMC functionally targets Gln3 in a
TORC1-independent manner.
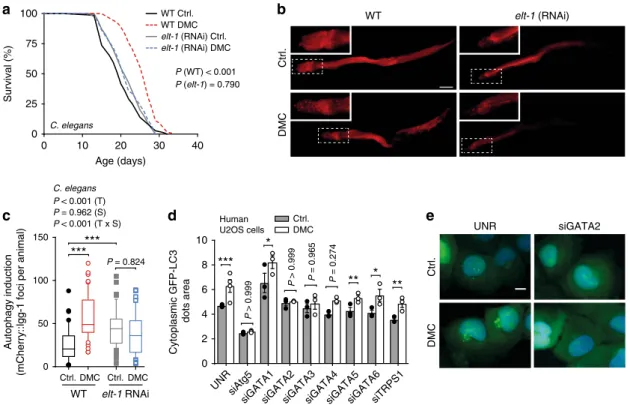
GATA transcription factors are conserved DMC effectors.
Finally, we tested whether the described dependence of DMC on
yeast Gln3 is phylogenetically conserved. Indeed, silencing of the
C. elegans GATA transcription factor elt-1, a Gln3 homolog,
precluded both DMC-mediated lifespan extension and autophagy
induction in worms (Fig.
7
a–c, Supplementary Fig. 12a, b).
Similarly, elt-1 knockout animals treated with DMC did not show
improved survival during ageing (Supplementary Fig. 12c–e).
Intriguingly, in human U2OS cells, siRNA-mediated silencing of
GATA2 (and to a lower extent also that of GATA3, but not that
of other Gln3 homologues), precluded autophagy induction by
DMC (Fig.
7
d, e, Supplementary Fig. 13). In contrast,
rapamycin-induced autophagy remained unaltered upon GATA2 silencing
(Supplementary Fig. 14a), again supporting the concept that
DMC and rapamycin ignite independent pathways across species.
In fact, DMC—as opposed to rapamycin—did not inhibit
TORC1 signalling as determined by sustained S6K1
phosphor-ylation levels (Supplementary Fig. 14b). In aggregate, these results
indicate a conserved role for specific Gln3-like GATA
tran-scription factors in DMC-mediated autophagy and lifespan
extension.
Discussion
While the beneficial effects of certain behavioral and dietary
strategies (especially calorie restriction) are uncontestable
2, most
individuals have difficulties to strictly and permanently adhere to
them. This has encouraged the search for potential
pharmaco-logical alternatives. The present work identifies the flavonoid
4,4′-dimethoxychalcone (DMC) as an anti-ageing compound with
cardioprotective effects in mice and the potential to promote
longevity across species. This echoes prior studies reporting that
chalcones possess a wide—though poorly defined—range of
biological activities relevant to human health
6. So far, DMC
has been only reported to mediate a mild anti-malarial (IC
5021.7 µM)
36activity and to inhibit the proliferation of human
K562 leukaemia cell lines (IC
5015 µM)
37. To our knowledge,
there is no natural source of DMC known to date. Intriguingly,
a
c
b
d
Ctrl. DMC Rapa 0.0 0.5 1.0 1.5 2.0Phospho-Rps6 to GAPDH ratio Δgln3 : – – Rapa : + + – + – + Day 3 GFP-Atg8 Free GFP 25 40 35 GAPDH (kDa) Autophagic flux
(free GFP to GAPDH ratio)
0 5 10 15 20 Ctrl. Rapa Ctrl. Rapa Δgln3 WT
**
P < 0.001 (T) P < 0.001 (S) P < 0.003 (T x S) Day 3***
*
***
0.0 0.5 1.0 1.5 Ctrl. Rapa Ctrl. Rapa Δgln3 WTCell death (PI positive) normalised to WT Ctrl.
P < 0.001 (T) P < 0.001 (S) P = 0.288 (T x S) Day 3
***
***
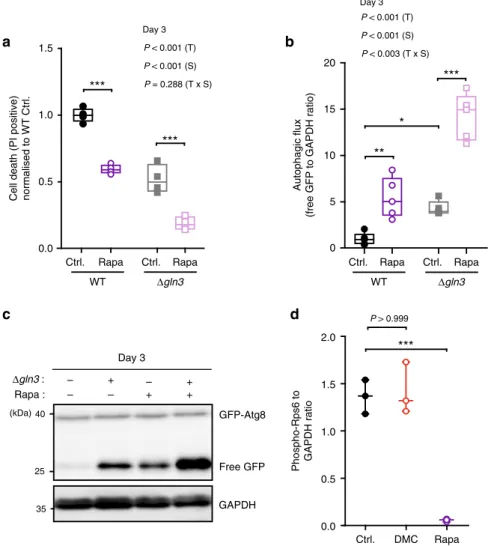
P > 0.999Fig. 6 Rapamycin and 4,4′-dimethoxychalcone follow independent routes of cytoprotection. a–c Cell death assessed by PI staining and flow cytometry normalised to WT Ctrl. (a) and autophagy induction indicated by the free GFP to GAPDH ratio normalised to WT Ctrl. b, c of S. cerevisiae wildtype and GLN3-deficient mutant strains after treatment with 40 nM rapamycin (Rapa) at day 3 of chronological ageing. Comparisons in (a, b) by two-way ANOVA (T, treatment; S, strain; TxS, interaction) followed by Bonferroni-corrected simple main effects. *P < 0.0483, **P < 0.0055, ***P < 0.001, n= 4 (a), 5 (b) independent biological replicates. (d) Rps6 S232/S233 phosphorylation of S. cerevisiae wild-type cells after 6 h of DMC (100µM) or 40 nM rapamycin (Rapa) treatment as determined by immunoblotting. Comparisons by ANOVA/Bonferroni. ***P < 0.001, n= 3 independent biological replicates. Box plots represent IQR (line at median) and whiskers 10–90 percentile. Source data for (a, b, d) are provided as a Source Data file
we could detect DMC in the stipes and leaves (but not in the
roots) of the chalcone-rich plant Angelica keiskei koidzumi
(commonly known under the Japanese name of Ashitaba), to
which longevity- and health-promoting effects are attributed in
Asian folk medicine (Supplementary Fig. 15a, b). This fuels the
expectation that DMC may be therapeutically applicable in
humans. Incidentally, DMC seems to be well tolerated in mice
with no apparent side effects or toxicity, at least up to a dose level
of 2000 mg/kg per os during an observation time of 14 days
38.
Moreover, we could detect DMC in the blood plasma of
middle-aged mice that were fed with chow containing 0.25% DMC for
7 days, suggesting that orally administered DMC becomes
bioa-vailable in mammals (Supplementary Fig. 15c).
Our data further demonstrate that the protective effects of
DMC are mediated by autophagy induction. Intriguingly, the
anti-ageing capacity of most interventions—independently of
their upstream targets—seems to converge in autophagy
induc-tion. Still, many
flavonoids have antioxidant potential that might
mediate some degree of acute cytoprotection separately from
autophagy. For instance, DMC protected mice against
hepato-toxicity induced by acute ethanol intoxication, as measured by
decreased serum alanine aminotransferase (ALT) activity, in both
wild type and whole body ATG4B knockout animals
(Supple-mentary Fig. 6o). Along similar lines, DMC slightly reduced cell
death during the early phase of chronological ageing in different
yeast strains, were they autophagy-competent or not
(Supple-mentary Fig. 7h). However, at later time points, the anti-ageing
effects of DMC were largely lost in autophagy-deficient yeast
strains. In fact, the antioxidant capacity does not solely determine
the long-term effects of cytoprotective
flavonoids, as indicated by
the fact that several
flavonoids with powerful antioxidant
activ-ity
39failed to mediate anti-ageing effects in our initial screen
(Supplementary Fig. 2e). Accordingly, other studies have shed
doubts on the exclusive relationship between the
health-promoting and antioxidant properties of
flavonoids
40.
DMC promotes autophagy via a pathway that involves specific
GATA transcription factors. In yeast, our results suggest that
during chronological ageing, the GATA transcription factor Gln3
limits survival by exerting an anti-autophagic role, and that this
can be reverted by DMC. While a previous genetic
high-throughput study, in which
Δgln3 cells were found to be
long-lived
41, supports this notion, the role of Gln3 in autophagy seems
to be more controversial. In discrepancy with our data, Gln3 has
previously been shown to promote ATG14 expression upon
nitrogen starvation in the logarithmic phase, raising the
pre-sumption that it might have a general pro-autophagic role
42.
However, this work did not measure actual autophagic
flux in
gln3-deficient strains, and ATG protein expression levels alone
are not an accurate means to monitor autophagy
15,43. In addition,
a more recent study has challenged these observations by not
finding any changes in ATG14 transcription or autophagy
induction in gln3 deletion mutants subjected to nitrogen
starva-tion, although other ATGs seemed to be upregulated
44. More
importantly, this latter report also showed that under basal
autophagic conditions in the logarithmic phase, the deletion of
GLN3 (but not GAT1) actually promoted accumulation of ATG8
a
b
c
d
Ctrl. DMC elt-1 (RNAi) WT UNR siGATA2 Ctrl. DMC 0 10 20 30 40 0 25 50 75 100 C. elegans Age (days) Survival (%) WT Ctrl. WT DMC elt-1 (RNAi) Ctrl. elt-1 (RNAi) DMC P (WT) < 0.001 P (elt-1) = 0.790 elt-1 RNAi 0 50 100 150 Ctrl. DMC Ctrl. DMC WT C. elegans***
P < 0.001 (T) P = 0.962 (S) P < 0.001 (T x S)***
Autophagy induction(mCherry::lgg-1 foci per animal)
e
0 2 4 6 8 10 Cytoplasmic GFP-LC3 dots area UNRsiGATA1siGATA2siGATA3siGATA4siGATA5siGATA6siTRPS1
siAtg5 Ctrl. DMC Human U2OS cells
**
*
**
*
***
P > 0.999 P > 0.999 P = 0.965 P = 0.274 P = 0.824Fig. 7 GATA transcription factors are phylogenetically conserved effectors of 4,4′-dimethoxychalcone. a Survival of DMC-fed (41.6 µM) control and GATA transcription factor-deficient elt-1 RNAi nematodes. P-values represent pairwise comparisons by log-rank analysis. Refer to Supplementary Figure 12 for other replicate experiments.b, c Representativefluorescence pictures (b) and quantification (c) of mCherry-positive foci in the intestine cells of DMC-fed (41.6µM) or untreated control or GATA-factor-deficient elt-1 (RNAi) nematodes expressing Pnhx-2::mCherry::lgg-1 reflective of autophagosome generation. Comparisons by two-way ANOVA (T, treatment; S, strain; TxS, interaction) followed by Bonferroni-corrected simple main effects. ***P < 0.001, n= 44 (WT Ctrl.), 53 (WT DMC), 57 (elt-1 Ctrl.), 51 (elt-1 DMC) animals. Scale bar: 50µm. Box plots represent IQR (line at median) and whiskers 10–90 percentile.d, e Autophagy induction in DMC-treated (50µM) human U2OS cells with siRNA against an unrelated sequence (UNR) or GATA transcription factors as determined via videomicroscopy of cells expressing GFP-LC3 (d). Cell nuclei were stained with Hoechst 33342. Data shown as means of three different siRNA constructs ± SEM. Comparisons by ANOVA with Tukey correction. *P < 0.05, **P < 0.001, ***P < 0.001, n= 4 (UNR), 3 (others) independent biological replicates. Representative images are shown in (e). Scale bar: 10µm. Source data for (c, d) are provided as a Source Data file
and ATG29 mRNAs (ATG14 remained unaffected).
44The
authors of that study concluded that Gln3 must have a direct or
indirect role in the repression of some ATG genes when
autop-hagy functions at basal/physiological levels
44. Accordingly, we
observed increased expression levels of different ATG proteins in
ageing
Δgln3 cells (Supplementary Fig. 16). While under acute
autophagy induction, e.g. upon nitrogen starvation, Gln3 might
positively contribute to the expression of distinct ATGs
44, our
data and the recent literature
41,44are consistent with a role for
Gln3 in restraining cytoprotective autophagy operating at a basal
activity, at least during physiological chronological ageing
con-ditions. We thus surmise that, by interfering with the
autophagy-repressive activity of Gln3, DMC can increase autophagic
flux
thus conferring cytoprotection upon ageing.
Both Gln3 activation
32and lifespan extension
33are associated
to inhibition of TORC1. However, we show here that these two
outcomes are correlative, i.e. that Gln3 activation as it occurs
during TORC1 inhibition is not causal for cytoprotection.
Simi-larly, our results support the notion that Gln3 is not required for
rapamycin-mediated autophagy induction, as GLN3 deletion and
rapamycin treatment induce autophagy in an additive manner.
These data suggest, on the one hand, that DMC regulates Gln3
activity TORC1-independently. Indeed, recent evidence indicates
that such non-canonical mechanisms of Gln3 regulation may
exist
45–47. On the other hand, it establishes synergistic potential
with other anti-ageing interventions that act on the TORC1
inhibitory pathway. As a proof of principle, we show that DMC
and rapamycin (a specific TORC1 inhibitor) exert additive
cytoprotective effects.
Several GATA transcription factors have been connected to
lifespan control
48in higher eukaryotes, and we can show that—as
in yeast—DMC effects depend on specific GATA transcription
factors in nematodes and human cell cultures. It should be noted
that in worms, silencing of the GATA transcription factor elt-1
did not per se promote organismal lifespan extension (as opposed
to yeast Gln3), although it did increase autophagy in intestinal
cells. This might be due to tissue-restricted effects of elt-1 RNAi
or due to a higher complexity of longevity regulation in higher
eukaryotes through interactions among several GATA family
members
49. In mammalian cells, the role of GATA transcription
factors in autophagy is only starting to be elucidated with
dif-fering outcomes depending on the specific factor. Only two
reports have addressed this issue
50,51. On the one hand, GATA1
has been shown to promote autophagosome formation and
transcription of genes encoding ATG components in human
erythroblasts, although the effects on different ATGs were rather
heterogeneous
50. On the other hand, GATA4 seems to inhibit
doxorubicin-mediated autophagy in rat cardiomyocytes
51. Our
data identifies GATA2 as a further family member with
anti-autophagic capacity, at least under the tested conditions.
In the last century, life expectancy has increased globally,
resulting in a demographic transformation characterised by an
increased ageing population. This has greatly boosted the
inci-dence and prevalence of late onset afflictions, which represents a
pressing socioeconomic concern. Thus, it is critical to devise
feasible anti-ageing interventions. The present work establishes
the potential of DMC as a pharmacological instrument against
ageing and age-related diseases. Future studies must explore
whether DMC and/or its chemically defined derivatives can be
advantageously used in humans as well.
Methods
Reagents. The following reagents were purchased from the indicated suppliers: FITC-labeled Annexin V (Roche Applied Science [11828681001]), diyh-droethidium (DHE, Aldrich, [D7008]), propidium iodide (PI, Sigma-Aldrich [P4170]), 4,4′-dimethoxychalcone (DMC; ABCR, [AB179040];
Extrasynthese, [1295]; Sigma-Aldrich, [S617237]), rapamycin (LC laboratories, [R-5000]), resveratrol (Sigma-Aldrich [R5010]). For the initial yeast screen, all fla-vonoids (including 4,4′-dimethoxychalcone) were purchased from Extrasynthese; for a complete list including the name, subclass and article number of each fla-vonoid please refer to Supplementary Table 1. Flafla-vonoid stock solutions were always freshly prepared in DMSO prior to treatment. Acetonitrile (Chromasolv), formic acid (puriss), ethylacetate (Chromasolv) were purchased from Sigma Aldrich (St Lois, USA). Water was purified by MilliQ system (<18.2 MΩcm, Merck, Darmstadt, Germany).
Yeast strains and plasmids. Experiments were carried out in BY4742 (MATα his3Δ1 leu2Δ0 lys2Δ0 ura3Δ0) and respective null mutants, obtained from Euro-scarf or self-generated (Supplementary Table 3) as described below. To monitor subcellular localisation of endogenous Atg8, a previously reported strain expressing an EGFP–Atg8 fusion protein was used52. Atg protein expression was determined
using chromosomal 6(HA)-tagged strains, generated using pYM17 as a template53.
All strains were grown on SC medium containing 0.17% yeast nitrogen base (BD Diagnostics, Schwechat, Austria), 0.5% (NH4)2SO4, 30 mg/l of all amino acids (except 80 mg/l histidine and 200 mg/l leucine), 30 mg/l adenine and 320 mg/l uracil, with 2% glucose (SCD). For complementation experiments with Gln3, i.e. for episomal Gln3 expression, cells were grown on SCD as described below and uponflavonoid treatment galactose was added to a final concentration of 0.1% to induce expression. Successful expression was verified via western blot; note that the double band obtained (Supplementary Fig. 8f) is characteristic for Gln354.
Yeast chronological ageing experiments. Chronological ageing experiments were carried out in 96-deepwell plates (Bel-Art Products, USA), sealed with gas-permeable adhesive membranes (Excel Scientific) and lids. Therefore, 500 µl of fresh media were inoculated with overnight cultures from cellular material of a 4-day-incubated YEPD plate to an OD600of 0.1 (~1.106cells ml–1). Thereby, the wells at the outer rims of the deepwell plates were not inoculated, since they are prone to dry out in the course of ageing; instead they were loaded with water. Next, cells were grown to an OD600of ~0.2 and subsequently supplemented with either the indicated concentration of freshly DMSO-dilutedflavonoid or DMSO alone (control), both at afinal concentration of 0.2% DMSO. Aliquots were taken out to perform different viability stainings (PI, DHE, AnnexinV/PI), survival tests (plat-ing, regrowth capacity)13,55, and/or autophagy assays (EGFP-Atg8, ALP) at
indi-cated time points (Fig.1a).
For the initial yeast screen, eachflavonoid was supplemented at a concentration of 50 µM. After identification of DMC as a top cytoprotective hit, we determined the optimal dose for treatment in yeast at 100 µM, at least under the applied conditions. This was the lowest concentration exerting the highest rescue effect (Supplementary Fig. 2a).
One of the major causes of yeast chronological ageing might be the excessive production of acetic acid56. Consistently, yeast lifespan can be prolonged by
alkalinization of the medium52. Of note, DMC treatment did not alter the pH of
the medium (Supplementary Fig. 2f), demonstrating that the cytoprotective effects of DMC upon yeast chronological ageing are pH-independent.
If not otherwise stated, representative ageing experiments are shown with at least six independent biological replicates aged at the same time. Experiments were performed at least three times in total with similar outcome, except during the screening procedure, where eachflavonoid was tested in three to six independent samples for each ageing experiment.
Assays for cell death markers in yeast. For the initial yeast screen, PI (necrosis) and DHE (superoxide anione O2-production) staining was performed as follows: ~1 × 10⁷cells were harvested by centrifugation for 5 min at 2,700 × g and stained for 5 min with propidium iodide (100 ng/ml in PBS pH 7.4) or dihydroethidium (2.5 µg/ml in PBS pH 7.4), respectively. Cells were pelleted again for 5 min at 2700 × g and resuspended in PBS. Relativefluorescence units were determined using afluorescence reader (Tecan, GeniusPRO) and normalised to the OD600of each sample. Then, the area under the curve (AUC) for all monitored days throughout chronological ageing was calculated and a Z-score computed for the results with PI and DHE, respectively. The results obtained in these high-throughput assays positively correlate with the corresponding low scale experi-ments (Supplementary Fig. 1a–c). Of note, an unstained sample of each well was tested at day 1 of chronological ageing to take account for possible intrinsic fluorescence properties of any given flavonoid that might interfere with our fluorescence-based assays. For the viability assay using outgrowth capacity, which has been previously used to determine ageing-associated viability41,57, aliquots (9
µl) were taken at day 3 of chronological ageing to inoculate 171 µl fresh SCD media in 96-well-plates. Cultures (total 180 µl) were grown at 28 °C, 1000 rpm (motor speed) and OD600was measured at the point of inoculation and 10 h thereafter using a plate reader (Tecan, GeniusPRO). Outgrowth was defined as the difference between the measured OD600at the time of inoculation and after 10 h of growth [OD600(10h)- OD600(inoculation)], and then normalised to the DMSO-treated control; finally, a Z-score was computed. As in the other high-throughput assays (see above), a positive correlation between outgrowth capacity and viability was established (Supplementary Fig. 1b).
Assays for apoptosis/necrosis (AnnexinV/PI co-staining) upon DMC treatment were quantified by flow cytometry (BD LSRII Fortessa, BD Biosciences). Briefly, ~1 × 10⁷cells were harvested by centrifugation for 5 min at 2700 × g and washed once with water and once with buffer B+ S (35 mM potassium phosphate buffer, pH 6.8, 0.5 mM MgCl2, 1.2 M sorbitol). To obtain spheroplasts, cells were resuspended in 330 µl buffer B+ S, 15 µl glucuronidase/arylsulfatase (Sigma-Aldrich, [BGALA-RO]) and 3 µl lyticase (1000 U/ml, Sigma-Aldrich [L2524]) were added, and cells were incubated at 28 °C for 30 min. Spheroplasts were pelleted at 500 g for 2 min and carefully washed once with buffer B+ 0.6 M sorbitol. Then spheroplasts were resuspended in 30 µl incubation buffer (10 mM HEPES pH 7.4, 140 mM NaCl, 5 mM CaCl2, 0.6 M sorbitol) and stained for 20 min by addition of 3 µl AnnexinV-FLUOS (Sigma-Aldrich [11828681001]) and 3 µl PI (100 µg/ml). Forflow cytometry, a total of 30,000 cells per sample were evaluated using BD FACSDiva software (BD Biosciences). ROS accumulating cells were quantified evaluated by DHE staining (see above) and subsequentflow cytometry and analysis of 30,000 cells. For clonogenic survival plating, cell counts of DMC-treated cultures and controls were measured using a CASY cell counter (Schärfe System GmbH), and 500 cells were plated on YEPD agar plates and incubated for two days at 28 °C to allow colony formation. The colony-forming units (CFUs) were analysed using an automated colony counter (LemnaTech). For each strain, the CFUs determined for the control cultures were set to 100%, and the survival of the respective DMC-treated cultures was calculated relative to the corresponding control culture. Plasmid construction and yeast knockout generation. Single and double-mutant strains were generated according to a reported method by either employing a gene-specific URA3-knockout cassette, amplified by PCR using pUG72 as a template58
or using the natNT2 or hphNT1 cassettes of pFA6a–natNT2 and pFA6a–hphNT1, respectively53. Correct gene deletion was verified by PCR with corresponding
control primers and further checked for consistent auxotrophies. All primers used are listed in Supplementary Table 4. The plasmid [pESC-His-6(HA)] was con-structed by digestion with SacI/ClaI and ligation with the 6(HA) fragment amplified from pYM17 using primers ClaI_6HA_f and SacI_6HA_r. GLN3 was amplified from genomic DNA from BY4742, using primers GLN3_F (NotI) and GLN3_R (ClaI) and cloned into the resulting vector using NotI/ClaI restriction sites (see Supplementary Table 5). Notably, at least three different clones of each generated mutant were tested for similar response to PI staining during ageing to rule out clonogenic variation.
Yeast autophagy measurements. Autophagy was examined according to pub-lished methods by determining either GFP liberation via immunoblot analysis (see Immunoblotting section) or vacuolar localization of Atg8 throughfluorescence microscopy in cells expressing an EGFP–Atg8 fusion protein52. In addition, ALP
activity16was assessed using corresponding Pho8ΔN60 cells transformed with and
selected for stable insertion of pTN9 HindIII fragment59: ~3 × 10⁷cells were har-vested by centrifugation at 2700 × g for 5 min and washed once with 500 µl H2O. Cells were resuspended in 200 µl ice-cold Assay buffer (250 mM Tris/HCl pH 9.0, 10 mM MgSO4, 10 µM ZnSO4) and transferred to a pre-cooled reaction tube with 100 µl acid-washed glass beads. Cells were disrupted in a beadmill (Mini-Bead-beater) in a pre-cooled metal reaction tube rack for 3 × 45 s with 30 s intervals in between. Cell debris was removed by centrifugation at 10,000 × g at 4 °C for 10 min and the supernatant carefully transferred to fresh pre-cooled tubes. Protein con-centration was determined using a Bradford protein assay (Bio-Rad [5000006]). Cell extracts corresponding to 1–1.5 µg protein were added to a final volume of 550 µl assay buffer (room temperature) and the reaction was started by addition of 50 µl α-naphtylphosphate (55 mM in assay buffer, pH 9.0). After 20 min at room tem-perature, the reaction was stopped by addition of 200 µl stopping buffer (2 M glycin/NaOH pH 11.0). Two hundred microlitres of the reaction mix was measured in black 96-well plates in a platereader (Tecan, GeniusPRO) at ex: 345 nm, em: 472 nm. To correct for intrinsic (background) ALP activity, control cultures (without pTN9) were simultaneously processed and ALP activity subtracted.
Yeast TORC1 activity. Cells were grown to an OD600of 0.2 and treated with either 100 µM DMC or 40 nM rapamycin for 6 h. Three OD600units were harvested and proteins extracted (see Immunoblotting section). Rps6 phosphorylation at serine 232 and 233 was detected with a phospho-S6 ribosomal protein (Ser235/236) antibody60(Cell Signaling [#2211 S], rabbit, 1:1000) and phosphorylation levels
normalised to GAPDH. As controls, stationary phase cultures of wild type and rps6aS232A,S233AΔrps6b strains (kind gift from Dr. Tarek Moustafa) were refed with fresh SCD medium for 1 h before harvest.
Yeast MEP2 promoter activation. MEP2 promoter-dependent lacZ expression was determined using a beta-galactosidase assay. At the indicated time points, 1.5 OD600units were harvested, washed once with water and lysed for 30 s in 380 µl Z-buffer (100 mM sodium phosphate Z-buffer pH 7.0, 10 mM KCl, 1 mM MgSO4, 40 mM 2-mecaptoethanol) with 50 µl 0.1% SDS and 50 µl CHCl3using a beadmill (Mini-Beadbeater). After addition of 50 µl 4 mg/ml o-nitrophenylgalactoside (Serva), suspensions were incubated at room temperature and stopped with 125 µl 1 M Na2CO3when the suspensions turned yellow. Samples were centrifuged for 5 min at 2700 × g and absorption of the supernatant was measured at 450 nm. To
assess the fraction of live cells, aliquots of the cultures were stained with PI and cell death measured byflow cytometry. Miller units/fraction alive were calculated using the formula [1000x A450]/[volume in ml*OD600*incubation time in min*fraction PI-negative cells].
Determination of yeast metabolomic changes. Yeast cells cultured in deep well plates were treated with 100 µM DMC (or 0.2% DMSO as control) for 72 h. For each replicate, 5 ml culture were rapidly harvested by microfiltration using 0.45 µm PVDF-filters, immediately washed with 10 ml ultrapure water, snap-frozen in liquid nitrogen, and kept at−80 °C prior to extraction. Boiling ethanol (BE) extraction was performed with 2.5 ml pre-heated BE buffer (75% v/v ethanol, 15 mM ammonium acetate pH 7.5) for 2 min at 96 °C in a water bath with short vortexing every 30 s. After extraction, the cells’ remnants were pelleted by cen-trifugation for 3 min at 2500 × g at−20 °C, the supernatant was concentrated by nitrogen evaporation and dry-frozen. Samples were dissolved in 100 µl LCMS-H2O, centrifuged at 17,000 × g for 5 min and the supernatant used for LC/MS.
All samples were measured with a LC/MS system from Thermo Fisher ScientificTM. A Dionex Ultimate 3000 HPLC setup equipped with an Atlantis T3 C18 analytical column (Waters, USA) was used for compound separation prior to mass spectrometric detection with an ExactiveTM Orbitrap system. A reversed-phase ion-pairing HPLC method was used for metabolite separation (adapted from ref.61). Tributylamine was used as ion-pairing agent. A 40 min gradient was
applied and 2-propanol and an aqueous phase (5% methanol (v/v), 10 mM tributylamine, 15 mM acetic acid, pH 4.95) were used as eluent A and B, respectively (Supplementary Table 6). The injection volume was 10 µl per sample and an injection loop of 20 µl was used.
Negative ionisation of metabolites was carried out via heated electrospray ionization (HESI) prior mass spectrometric analysis. For the online detection of the analytes a full scan of all masses between 70 and 1100 m/z with a resolution (R) of 50,000 (at m/z 200) was used.
LC/MS-data acquisition was conducted with Xcalibur software (version 2.2 SP1, Thermo Fisher Scientific (Waltham, USA)), Raw data were converted into mzXML by msConvert (ProteoWizard Toolkit v3.0.5), and metabolites were targeted-searched using the in-house developed tool PeakScout62. Pure analytes were run on
the same system to obtain exact reference retention times and fragmentation spectra. Raw data was further assessed with Microsoft Excel 2010. For metabolite clustering, metabolite areas were normalised to the cumulative signal of all metabolite areas for each day (the mean signal of each metabolite across all samples was set to 1) and log2 transformed. PCA analyses were performed using the tool Genesis 1.7.7 (Bioinformatics, Technical University of Graz). The complete data set is available in Supplementary Data File 1.
Determination of yeast proteome using SILAC. SILAC (stable isotope labeling by/with amino acids in cell culture) experiments were performed following pre-viously published protocols17. Briefly, proteins from labeled yeast cells (Lys0 +
Arg0 or Lys4+ Arg10) treated with 100 µM DMC for 24 h or 72 h were extracted by glass bead disruption in buffer P (50 mM Tris/HCl pH 7.4, 1% Triton X-100, 150 mM NaCl, 1 mM EDTA) containing complete® protease inhibitor cocktail (Roche), 1 mM PMSF (Sigma) and HDAC inhibitors trichostatin A (2 µM, Sigma) and nicotinamide (30 mM, Sigma). Protein concentration was determined using Bio-Rad protein assay (Bio-Rad) and 500 µg from each heavy and light extracts were mixed and stored at−80 °C prior to MS measurement. For MS sample preparation, probes were reduced with 1 mM DTT (Sigma‐Aldrich) and alkylated using 5.5 mM iodoacetamide (Sigma‐Aldrich). Proteins were separated by SDS-PAGE and digested in gel using trypsin (Promega) at 37 °C over night and the resulting peptide mixtures were processed on STAGE tips63.
Mass spectrometric measurements were performed on a LTQ Orbitrap XL mass spectrometer (Thermo Fisher Scientific, Bremen, Germany) coupled to an Agilent 1200 nanoflow‐HPLC (Agilent Technologies GmbH, Waldbronn, Germany). HPLC‐column tips (fused silica) with 75 μm inner diameter (New Objective, Woburn, MA, USA) were self-packed with Reprosil‐Pur 120 ODS‐3 (Dr. Maisch, Ammerbuch, Germany) to a length of 20 cm. Samples were applied directly onto the column without pre‐column. A gradient of A [0.5% acetic acid (high purity, LGC Promochem, Wesel, Germany) in water (HPLC gradient grade, Mallinckrodt Baker B.V., Deventer, Netherlands)] and B [0.5% acetic acid in 80% ACN (LC‐MS grade, Wako, Germany) in water] with increasing organic proportion was used for peptide separation (loading of sample with 2% B; separation ramp: from 10% to 30% B within 80 min). Theflow rate was 250 nl/min and for sample application 500 nl/min. The mass spectrometer was operated in the data‐dependent mode and switched automatically between MS (max. of 1 × 10⁶ions) and MS/MS. Each MS scan was followed by a maximum offive MS/MS scans in the linear ion trap using normalised collision energy of 35% and a target value of 5000. Parent ions with a charge state from z= 1 and unassigned charge states were excluded for fragmentation. The mass range for MS was m/z= 370 to 2000. The resolution was set to 60,000. Mass‐spectrometric parameters were as follows: spray voltage 2.3 kV; no sheath and auxiliary gasflow; ion‐transfer tube temperature 125 °C.
The MS raw datafiles were uploaded into the MaxQuant software version 1.4.1.264, which performs peak detection, label-free quantification, and generates
peak lists of mass error corrected peptides using the following parameters: carbamidomethylcysteine was set asfixed modification, methionine oxidation and