1. Materials
1,4-dicyanobenzene (DCB) and lithium bis(trifluoromethanesulfonyl)imide (LiTFSI) were purchased from Sigma Aldrich and TCI. The air-laid paper (AP, 45% polyester and 55% cellulose) was purchased from VWR. All the reagents and materials used directly without any further purification or modification.
2. Experimental procedures
CTF-LiF (65 mg, yield 50%) was synthesized by mixing DCB (100 mg, 1 equiv) and LiTFSI (336 mg, 1.5 equiv) in an ampoule (10 mL) inside the glove-box. For the LiF (15 mg, 49.6%), the same ampoule reaction was performed using only LiTFSI (336 mg). All the ampoules were evacuated and sealed at room temperature and transferred
into a box furnace and kept at 300 °C for 48 h (1 °C min–1 ramping). After cooling to
room temperature, the samples were taken out and washed with acetone, CH2Cl2 and
deionized water.
For the AP-CTF-LiF and AP-LiF, CTF-LiF or LiF were grounded in a mortar to form
a fine powder, added in acetone (40 mL, 2 mg mL–1) and sonicated for 1 h using a probe
sonicator. Afterwards, AP was immersed into the solution for 30 seconds and dried at 80 °C in the oven, and this immersion process was repeated 5-6 times to achieve the
loading of 0.2 mg cm–2. Lastly, AP-CTF-LiF and AP-LiF were punched to discs with
the diameter of 14 mm for electrochemical analysis.
3. Material characterizations
Powder X-ray diffraction (PXRD) analysis was performed for CTF-LiF and LiF
using Rigaku Ultima IV at 1° min–1 from 5–50°. Fourier transform infrared (FT-IR) was
conducted by using Bruker TENSOR II to reveal the bonding structure over the
wavelength range of 3500-600 cm–1. X-ray photoelectron spectroscopy (XPS) was
conducted to detect elemental state and composition by using PHI VersaProbe II scanning XPS microprobe (Physical Instruments AG, Germany) with a monochromatic Al Kα X-ray source. The morphology and energy-dispersive spectroscopy (EDS) were characterized by field emission scanning electron microscopy (FE-SEM, Tescan Mira3 LM FE). Elemental analysis (EA) was done by using FLASH 2000 Organic Elemental
2
magic angle spinning (MAS) solid-state nuclear magnetic resonance (ssNMR) was conducted by Bruker AV NEO 400 MHz NMR spectrometer with spinning frequency
of 5 kHz. N2 isotherms were measured using a 3Flex physisorption analyzer
(Micromeritics, USA) at 77 K.
4. Electrochemical characterizations
All of battery cells were assembled in a glove-box in the form of CR2032-type coin cells taking Celgard 2400 as separator. The electrolyte was 1 M LiTFSI in the mixture of 1,3-dioxolane (DOL) and 1,2-dimethoxyethane (DME) (1:1 by volume) with 2 wt%
LiNO3. The electrolyte amount of 60 µL was injected for each coin cell, and all battery
tests were done using a Land 2001A battery system.
For Li metal anode characterization, all batteries were first cycled at 50 µA in the
potential range of 0–1.5 V (versus Li+/Li) for 10 cycles to stabilize the interface. In
order to measure Coulombic efficiency (CE), the cells were assembled in a way that Cu foil (Ø 14 mm) on which AP, AP-CTF-LiF or AP-LiF disc (Ø 14 mm) was placed was used as the working electrode, and Li foil (Ø 16 mm) was used as the counter/reference electrode. In each cycle of this CE test, Li of a constant capacity was plated on the Cu side and then stripped at a constant current density until the potential reached the top cut-off of 1 V. All the CEs are averaged values in the given cycling range. Electrochemical impedance spectra (EIS) analysis was conducted by a Solartron impedance analyzer with an amplitude of 5 mV in the frequency range of 1 MHz to 50
mHz for the cells operated at 3 mA cm–2 with 1 mAh cm–2. For the overpotential test
with the symmetric cells, 1.5 mAh cm–2 of Li was first pre-deposited at 0.5 mA cm–2 to
the working electrode, and the cells were then cycled at 5 mA cm–2 for 0.2 h (1 mAh
cm–2) for each charge and discharge.
For the lithium-sulfur (Li-S) batteries, elemental sulfur was first melted into graphene (sulfur@graphene) at 155 °C for 12 h by weight ratio of 85:15. The cathode was then prepared by mixing sulfur@graphene, super-P and polyvinylidene difluoride (PVDF) in N-methyl-2-pyrrolidone (NMP) in weight ratio of 60:30:10. The areal
loading of sulfur was about 0.8 mg cm–2. For the Li electrode, 3 mAh cm–2 of Li was
5. Supporting figures and tables
Figure S1. XRD spectrum of CTF-LiF. The two sharp diffraction peaks at 38.7 ° and
45.0 ° are (111) and (200) crystal facets well-matched with LiF JCPDS 72-1538 diffraction card.
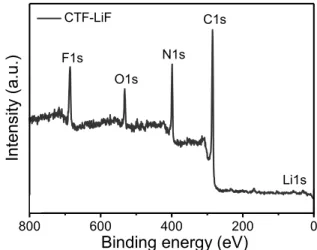
Figure S2. XPS survey spectrum of CTF-LiF
5 10 15 20 25 30 35 40 45 50 2 theta (degree) Int en sity (a.u.) LiF 800 600 400 200 0 Li1s C1s N1s F1s O1s CTF-LiF
Binding energy (eV)
Inte
nsity (
a.u.
4
Figure S3. 13C CP MAS solid-state NMR spectra of CTF-LiF. The signal at 170 ppm
is assigned to the carbon atoms of triazine ring, while the other strong signals at 138 and 130 ppm correspond to the phenyl ring. The signal at 115 ppm is attributed to nitrile group as well as the carbon atom of the phenyl ring attached to it.
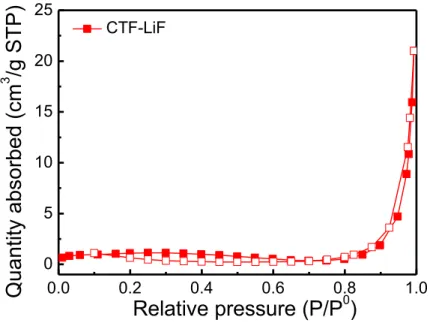
Figure S4. Nitrogen adsorption–desorption isotherms at 77 K of CTF-LiF.
2 1 3 4 5 6 1 2 3, 4 5, 6 0.0 0.2 0.4 0.6 0.8 1.0 0 5 10 15 20 25
Relative pressure (P/P
0)
Quanti
ty abs
orbed
(cm
3/g S
TP
)
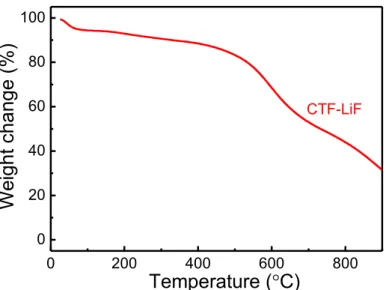
CTF-LiFFigure S5. TGA plot of CTF-LiF with ramping rate of 5 °C min−1 under air atmosphere.
Figure S6. XRD spectrum of LiF synthesized by pure LiTFSI at 300 °C for 48 h.
Figure S7. SEM images of LiF synthesized from LiTFSI at 300 °C for 48 h.
0 200 400 600 800 0 20 40 60 80 100 We ight change (% ) CTF-LiF Temperature (°C) 5 10 15 20 25 30 35 40 45 50 2 theta (degree) Int en sity (a.u. ) LiF
(a)
(b)
6
Table S1. EA and XPS analysis results of CTF-LiF. The theoretical elemental
composition of CTF-LiF was calculated based on the initial ratio between DCB and LiTFSI (1:1.5)
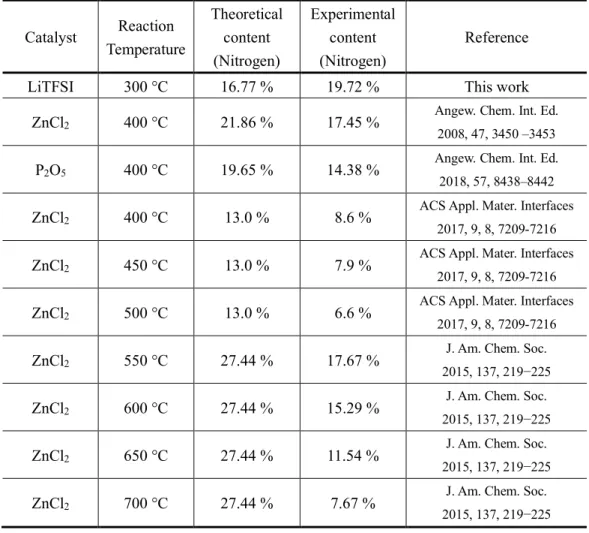
Table S2. Summary of reaction temperature vs nitrogen content in CTFs. Catalyst Reaction Temperature Theoretical content (Nitrogen) Experimental content (Nitrogen) Reference
LiTFSI 300 °C 16.77 % 19.72 % This work ZnCl2 400 °C 21.86 % 17.45 %
Angew. Chem. Int. Ed. 2008, 47, 3450 –3453
P2O5 400 °C 19.65 % 14.38 %
Angew. Chem. Int. Ed. 2018, 57, 8438–8442
ZnCl2 400 °C 13.0 % 8.6 %
ACS Appl. Mater. Interfaces 2017, 9, 8, 7209-7216
ZnCl2 450 °C 13.0 % 7.9 %
ACS Appl. Mater. Interfaces 2017, 9, 8, 7209-7216
ZnCl2 500 °C 13.0 % 6.6 %
ACS Appl. Mater. Interfaces 2017, 9, 8, 7209-7216
ZnCl2 550 °C 27.44 % 17.67 %
J. Am. Chem. Soc. 2015, 137, 219−225
ZnCl2 600 °C 27.44 % 15.29 %
J. Am. Chem. Soc. 2015, 137, 219−225
ZnCl2 650 °C 27.44 % 11.54 %
J. Am. Chem. Soc. 2015, 137, 219−225
ZnCl2 700 °C 27.44 % 7.67 %
J. Am. Chem. Soc. 2015, 137, 219−225
Technique C H N F Li Total
Theoretical (wt%) 57.52 2.41 16.77 17.06 6.23 100
EA (wt%) 54.57 2.09 19.72 - - 76.38
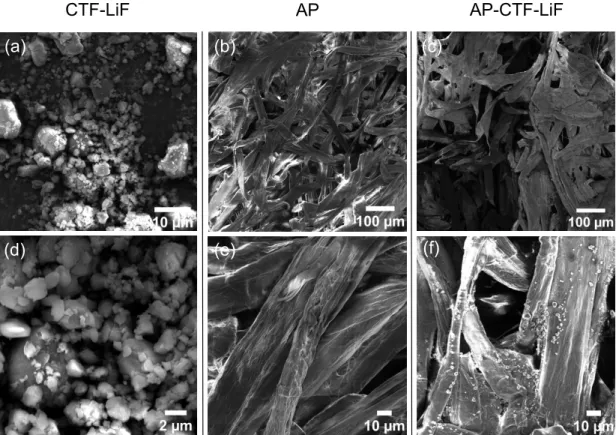
Figure S8. SEM images of CTF-LiF at magnification of (a) × 10 k and (d) × 30 k, AP
at magnification of (b) × 800 and (e) × 4 k, AP-CTF-LiF at magnification of (c) × 800 and (f) × 4 k.
Figure S9. SEM image of (a) CTF-LiF and its EDS elemental mappings with respect
to (b) nitrogen and (c) fluorine atoms.
CTF-LiF AP AP-CTF-LiF (a) (f) (c) (e) (d) (b)
N
F
(a) (b) (c)50 um
50 um
50 um
8
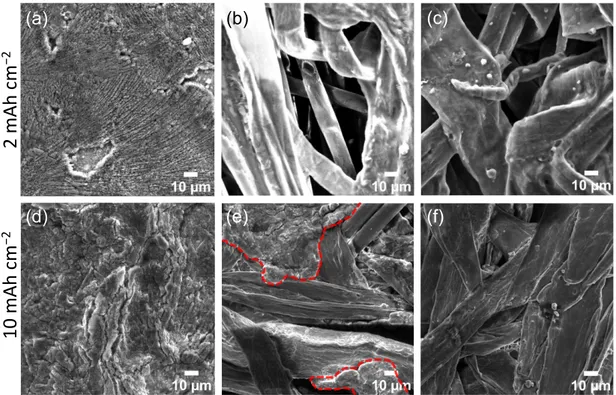
Figure S10. SEM images of (a) Cu, (b) AP and (c) AP-CTF-LiF after Li plating of 2
mAh cm–2, (d) Cu, (e) AP and (f) AP-CTF-LiF after Li plating of 10 mAh cm–2 at a
higher magnification (× 4 k).
Figure S11. Comparison of Li plating/stripping CE for bare Cu, AP and AP-CTF-LiF
electrodes when measured at 6 mA cm–2 with areal capacity of 3 mAh cm–2.
(b) (a) (d) (e) (f)
2 mAh
cm
−210 mAh
cm
−2 (c) 0 20 40 60 0 20 40 60 80 100 6 mA cm-2 3 mAh cm-2 AP-CTF-LiF AP CuCoul
omb
ic
eff
ic
iency
(%
)
Cycle number
Table S3. Summary of electrochemical performance comparison.
Sample Performance Reference
AP-CTF-LiF 10 mA cm
-2 1 mAh cm-2
220 cycles CE: 96.2% This work fCNT-PRPAA 4.5 mA cm -2 1 mAh cm-2 140 cycles CE: 97.6% Adv. Mater. 2019, 31, 1901645 RPC-stabilized Li anode 2 mA cm-2 4 mAh cm-2 300 cycles CE: 99.1% Nat. Mater. 2019, 18, 384–389 g-C3N4@Ni foam 1 mA cm -2 2 mAh cm-2 140 cycles CE: 97%
Adv. Energy Mater. 2019, 9, 1803186
3D Cu@Al 0.5 mA cm
-2 2 mAh cm-2 85 cycles CE: 98.6%
Angew. Chem. Int. Ed. 2019, 58, 1094 –1099
TiC/C 1 mA cm
-2 1 mAh cm-2 100 cycles CE: 98.5%
Adv. Energy Mater. 2018, 8, 1702322 Zircone Coatings 1 mA cm -2 0.5 mAh cm-2 80 cycles CE: 97.7 % DOI:10.1002/anie.20190775 9
Figure S12. Digital photographs of AP-CTF-LiF, AP-LiF and AP.
10
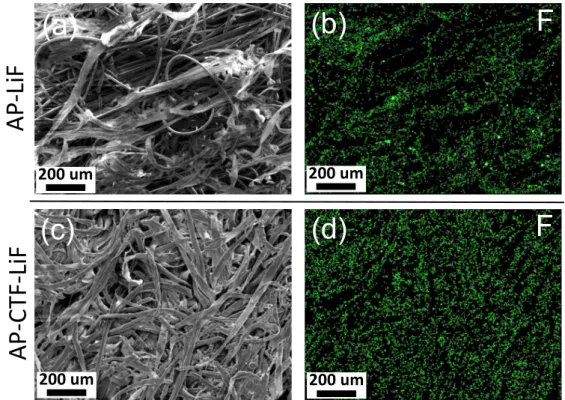
Figure S13. SEM images and EDS elemental mappings with respect to fluorine atom
of (a, b) AP- LiF and (c, d) AP-CTF-LiF.
Figure S14. CE of Li plating/stripping for AP-LiF electrode when measured at (a) 3
mA cm–2 with 1 mAh cm–2 and (b) 10 mA cm–2 with 1 mAh cm–2.
AP
-Li
F
F
F
AP
-C
TF
-Li
F
200 um 200 um 200 um 200 um(a)
(b)
(c)
(d)
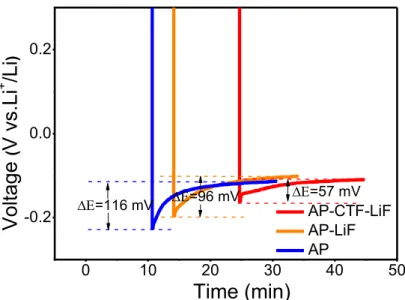
0 50 100 150 0 20 40 60 80 100 10 mA cm-2 1 mAh cm-2 Coul omb ic eff ic iency (% ) Cycle number 0 50 100 150 200 0 20 40 60 80 100 3 mA cm-2 1 mAh cm-2 Coul omb ic eff ic iency (% ) Cycle number (a) (b)Figure S15. Nucleation overpotentials of the cells with AP-CTF-LiF, AP-LiF and AP.
Figure S16. Charge-discharge profiles of the cells at 10 mA cm–2 with 1 mAh cm–2 Li
at (a) 1st cycle, (b) 10th cycle and (c) 50th cycle.
Figure S17. FT-IR spectra of AP, CTF-LiF, AP-CTF-LiF and AP-CTF-LiF after
0 10 20 30 40 50 -0.2 0.0 0.2 DE=57 mV DE=96 mV AP-CTF-LiF AP-LiF AP
Time (min)
Vol
tage
(V vs.
Li
+/Li
) DE=116 mV 0.0 0.2 0.4 0.6 0.8 1.0 -0.4 -0.3 0.3 0.4 AP-CTF-LiF AP-LiF AP Vol tag e (V v s. Li + /Li )Areal capacity (mAh cm-2)
1st 0.0 0.2 0.4 0.6 0.8 1.0 -0.4 -0.3 -0.2 0.2 0.3 0.4 AP-CTF-LiF AP-LiF AP 10th Vol tag e (V v s. Li + /Li )
Areal capacity (mAh cm-2)
0.0 0.2 0.4 0.6 0.8 1.0 -0.3 -0.2 0.2 0.3 AP-CTF-LiF AP-LiF AP 50th Vol tag e (V v s. Li + /Li )
Areal capacity (mAh cm-2)
(a) (b) (c)
3500 3000 2500 2000 1500 1000
AP-CTF-LiF after cycling AP-CTF-LiF Wavenumber (cm-1) Transmi ttan ce (%) CTF-LiF AP
12
Figure S18. EIS curves of (a) fresh cells with bare Cu, AP and AP-CTF-LiF and (b) the
same cells after 20 cycles at 3 mA cm–2 with 1 mAh cm–2.
Table S4. Fitting results to the equivalent circuit displayed in Figure S11.
Figure S19. (a) Cycling performance and CEs of Li-S cells with bare Cu, AP and
AP-CTF-LiF. (b) Galvanostatic discharge-charge profiles at 57th cycle for the three Li-S
cells. 0 20 40 60 0 20 40 60 Fresh cell R1 CPE1 R2 W1
Element Freedom Value Error Error % R1 Free(+) 5.368 0.092127 1.7162 CPE1-T Free(+) 2.2449E-05 3.3249E-06 14.811 CPE1-P Free(+) 0.76337 0.013842 1.8133 R2 Free(+) 35.33 0.7557 2.139 W1-R Free(+) 2.4888E08 1.1521E14 4.6291E07 W1-T Free(+) 2.0442E07 1.2247E13 5.9911E07 W1-P Free(+) 0.77264 0.01461 1.8909 Chi-Squared: 0.0092375
Weighted Sum of Squares: 1.0623
Data File: C:\Users\Administrator\Desktop\---ZTH---\eis\20190417\AP-CTFLIF-8-3.z Circuit Model File:
Mode: Run Fitting / Selected Points (0 - 60) Maximum Iterations: 100
Optimization Iterations: 0 Type of Fitting: Complex Type of Weighting: Calc-Modulus
Experimental Cu Fitting Cu Experimental AP Fitting AP Experimental AP-CTF-LiF Fitting AP-CTF-LiF -Z " ( ohm ) Z'(ohm) 0 20 40 60 0 20 40 60 R1 CPE1 R2 W1
Element Freedom Value Error Error % R1 Free(+) 5.368 0.092127 1.7162 CPE1-T Free(+) 2.2449E-05 3.3249E-06 14.811 CPE1-P Free(+) 0.76337 0.013842 1.8133 R2 Free(+) 35.33 0.7557 2.139 W1-R Free(+) 2.4888E08 1.1521E14 4.6291E07 W1-T Free(+) 2.0442E07 1.2247E13 5.9911E07 W1-P Free(+) 0.77264 0.01461 1.8909 Chi-Squared: 0.0092375
Weighted Sum of Squares: 1.0623
Data File: C:\Users\Administrator\Desktop\---ZTH---\eis\20190417\AP-CTFLIF-8-3.z Circuit Model File:
Mode: Run Fitting / Selected Points (0 - 60) Maximum Iterations: 100
Optimization Iterations: 0 Type of Fitting: Complex Type of Weighting: Calc-Modulus
Experimental Cu Fitting Cu Experimental AP Fitting AP Experimental AP-CTF-LiF Fitting AP-CTF-LiF -Z " ( ohm ) Z'(ohm) After 20 cycles (a) (b) 0 400 800 1200 1600 2000 1.8 2.0 2.2 2.4 2.6 2.8 Cu AP AP-CTF-LiF 57 th
Specific capacity (mAh g-1)
Vol tage ( V vs. Li + /Li ) 0 50 100 150 200 250 300 350 0 200 400 600 800 Cu AP AP-CTF-LiF Spe cific cap aci ty (mAh g -1 ) Cycle number 1C Cell died (57 th) 0 20 40 60 80 100 120 140 Co ulomb ic ef fic ienc y (% ) (a) (b)