HAL Id: hal-02565954
https://hal.archives-ouvertes.fr/hal-02565954
Submitted on 9 Nov 2020
HAL is a multi-disciplinary open access
archive for the deposit and dissemination of
sci-entific research documents, whether they are
pub-lished or not. The documents may come from
teaching and research institutions in France or
abroad, or from public or private research centers.
L’archive ouverte pluridisciplinaire HAL, est
destinée au dépôt et à la diffusion de documents
scientifiques de niveau recherche, publiés ou non,
émanant des établissements d’enseignement et de
recherche français ou étrangers, des laboratoires
publics ou privés.
Discovery of new members of the nearby young stellar
association in Cepheus
A. Klutsch, A. Frasca, P. Guillout, D. Montes, F. -X. Pineau, N. Grosso, B.
Stelzer
To cite this version:
A. Klutsch, A. Frasca, P. Guillout, D. Montes, F. -X. Pineau, et al.. Discovery of new members of
the nearby young stellar association in Cepheus. Astronomy and Astrophysics - A&A, EDP Sciences,
2020, �10.1051/0004-6361/201937216�. �hal-02565954�
March 24, 2020
Discovery of new members of the nearby young stellar association
in Cepheus
⋆
,⋆⋆
A. Klutsch
1, 2, 4, A. Frasca
2, P. Guillout
3, D. Montes
4, F.-X. Pineau
3, N. Grosso
5and B. Stelzer
1, 6 1Institut für Astronomie und Astrophysik, Eberhard Karls Universität, Sand 1, D-72076 Tübingen, Germany
2
INAF-Osservatorio Astrofisico di Catania, via S. Sofia 78, I-95123 Catania, Italy
3
Observatoire Astronomique, Université de Strasbourg & CNRS, UMR 7550, 11 rue de l’Université, F-67000 Strasbourg, France
4Departamento de Física de la Tierra y Astrofísica and UPARCOS-UCM (Unidad de Física de Partículas y del Cosmos de la UCM),
Facultad de Ciencias Físicas, Universidad Complutense de Madrid, E-28040 Madrid, Spain
5Aix Marseille Univ, CNRS, CNES, LAM, Marseille, France
6
INAF–Osservatorio Astronomico di Palermo, Piazza del Parlamento 1, I-90134 Palermo, Italy
Received 29 November 2019 / Accepted 07 March 2020
ABSTRACT
Context.
Young field stars are hardly distinguishable from older ones because their space motion rapidly mixes them with the stellar
population of the Galactic plane. Nevertheless, a careful target selection allows
for
young stars to be spotted throughout the sky.
Aims.
We aim to identify additional sources associated with the four young comoving stars that we discovered towards the
CO Cepheus void and to provide a comprehensive view of the Cepheus association.
Methods.
Based on multivariate analysis methods, we have built an extended sample of 193
young star candidates
, which are the
optical and infrared counterparts of ROSAT All-Sky Survey and XMM-Newton X-ray sources. From optical spectroscopic
observa-tions, we measured their radial velocity with the cross-correlation technique. We derived their atmospheric parameters and projected
rotational velocity with the code ROTFIT. We applied the subtraction of inactive templates to measure the lithium equivalent width,
from which we infer their lithium abundance and age. Finally, we studied their kinematics using the second Gaia data release.
Results.
Our sample is mainly composed of young
or
active stars and multiple systems. We identify two distinct populations of
young stars that are spatially and kinematically separated. Those with an age between 100 and 300 Myr are mostly projected towards
the Galactic plane. In contrast, 23 of the 37 sources younger than 30 Myr are located in the CO Cepheus void, and 21 of them
belong to the stellar kinematic group that we previously reported in this sky area. We report a total of 32 bona fide members and nine
candidates
for
this nearby (distance = 157 ± 10 pc) young (age = 10–20 Myr) stellar association. According to the spatial distribution
of its members, the original cluster is already dispersed and partially mixed with the local population of the Galactic plane.
Key words. Stars: pre-main sequence – Stars: fundamental parameters – Stars: kinematics and dynamics – X-rays: stars
1. Introduction
The “natural” birth sites of stars are young open clusters and
star-forming regions (SFRs) which are often tightly associated with
emission nebulae and molecular clouds (e.g., Piskunov et al.
2008; Zinnecker 2008). However young stars are also found in
wide regions around SFRs and also in the field, apparently
unre-lated to any of the known star-forming sites. Such populations of
young stars are composed of both classical T Tauri stars (CTTSs)
and weak-line T Tauri stars (WTTSs). There
is evidence
of
dif-Send offprint requests to: A. Klutsch
e-mail: klutsch@astro.uni-tuebingen.de
⋆
Based on observations collected at the Isaac Newton Telescope
(INT) operated on the island of La Palma by the Isaac Newton Group
in the Spanish Observatorio del Roque de Los Muchachos of the
In-stituto de Astrofísica de Canarias, the 2.2-m telescope of the
German-Spanish Astronomical Centre, Calar Alto (Almería, Spain), operated by
the Max-Planck-Institute for Astronomy, Heidelberg, jointly with the
Spanish National Commission for Astronomy, and the SOPHIE
spec-trograph on the 1.93-m telescope at Observatoire de Haute-Provence
(CNRS), France (program 09A.PNPS.GUIL).
⋆⋆
Tables 1 and 3–5 are available at the CDS via
anony-mous FTP to cdsarc.u-strasbg.fr (130.79.128.5) or via
http://cdsweb.u-strasbg.fr/cgi-bin/qcat?J/A+A/.
ferent space distributions for CTTSs and WTTSs, the
former
lo-cated
near the cloud cores while the latter are spread all around
the SFR (e.g., Alcala et al. 1997). Moreover, WTTSs are on
average older than CTTSs and have already dissipated their
ac-cretion disks (Bertout et al. 2007). These young stars may form
substructures that can be located up to tens of parsecs away from
the SFR’s core (e.g., Mapelli et al. 2015).
In the 1990s, various scenarios for explaining the presence
of dispersed young stars were proposed. For those located in the
outskirts of SFRs or in the space surrounding them, the simplest
explanation was that they had drifted by thermal velocity
disper-sion of gas within star-forming sites. On the other hand, those
far away from any conventional SFRs should have formed
lo-cally from cloudlets in turbulent giant molecular clouds
(Feigel-son 1996). However neither of these
theories could explain
the
presence of T Tauri stars (TTSs) with high space velocity, the
so-called “runaway” TTSs (Sterzik et al. 1995). Their ejection
could have occurred during the dynamical evolution of young
multiple systems and come from close encounters with other
members of their parent cloud (Sterzik & Durisen 1995, 1998;
Gorti & Bhatt 1996).
The picture of star formation in our Galaxy
is still not
well-defined
and new important details are being added by the recent
large spectroscopic surveys and astrometric space missions, such
as Gaia. One of the most relevant results of the Gaia-ESO
sur-vey (Gilmore et al. 2012; Randich et al. 2013) is the discovery
of two kinematically distinct populations (A and B) in the field
of both the Gamma Velorum (Jeffries et al. 2014) and NGC 2547
(Sacco et al. 2015) clusters. The properties of sources
belong-ing to Gamma Velorum B and NGC 2547 B are fairly similar in
terms of age and kinematics. Since these two clusters are close
to each other (≈ 6
◦on the sky corresponding to about 40 pc at
their distance) and
both are
in the field of the Vela OB2
asso-ciation, the B populations of these two clusters might form an
extended low-mass population in the Vela OB2 association.
Over the past two decades, several nearby (30–150 pc) young
(5–70 Myr) associations were identified, mostly in the
south-ern hemisphere (Zuckerman & Song 2004). Torres et al. (2006,
2008) found many of them and their members during the SACY
survey. The use of a Bayesian analysis and, subsequently, the
BANYAN Σ multivariate Bayesian algorithm contributed
signif-icantly to the continued identification of new members, mainly
low-mass stars and brown dwarfs (Malo et al. 2013; Gagné et al.
2014, 2015a,b, 2018a). The first release of the Gaia mission
(Gaia Collaboration et al. 2016) improved the astrometric
accu-racy for the Tycho sources. This has made it possible to search
for new comoving stars (Oh et al. 2017), as well as
stellar
kine-matic groups and clusters (Faherty et al. 2018; Gagné et al.
2018b). Based on the very accurate astrometry from the second
data release of the Gaia mission (Gaia DR2, Gaia Collaboration
et al. 2018), Gagné & Faherty (2018) discovered a considerable
number of likely new members in these young associations.
However, it remains difficult to recognize the young stars
without
a
circumstellar disk in the field among the Galactic plane
stellar population. Neither their global photometric properties
nor the presence of nearby gas differentiates them from older
stars. An efficient methodology for identifying the young stars
is through the use of large ray surveys because the stellar
X-ray sources in the ROSAT catalog are mainly stars younger than
1 Gyr (e.g., Motch et al. 1997a). Guillout et al. (1998a) showed
that this stellar population can be used as a tracer of young
lo-cal structures, like the late-type stellar population in the Gould
Belt (Guillout et al. 1998b). To this end, Guillout et al. (1999)
cross-correlated the ROSAT All-Sky Survey (RASS) with the
Tycho
catalog building the first large dataset (≈ 14, 000 objects)
of late-type stellar X-ray sources, the so-called RasTyc sample.
Spectroscopic surveys of northern RasTyc sources were
per-formed by Guillout et al. (2009, Paper I) and Frasca et al.
(2018, Paper III). In Paper I, we identified five young field
stars in the optically bright (V < 9.5 mag) sample. Afterwards,
BD+44 3670 and BD+45 598 were recognized as members of
the Columba association (∼30 Myr; Zuckerman et al. 2011) and
of the β Pic moving group (∼12 Myr; Moór et al. 2011),
respec-tively. Klutsch (2008) noticed that an almost uniform spatial
density of young stars in the optically bright RasTyc sample. At
the same time, the spatial density in the northern hemisphere
(Paper I) is about one order of magnitude lower, on average,
than that in the southern hemisphere (the SACY survey). This is
consistent with the significant asymmetry in the all-sky RasTyc
map with respect to the Galactic plane, as reported by Guillout
et al. (1998a), and is likely related to the structure of the Gould
Belt. A higher fraction of young stars was found in the optically
faint sample (Paper III). This may be due to the larger distances
involved, on average, in the faint survey, which
facilitated the
detection of
many more intrinsically brighter X-ray (more
ac-tive and younger) sources when compared to the bright sample.
A larger contribution from the Gould Belt, which is more distant
in the northern hemisphere, can also explain these differences.
Klutsch (2008) analyzed the early spectroscopic
observa-tions of optically faint RasTyc sources. This led to the discovery
of an over-density of stellar X-ray sources near the
Cepheus-Cassiopeia complex. We refer the reader to the reviews on SFRs
in the Cassiopeia and Cepheus constellations of Kun (2008) and
Kun et al. (2008), respectively. Although this sky area is rich
in CO molecular regions (Dame et al. 2001) and dark clouds
(Dobashi et al. 2005; Kiss et al. 2006), Guillout et al. (2010,
Pa-per II) identified four comoving TTSs towards a region devoid
of interstellar matter that is denoted as the fourth void in the
Cepheus Flare region by Kiss et al. (2006). Moreover, Tachihara
et al. (2005) had already reported the discovery of 16 WTTSs in
this region. In Paper III, we found four other likely members of
this group based on their spectral characteristics, position in the
HR diagram, and kinematic properties. The group 38 in Oh et al.
(2017) and Faherty et al. (2018) is composed of seven stars all
belonging to the young association analyzed in the present paper
and formerly discovered by our group (Klutsch 2008; Paper II),
which already included four of their seven stars; here, we extend
the census of this young association.
The main aim of the present work is to identify other young
stars surrounding the four comoving TTSs in Cepheus reported
in Paper II, and to characterize their physical and kinematic
properties, including the WTTSs provided by Tachihara et al.
(2005). In Sect. 2 we detail our procedure to build a sample of
“young star candidates”, based on the data available in 2009,
when it was created. We also describe our campaign of
opti-cal spectroscopic observations. Section 3 presents our analytiopti-cal
methods and results thereof. In Sect. 4 we mainly focus the
dis-cussion on the properties of the selected sources, on the spatial
distribution and kinematics of the young stars belonging to the
young association towards the CO Cepheus void, and on its
re-liability. Finally, we outline our conclusions and perspectives
in Sect. 5. We present the extraction of spectra with a double
Gaussian profile in Appendix A. We also provide further
infor-mation on multiple systems (Appendix B), low-mass stars
(Ap-pendix C), and a few specific targets (Ap(Ap-pendix D).
2. Sample and observations
2.1. Sample selection
The greatest difficulty in finding young stars in the field is the
selection of a suitable sample of candidates. The best manner
for identifying such a population is to excavate into an extensive
and comprehensive sample of stellar X-ray sources, such as the
RasTyc
sample (Guillout et al. 1999, Papers I and III).
To this end, we picked out all counterparts of the X-ray
sources by cross-matching the RASS catalog (Voges et al. 1999,
2000) with the Two Micron All-Sky Survey catalog (2MASS,
Skrutskie et al. 2006) using a likelihood ratio approach and an
original way to estimate the rate of spurious associations (Pineau
et al. 2008a,b, 2011; Pineau 2009). We discarded all the matches
having an angular separation larger than 15
′′and a probability
of identification less than 0.7. We then correlated the
remain-ing sources with the Guide Star Catalog II (GSC II, Lasker et al.
2008). We kept all the optical sources at an angular distance not
exceeding 5
′′from 2MASS sources and 15
′′from RASS ones.
We proceeded
in a similar way
for the XMM-Newton X-ray
sources of the 2XMMi catalog (Watson et al. 2009). This turned
out to be quite inconclusive because we only selected three stars.
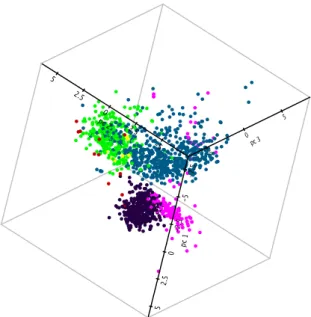
Fig. 1.
Result of the principal component analysis applied to RASS
X-ray sources. The 3D scatter plot displays the three first components,
adopting different colors for quasars (green dots), galaxies (blue dots),
and stars (other dots). Such a method optimizes the disentangling of
various classes of X-ray emitters. The pink dots
denote
the locus of a
priori young stars selected using our learning sample (see text).
However, we note that the source 1RXS 184257 (= [KP93] 2−43
in Kun & Prusti 1993), which is a well-known young visual
bi-nary, is part of the selection. That makes us confident in the
effectiveness of our approach, even for optically faint sources.
We then applied a multivariate analysis on these two X-ray
selected datasets. A principal component
analysis, which takes
measurements errors (Pineau et al. 2008b) on 19 parameters into
account, was used to build up linear combinations of flux
ra-tios from ray to near-infrared (NIR) wavelength domain,
X-ray hardness ratios, and color indexes. Applying a mean shift
procedure on the three first principal components, we were able
to disentangle the stellar population from the extragalactic
com-ponent (galaxies and quasars) that also emits X-rays (Fig. 1).
We followed the guidelines of Pineau et al. (2011) to identify
the local maximum of the population of well-known young stars
in this three-dimensional space. We therefore built a reliable
learning sample composed of sources whose object type is
ei-ther “young stellar object”, “T Tau-type star”, or
“pre-main-sequence star” in the Simbad database. We finally
labeled
all
the likely stellar X-ray sources located in the latter region as our
young star candidates. The objects are distributed all over the
sky.
This work is focused on the identification of young stars
to-wards the CO Cepheus void and its surroundings. Therefore, we
selected all the young stars located in a 30
◦-wide region
encom-passing the four comoving TTSs discovered in Paper II in that
region and we then restricted our sample to the population of
late-type (B–V > 0.5 mag) and faint (V > 9 mag) stars.
Rely-ing on the photometric distance estimate of the group (Paper II),
we retain all the candidates within 170 pc of the Sun and with
X-ray luminosity L
X>
10
29erg s
−1(Guillout et al. 1998b). This
X-ray emission threshold picks the majority of 1 Myr-old stars
with spectral type G and K (Preibisch et al. 2005). The choice
of these selection criteria and of this vast sky area allows us i) to
look for additional bona fide members both in a restricted region
around the Cepheus void and far away (i.e., to search for any
run-away WTTSs), and ii) to characterize the population of stellar
X-ray sources in an under-researched sky area. The 162 strongest
stellar X-ray sources, which are also a priori the youngest stars
selected, form our list of prime targets.
The low-resolution spectroscopic survey by Tachihara et al.
(2005) includes 14 sources common to our sample, as well as
one analyzed in Paper II (i.e., TYC 4500-1478-1). We decided
to add the remaining 31 stars from Tachihara et al. (2005) to
our sample, which leads to a total of 193 candidates. Table 1
lists their basic data, together with that of the eight young stars
reported in Papers II and III (labeled as G1–G4 and F1–F4,
re-spectively).
2.2. Photometric and astrometric data
The selection of young star candidates to be observed
spectro-scopically was performed before the launch of Gaia. At that
time, only two of the 193 pre-selected candidates had reliable
Hipparcos
parallaxes, while 102 sources,
which are
included
in the Tycho catalog (ESA 1997), had unreliable parallaxes and
proper motions with a fair accuracy. We therefore needed
multi-band photometric data (from optical to infrared wavelengths)
to select the young star candidates with the multivariate
anal-ysis described in Sect. 2.1. However, meanwhile, the Gaia DR2
catalog reports very accurate parallaxes and proper motions for
nearly all the sources investigated in the present paper, which
allows us to study their kinematics and evolutionary status.
Since we only selected stellar X-ray sources with a 2MASS
counterpart, their photometry in the NIR wavelength domain is
homogeneous. The J, H, and K
smagnitudes of the targets are in
the range 7–12 mag and have generally a high level of accuracy
(in more than 96 % of cases). For seven sources, at least one of
NIR magnitudes is an upper limit or a poor-quality value in the
final release of 2MASS data.
We encountered difficulties with the homogenization of
pho-tometry in optical bands. Indeed, when we started our target
selection, no catalog provided Johnson B and V magnitudes up
to V = 14.5 mag. The completeness of the Tycho-2 catalog
(Høg et al. 2000) is to about 90 % for sources brighter than
V ∼11.5 mag, although it also contains fainter stars. For the
non-Tycho sources fainter than V = 12 mag, only the
photo-graphic magnitudes were available and reliable. For the 102
sources with an entry in the Tycho-2 catalog, the V
Tmagnitude
ranges from 9 to 13 mag (Fig. 2). We converted the B
Tand
V
Tmagnitudes into Johnson B and V magnitudes following the
transformation given in the introduction of the Tycho-2 catalog:
B = B
T−
0.24(B
T−
V
T) and V = V
T−
0.09(B
T−
V
T).
For 79 of the remaining sources with both B
Jand R
Fpho-tographic magnitudes in the USNO-B1.0 catalog (Monet et al.
2003), we estimated the V magnitude using the formula
pro-posed by Lépine & Shara (2005): V = B
J−
0.46(B
J−
R
F).
We used the B
Jand R
Fmagnitudes extracted from the second
Palomar Observatory Sky Survey (POSS) scans in the IIIa-J and
IIIa-F passbands, respectively. All these sources are fainter than
V =
11 mag. Additional magnitudes in the Johnson B band were
retrieved either from the GSC II catalog or from the unpublished
Yellow-Blue 6 catalog (YB6 – USNO). The latter is available
through the NOMAD catalog (Zacharias et al. 2004).
In Table 1, we mainly list the B and V magnitudes in the
Johnson-Cousins system (∼88 % and ∼94 % of sources). If one
of these values are not available, we substitute them by the B
JFig. 2.
Distributions of V magnitude (
upper
panel)
and B–V color
index (lower panel) for our targets. The blue and red stripes correspond
to the Tycho and USNO-B1.0 magnitudes converted into the Johnson V
magnitudes based on the relations of Høg et al. (2000) and Lépine &
Shara (2005), respectively (see text for details). The white areas mark
the V photographic (GSC II or YB6) ones.
However, for the analysis of the spectral energy distribution
(Sect. 3.3) we have updated the magnitudes with more accurate
values of B and V retrieved from the AAVSO Photometric All
Sky Survey (APASS, Henden et al. 2015) catalog. The V
magni-tudes are also available in the TASS Mark IV patches
photomet-ric catalog (Droege et al. 2006). For most sources we retrieved
the I
Cmagnitudes from the TASS catalog or, if not available,
from the catalog of Gorbikov & Brosch (2014). In this way, the
dataset of the magnitudes is homogeneous and avoids a mixture
of photometric and photographic estimates. We found 177 (plus
three whose V magnitude is not provided) and 166 sources in
common with the APASS and TASS catalogs, respectively. The
different datasets are consistent with the V magnitudes in
Ta-ble 1, with a Pearson’s correlation coefficient (PCC) of ∼0.967.
We also
note
that the V magnitudes in APASS and TASS
cata-logs are fully consistent with each other (PCC ∼ 0.992). In the
case of the bright sources (V 6 13 mag), we obtained a good
agreement between the various magnitudes and the spread
in-creases towards the faintest objects, as expected in such a
com-parison. Regarding the faint objects (V > 13 mag), the V
magni-tudes in Table 1 tend to be overestimated by 0.5 mag. This
cor-responds to the typical accuracy of the Lépine & Shara (2005)
relation at this brightness, which might be subject to systematic
errors and other effects.
The photometric standard errors of the Tycho sources with
9 < V
T<
12 are typically 0.15 and 0.1 mag in B and V
pass-bands, respectively, while they are ∼0.25 mag in both bands for
the faintest sources. The tabulated errors of the GCS II sources
are ∼0.3 mag for the V magnitudes and ∼0.4 mag for both the B
and B
Jmagnitudes. The error on the optical magnitudes for the
sources fainter than V = 12 mag is considered to be at least of
0.5 mag. For our targets, the typical error for the APASS
pho-tometry is instead 0.05 mag.
Table 2.
Instrumental setup summary.
Telescope
Inst.
Spectra
Spectral region
λ/∆λ
INT 2.5-m
IDS
1D
5800–7200 Å
9,200
CAHA 2.2-m
FOCES
échelle
3800–10000 Å
28,000
OHP 1.93-m
SOPHIE
échelle
3872–6943 Å
39,000
Five of the six sources with a B–V color index below our
threshold of 0.5 mag come from the inclusion of the Tachihara
et al. (2005) sample. The use of APASS magnitudes leads to the
same statement for sources #176 and #178 only. Regarding the
remaining source (#102), its color index of 0.546 ± 0.276 mag in
the APASS catalog fulfills our initial selection criterion.
2.3. Observations and data reduction
To study the physical and kinematic properties of all these young
star candidates, we conducted observing campaigns using three
spectrographs (Table 2). We acquired both intermediate- and
high-resolution optical spectra, sharing our candidates in an
op-timized way, depending on their brightness.
We observed the brightest (V 6 12 mag) targets with two
in-strumental setups. From 26 to 27 September 2009, we used the
cross-dispersed échelle SOPHIE
1spectrograph (Perruchot et al.
2008; Bouchy et al. 2009) mounted on the 1.93-m telescope
of the Observatoire de Haute Provence (OHP, France). The
EEV-4482 detector is a thinned, back-illuminated, anti-reflection
coated 4k×2k 15-µm-pixel CCD cooled at −100
◦C, with
fast-readout mode. We chose the high-efficiency mode equipped with
a double-fiber scrambler to homogenize and stabilize the
illumi-nation of the spectrograph entrance. This allowed us to record
the 39 spectral orders covering effectively the wavelength range
3872–6943 Å, with a resolution of about 39,000 at 5500 Å. The
data were treated using the automatic data-reduction pipeline,
adapted from the HARPS software.
2From 2 to 5 October 2009 and on 12 December 2009, we
completed our survey of the bright targets. The échelle spectra
were taken with the
fibre optics Cassegrain échelle
spectro-graph
(FOCES, Pfeiffer et al. 1998) at the 2.2-m telescope of
the German-Spanish Calar Alto Observatory (CAHA, Sierra de
Los Filabres, Spain). We adopted the unique-fiber mode and
chose the Site#1d detector, a 2048×2048 24 µm-pixel CCD. We
used the configuration with the 400 µm-slit width, leading to a
resolution of about 28,000 and covering the wavelength range
from 3800 to 10000 Å, in a total of 100 orders. Using tasks of
the Echelle package within the IRAF environment, we reduced
the data following the standard steps of background subtraction,
division by a flat-field spectrum given by a halogen lamp,
wave-length calibration using the emission lines of the Th-Ar arc lamp,
and normalization to the continuum through a polynomial fit.
The optically faint candidates (12<V<14.5 mag) were
ob-served with the Intermediate Dispersion Spectrograph (IDS)
3at
the 2.5-m Isaac Newton Telescope (INT) of the Observatorio del
Roque de los Muchachos (La Palma, Canary Islands, Spain). We
acquired long-slit spectra during several observing runs that took
place in 4–10 September 2009, 23–28 November 2010, 24–27
October 2012, 27 March to 2 April 2013, 16–20 November 2013,
1
http://www.obs-hp.fr/guide/sophie/sophie-eng.shtml
2http://www.eso.org/sci/facilities/lasilla/instruments/harps/
3http://www.ing.iac.es/Astronomy/instruments/ids/
and 18–20 February 2014. During the observing night of 12 to
13 December 2009, some of our targets were also observed in
queue mode. We used a slit width of 0
′′.
95 and the H1800V
dis-persion grating with the 235 mm Camera (2148×4200 EEV10a
CCD detector until 2010 and 2k×4k RED+2 CCD detector since
2012) and with slow-readout mode. We chose the central
wave-length of 6500 Å. As the outer regions of the dispersed light
beam are severely vignetted by the camera optics, only 2070
of the pixels (roughly from pixel number 1000 to 3070 in the
direction of the dispersion) are clear and unvignetted regarding
the H1800V grating. This allows
for
efficient coverage of the
wavelength range 6200–6800 Å, with a resolving power of about
9200. For most of our targets and standard stars, we set the slit
position angle to the current parallactic angle. Using the typical
IRAF
tasks, all spectra were de-biased, flat-fielded,
distortion-corrected, wavelength calibrated (using the emission lines of the
Cu-Ar and Cu-Ne lamps), and finally normalized to the
contin-uum. When a source was already reported as a visual binary
in the literature or was identified as such during our observing
runs (i.e., with a small angular separation), we aligned the slit on
its position angle to simultaneously acquire the spectra of both
sources. In this way we made sure to observe the optical
counter-part(s) of the unresolved X-ray source. We subsequently
exam-ined whether or not the two stars form a physical binary system.
When their seeing profiles are partially overlapped on the CCD,
we extracted the two spectra by means of a IDL code similar to
that of Frasca et al. (1997), rather than the IRAF task APALL (see
Appendix A for details). The use of a double Gaussian profile
optimizes the spectrum extraction of the fainter source, which
may be heavily contaminated by the brighter one.
We removed the telluric water vapor lines only in the spectral
region around the Hα line of every spectrum, in all instrumental
setups. We applied a method similar to that described by Frasca
et al. (2000) using telluric templates taken with the same
instru-mentation as the targets. We show a few results for the case of
SOPHIE spectra (Fig. E.1) to illustrate its effectiveness.
Owing to bad weather conditions during our IDS observing
runs, we were unable to obtain a spectrum for 35 of our targets.
All the unobserved targets have a lower priority because their
Galactic latitude is higher than 25
◦or they were not classified as
WTTSs by Tachihara et al. (2005). Figure E.2 shows
the
spectra
acquired in the region around the Li i λ6707.8 lines.
3. Analysis and results
3.1. Radial velocity and multiplicity
We measured the heliocentric radial velocities (RVs) using the
cross-correlation technique. We distinguished spectroscopic
sys-tems from single stars (or single-lined binaries) based on the
number of peaks visible in the cross-correlation function (CCF).
Regarding
the
IDS data, we cross-correlated each long-slit
spectrum of our targets with that of RV-standard stars observed
during the same night. For this purpose, we have upgraded the
IDL
procedure described in Klutsch (2008) and Paper I. We
masked the spectral range around the Hα line because of its
strong wings and the possible chromospheric emission in the
core that can considerably broaden and distort the CCF peak.
For the same reason we discarded the spectral regions strongly
affected by telluric absorption lines. When only one CCF peak
was detected, the code performs an additional analysis to report
any asymmetry of the CCF profile, possibly interpreted as an
SB2 system observed near the conjunction. Such a procedure
is only relevant when the masses of the two stars differ
signifi-cantly. We computed the errors of the pixel shift from the center
of the Gaussian function fitting the CCF. We computed the RV
errors as a function of the fitted peak height and the
antisym-metric noise through the R factor, as described in Tonry & Davis
(1979).
For
the
FOCES data we derived the RV values with the IRAF
task FXCOR, by cross-correlating each échelle order of the
tar-get spectra with the corresponding one of the most similar
RV-standard star, which was acquired during the same run. We
dis-carded the orders heavily contaminated by telluric lines or those
including very broad lines and activity indicators, such as the
Ca ii H & K lines, the Balmer series (Hα and Hβ), and the Ca ii
IR triplet lines. We fitted the entire CCF peak with a Gaussian
to measure more precisely the RV values, which were obtained
as the weighted average of all the individual RV measurements
computed by FXCOR per each échelle order. The resulting RV
uncertainty is the standard error of the weighted mean, σ
RV.
The RV measurements derived from the target spectra
ac-quired with the SOPHIE spectrograph were performed with the
cross-correlation analysis that is included in the automatic
data-reduction pipeline developed by the OHP staff. We used the
most appropriate mask depending on the B–V color index (or
spectral type) of the target, among the five available ones. This
procedure failed for some of the multiple systems and fast
ro-tators. From a first guess of their spectral type (Sect. 3.2), we
selected the most appropriate synthetic spectrum from the
POL-LUX database (Palacios et al. 2010) to be used as template for
computing the CCF, which was automatically fitted by a
proce-dure similar to that used for IDS data. Taking advantage of the
high resolution of these spectra, we improved the code to
de-tect and fit the CCF peak of a companion even having a much
lower brightness in a stellar binary system,
that is, with a low
mass-ratio. This requires careful analysis of the CCF residues
after subtracting the best fit, especially when the two peaks are
severely blended (i.e., one CCF peak with an asymmetric shape).
Table 3 contains all our RV measurements and associated
errors, with one entry for each acquired spectrum and, in case of
multiple systems, for each component.
Since our IDL procedure and the task FXCOR use the
RV-standard stars as templates, we need an accurate RV value for
them. So we used the RV measurements available from the
Élodie archive,
4which were derived from high-resolution
spec-tra. Table E.1 lists all these values that agree with those in
Nide-ver et al. (2002)
or
other compilations of RV measurements (e.g.,
Gontcharov 2006; Kharchenko et al. 2007).
For multiple systems, we adopted an independent Gaussian
fit for each CCF peak whenever they are not blended (i.e., far
from the conjunctions). We used instead a multiple-Gaussian fit
algorithm when the spectral lines are partially blended.
More-over, we automatically looked for any significant peaks in the
CCF and fitted them with single, double, or multiple functions
(i.e., up to four Gaussian profiles), using our IDL code that
com-putes the CCF and treats the errors as FXCOR does. We refer the
reader to Paper I for details on this code and its performances.
Among the 47 sources observed at multiple epochs, eleven
sources display a large variation in radial velocity (Table 3). We
classified those with RV change significantly larger than the RV
errors as single-lined binaries (SB1) and those with smaller RV
variation as possible SB1 systems (SB1?). We discovered that
Fig. 3.
HR diagram of targets with known APs and parallaxes. The
symbols are color coded by log g derived from spectra (Sect. 3.2). The
four lithium-rich sub-giant or giant stars are enclosed in open squares
(Sect. 3.4). The evolutionary tracks from the ZAMS of Girardi et al.
(2000) are shown as solid lines with the labels representing their masses.
The dashed and dotted lines display the ZAMS with solar metallicity
(Z = 0.019) and Z = 0.001 by the same authors, respectively.
44 of the surveyed sources are multiple spectroscopic systems,
which are distributed as follow: nine SB1 (4.8 %), 28
double-lined (SB2) plus four likely SB2 (17.2 %), and three triple (SB3;
1.6 %) systems (see Table B.2). This corresponds to 20 % of
the overall sample (i.e., our targets, plus the 20 sources listed
in Table B.1 and the eight sources from Papers II and III) and
to 24 % of the sources with new observations presented here,
as listed in Table 3. For the 17 sources classified as possible
spectroscopic systems (Table B.2), additional observations are
needed to draw firm conclusions on their multiplicity.
3.2. Spectral classification and projected rotational velocity
We applied the IDL code ROTFIT (Frasca et al. 2006) to perform
the physical characterization of SB1 systems and single stars,
that is, those with only one peak in the CCF profile. This code
searches for the best combination of parameters by comparing
the target spectrum with reference star spectra that are
rotation-ally broadened until a minimum χ
2was reached. As in our
pre-vious works (Papers I and III), we determined the spectral type
(SpT), effective temperature (T
eff), gravity (log g), and
metallic-ity ([Fe/H]) using as templates a library of 270 high-resolution
spectra of low-activity and slowly rotating stars retrieved from
the Élodie archive (Moultaka et al. 2004). For these stars we
took the atmospheric parameters (APs) from the PASTEL
cat-alog (Soubiran et al. 2010). We report these results in Table 3
in which any source observed at several epochs
5has multiple
entries. The typical accuracy on the spectral type is about one
subclass. We refer the
reader
to Appendix C for a description
of our procedures dedicated to the analysis of the M-type stars.
To minimize possible effects on projected rotational
veloc-ities (v sin i) due to different resolutions and instrumental
se-tups between the target spectra (acquired with both IDS and
FOCES) and the Élodie ones we also used a smaller library of
5
whether with different instruments (usually for the bright sources) or
with the same instrumental setting (in case of the faint ones).
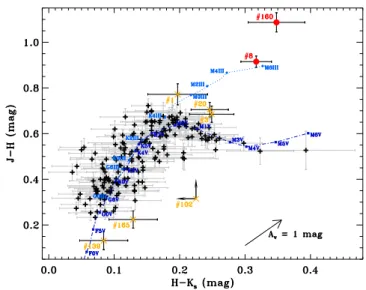
Fig. 4.
(H–Ks, J–H) color-color diagram of our targets. We also
display
the intrinsic color tracks of main-sequence (MS; dash-dotted
line) and giant (dotted line) stars from Bessell & Brett (1988), which
we converted into the 2MASS photometric system using the Carpenter
(2001) relation. Eight sources lie outside the locus of MS stars: two
sources likely suffering from extinction (red circles) and six sources
with possibly small extinction or poor-quality infrared magnitudes
(or-ange crosses). We also overplot their error bars, except for source #102
because its J and Ks
magnitudes are upper limits in 2MASS. The arrow
indicates the reddening vector for AV
=
1 mag. For a better readability,
the source #120 with H–Ks
= −0.152 ± 0.045 mag does not appear.
template spectra taken with these spectrographs during our
ob-serving runs. Table E.1 lists them as well as all their relevant
information. Analogous to the treatment of the full library of
Élodie templates, the rotation velocity of each template is
pro-gressively increased by convolving its spectrum with a rotational
profile of a given v sin i. The best match of the template spectrum
with the target spectrum, found by χ
2minimization, gives us the
value of v sin i. We
note
that most v sin i values derived with
the Élodie templates are slightly underestimated compared to
those obtained when the spectra are taken with the same
instru-mental setup. This is probably caused by the resampling of the
Élodie spectra on the points of the IDS or FOCES ones. We thus
adopted the v sin i values obtained with the template acquired
with the same spectrograph as the target (Table 3). At the IDS,
FOCES, and SOPHIE resolutions, any v sin i determination is
re-liable only if the v sin i value is larger than 15 km s
−1, 5 km s
−1,
and 2 km s
−1, respectively. We determined these lower limits
with simulations similar to those made by Frasca et al. (2015).
3.3. Stellar luminosity and extinction
We analyzed the spectral energy distribution (SED) of our targets
with the aim of checking the spectroscopic atmospheric
param-eters, of estimating the extinction, A
V, and of deriving the stellar
luminosities. The BVI
CJHK
sSEDs were constructed using the
optical and NIR photometric data described in Sect. 2.2. We
completed them with mid-infrared photometry provided by the
WISE All-Sky survey (Wright et al. 2010; Cutri et al. 2012).
Figure 3 shows the Hertzsprung-Russell (HR) diagram for
the targets with accurate parallaxes (Table 4) and APs derived
in the present study (Table 3). For 187 of our targets we made
use of the Gaia DR2 parallax, while we adopted the values of
Fig. 5.
Left panel: Li i λ6707.8 equivalent widths as a function of effective temperatures for our targets. Since each symbol results from the
analysis of a unique spectrum (Table 3), any source observed at multiple epochs is marked several times. The arrow symbols indicate the upper
limits on lithium equivalent width. The lines of different color and style mark the boundaries for three young clusters. Right panel:
lithium
abundances versus effective temperatures. We
disregard
the upper limits. In both panels, we
display
the
PMS-like
(big filled circles),
Pleiades-like
(filled squares), and older (filled diamonds) stars (see Sect. 3.4 for details). The four comoving TTSs towards the CO Cepheus void (Paper II)
and the additional members (Paper III) are highlighted with asterisks and crosses, respectively. For comparison, we also overplot the locus of the
sources belonging to two young (age = 12–30 Myr) associations listed by da Silva et al. (2009) with different small triangles.
18.4 ± 2.7 mas and 36.0 ± 6.9 mas for the sources #15 and #101,
respectively, as quoted in the URAT Parallax Catalog (Zacharias
et al. 2015; Finch & Zacharias 2016). No parallax is available for
the remaining four targets. Evidently, the values of log g found
by our spectroscopic analysis are fully consistent with the
evo-lutionary status in the HR diagram, demonstrating the reliability
of APs derived by ROTFIT (Sect. 3.2). Most targets are located
close to (or slightly above) the zero-age main sequence (ZAMS)
and show log g>3.5. These are good young star candidates. As
for the 16 sub-giant or giant stars, the X-ray emission can be
re-lated to their evolutionary status or to the presence of an unseen
companion, which forces the evolved star into fast rotation.
We adopted the grid of NextGen low-resolution synthetic
spectra, with log g in the range 3.5–5.0 and solar metallicity by
Hauschildt et al. (1999), to fit the optical-NIR portion (from B to
H
band) of the SEDs, in the same way as in Paper III. We fixed
T
effand log g of each target to the values found with ROTFIT
(Table 3) and let the angular stellar diameter and the extinction
A
Vvary until a minimum χ
2was reached. For the stars with a
known distance, this also provides us with a measure of the
stel-lar radius and luminosity that was obtained by integrating the
best-fit model spectrum. As listed in Table 4, we found low
ex-tinction values (A
V<
0.5 mag), with the exception of the more
distant targets, which are mostly sub-giant or giant stars.
In line with our selection criteria, most of our targets are
con-sistent with late-type stars near the main sequence (Fig. 3), with
no or low reddening (Table 4). These results fully agree with
the distribution of our targets in the infrared color-color diagram
(Fig. 4). We found nine sources that lie outside the locus of
main-sequence (MS) stars. For a better readability the source
#120 with H–K
s= −0.152 ± 0.045 mag is not shown. Sources
#8 and #160 likely suffer from extinction, as they lie at the
up-per right corner in the color-color diagram (J–H > 0.9 mag and
H–K
s>
0.3 mag). These color excesses E(J–H) and E(H–K
s)
allow us to estimate their extinction A
Vby means of the
mid-infrared extinction law of Wang & Chen (2019) and the standard
optical one R
V=
3.1. We classified the source #8 as a K5 giant
star with a temperature T
eff=
3833 ± 78 K and a surface gravity
log g = 2.84 ± 0.44, while its infrared colors place it near the
position of an M6 giant star, implying an extinction of ∼2 mag.
Moreover, this source is at least 2 mag fainter than giants having
a similar J–K
scolor index in the LSPM-North catalog (Lépine &
Shara 2005). This is consistent with a high reddening, as also
in-dicated by the SED analysis. Source #160 is a known member of
the L1251 cloud (Kun & Prusti 1993) and classified as a WTTS
with spectral type K5 (Kun et al. 2009), implying an extinction
of ∼3 mag. The other sources outside the locus of MS stars
in-clude two visual binary candidates (#102 and #120, see Table 5),
one spectroscopic system (#20), and four possible single stars
(#1, #3, #139, and #165).
We note
that the entire photometry of
the source #139 could be affected by the extended halo of light
of the nearby B5 binary V447 Cep (see Appendix D).
3.4. Lithium content and age
Lithium is a fragile element that is progressively depleted in the
deep convective envelopes of late-type stars where it is brought
at temperatures of about 3 × 10
6K. Therefore, the strength of
the Li i λ6707.8 Å line can be used as an age proxy for dwarfs
with spectral type later than mid-G; for these stars, a high lithium
abundance is a clear sign of youth (e.g., Soderblom et al. 1998).
In all instrumental setups used in this study, the lithium
line and the nearby Fe i λ6707.4 Å line are blended, at least
partly. However, when applying the spectral subtraction
tech-nique (see, e.g., Herbig 1985; Barden 1985; Frasca & Catalano
1994; Montes et al. 1995), this contamination is automatically
Fig. 6.
HR diagram of our targets with known APs and parallaxes. We
display the young stars selected as
PMS-like
(red circles) and
Pleiades-like
(orange squares) sources, along with the lithium-rich sub-giant or
giant stars (green symbols) and older (black diamonds) sources. The
pre-main-sequence evolutionary tracks of Siess et al. (2000) are shown
as solid lines with the labels representing their masses. The dashed lines
denote the isochrones at ages of 1, 3, 10, 30, and 300 Myr.
corrected because the best-fitted lithium-poor template, which
is rotationally broadened by ROTFIT to the v sin i of the target,
faithfully reproduces the spectral behavior around the lithium
line (Fig. E.2). We measured the Li i equivalent width, W
Li,
for the whole sample of single stars and SB1 systems (Table 3).
We then derived the lithium abundance, log N(Li), based on the
Pavlenko & Magazzu (1996) calculations.
Following the classification of Papers I and III, we defined
as
Pleiades-like
the stars lying between the lower and upper
en-velopes of the Pleiades cluster in the T
eff–W
Lidiagram (filled
squares in Fig. 5). Since the lower envelope of the Pleiades
nearly coincides with the upper envelope of the 300-Myr-old
UMa cluster (Soderblom et al. 1993b), the age of
Pleiades-like
objects should range between 100 and 300 Myr.
Analo-gously, we have considered as
PMS-like
the stars lying above
the Pleiades upper envelope (filled circles in Fig. 5).
In the literature, a significant scattering of log N(Li) was
found for stars belonging to the same cluster. This can be due to a
real age spread within the cluster or to further parameters
affect-ing the lithium depletion, such as stellar rotation (e.g., Jeffries
2017; Bouvier et al. 2018, and references therein). For a field
star, this prevents any direct conversion of log N(Li) into age.
However, a relative age estimate can be obtained by
compar-ing the position in the T
eff–log N(Li) diagram with that of stars
with a well-defined age and similar APs. We therefore overplot
the envelopes of clusters IC 2602, Pleiades, and Hyades (see,
e.g., Soderblom et al. 1993a,b; Jeffries 2000), along with the
lo-cus of known members of the β Pictoris and Tucana-Horologium
associations whose quoted ages are about 12 and 30 Myr,
respec-tively (da Silva et al. 2009). As a result, most
PMS-like
stars are
distributed similarly to the β Pictoris members and slightly above
those of the Tucana-Horologium association (Fig. 5).
We got an alternative estimate of the ages of our targets
by comparing their position in the HR diagram with
pre-main-sequence isochrones from Siess et al. (2000), as shown in Fig. 6.
Most
PMS-like
stars are located between the isochrones at 10
and 30 Myr, while six sources (#6 c2, #189, #191 c1 & c2, F3,
Fig. 7.
(U, V) plane of targets with astrometry and RV value
(Ta-ble 4). The solid line marks the separation between the young- (YD;
age < 2 Gyr) and old-disk (OD) populations in the solar neighborhood,
according to Eggen (1996). We
use
the same symbols as in Fig. 6.
F4) are found between the isochrones at 1 and 10 Myr (Fig. 6).
This agrees with the young age assumed in Paper II. In
con-trast, the
Pleiades-like
stars are mostly below the isochrone at
30 Myr. We are finally able to confirm that all the
PMS-like
and
Pleiades-like
sources are likely young stars, with the exception
of four sources (#109, #133, #159, #185 c1), which are likely
lithium-rich sub-giant or giant stars (Figs. 3 and 6).
3.5. Calculation of spatial-kinematic coordinates
To study the kinematics of our targets in the XYZUVW space,
we combined the average radial velocities derived in Sect. 3.1
with the sky positions, proper motions, and parallaxes reported
in Gaia DR2. For sources #15 and #101, we actually
de-rived their kinematics by making use of the sky positions from
the 2MASS catalog and the astrometry from the URAT
Paral-lax Catalog. We then computed the Galactic positions (X,Y,Z)
and heliocentric space-velocity components (U,V,W) in the
left-handed coordinate system.
6All these values are listed in Table 4.
As shown in Fig. 7, the (U,V) plane of targets with
astrom-etry and RV measurement (Table 4) shows that most
PMS-like
and
Pleiades-like
stars are located in the young-disk (YD)
pop-ulation in the solar neighborhood, according to Eggen (1996).
However we found three
PMS-like
(#35, #146, #185c1) and two
Pleiades-like
(#46, #109) in the region populated by old-disk
stars. While the sources #109 and #185c1 are Li-rich giant stars,
additional observations are needed to confirm any possible
vari-ation in radial velocities for the others. Our observvari-ations reveal
that the sources #35, #46, #109 are possible SB2 systems due
to a double-peaked Hα profile
or
their CCF shape (i.e., slightly
asymmetric or with a possible small peak below our detection
limit; Table 3). Regarding source #179, we do not exclude a
problem in the wavelength calibration. From our RV value of
−147.8 ± 0.8 km s
−1, this source might be located in the old-disk
6
X
and U are pointing towards the Galactic anti-center; Y and V in the
Galactic rotation direction; Z and W towards the North Galactic pole.
Fig. 8.
Distribution of our targets in Galactic coordinates (upper panels) and space-velocity components (middle panels), along with the diagram
of position versus velocity pointing in a given direction (lower panels). We restricted the parameter ranges on all diagrams to better see the
distribution of the youngest sources. We use the same symbols as in Fig. 6. In the middle panels, we also display the mean position of the IC 2391
(∼50 Myr) and Hyades (∼600 Myr) superclusters, Pleiades (∼100 Myr) and Castor (∼200 Myr) moving groups, and Ursa Major (UMa) group
(∼300 Myr). In the (U, V) plane, the solid line delimits the area of young- and old-disk populations in the solar neighborhood (Eggen 1996).
(OD) area. Thus this RV value must be used with care, especially
because this source is not a high-proper-motion star and its RV
value in Gaia DR2 is of −9.74±2.88 km s
−1, which we use
after-wards (Table 4). Finally, we note that the signal-to-noise of the
spectrum acquired for source #146 is not high enough to obtain
an accurate W
Livalue.
Figure 8 shows the distribution of our targets in various 2D
planes of the XYZUVW space restricting the parameter ranges
to the locus of the young sources. We used the probabilistic
ap-proach described in Klutsch et al. (2014) to assess their
member-ship to the five young stellar kinematic groups denoted in Fig. 8.
Their ages are adopted from Table 1 of Montes et al. (2001). In
the kinematic velocity space, the populations of
PMS-like
and
Pleiades-like
stars are located in well-distinguishable regions.
On the one hand, the heliocentric space-velocity components of
a compact group of
PMS-like
stars are marginally consistent
with those of the Castor moving group. Nevertheless, such a
link is hardly compatible because of the age difference between
these two groups of young stars, but above all because the
PMS-like
stars are only weakly dispersed in the XYZUVW space. On
the other hand, 75 % of the 12
Pleiades-like
single stars with an
RV
value in Table 4 have membership probability to the Pleiades
moving group larger than 40 %. These nine sources are #16, #22,
#102, #112, #123, #125, #129, #151, and #179. Our procedure
disregarded two sources (#31c2, #86) in the YD area due to a
space-velocity component W lower than −23 km s
−1, along with
source #46 located in the OD area (Fig. 7). These three sources
probably exhibit some variation in radial velocity.
4. Discussion
4.1. Properties of the sample
Our study confirms that the multivariate analysis
allows for the
optimization of
the disentangling of the stellar population from
X-ray emitting extragalactic components. In fact, only one (#99)
of the 162 sources is wrongly classified as a star due to a rather
singular spatial configuration of the different sources (Fig. D.3)
and the photometric properties of this galaxy that are similar to
late M-type stars (Appendix D). The main stellar populations in
our sample are young objects, multiple systems (Appendix B),
and low-mass stars (Appendix C). This latter group includes 36
M-type dwarfs (i.e., from M0 to M4.5; see Table C.1).
We selected young stars more efficiently than in our
previ-ous works. This may be linked to a sampling of more distant
sources in comparison to previous studies, as explained by the
Gould Disk scenario (Guillout et al. 1998b). It could also be
re-lated to the sky region considered here in which stars younger
than 30 Myr are found at three different distance scales: the
vi-sual binary V368 Cep and its comoving companion NLTT 56725
(∼20 pc; Makarov et al. 2007), the Cepheus association
(Ta-ble 6), and the Cepheus Flare region (Kun 2008; Kun et al. 2008).
We identified 59 lithium-rich sources. Most of them prove to
be young but four sub-giant or giant stars also display a strong
lithium line in absorption (Sect. 3.4). This is consistent with the
discovery of several lithium-rich giants from our previous
stud-ies of the stellar X-ray population (Papers I and III). We
clas-sified 18 targets as
Pleiades-like
sources (age = 100–300 Myr)
and 37 as PMS stars (age = 10–30 Myr). These two distinct
stel-lar populations are found in different sky areas (Fig. 9). While
the former are mainly located towards the Galactic plane, the
lat-ter are mostly projected in front of the CO Cepheus void, in the
Cepheus Flare region.
During our survey of 186 sources, we identified 44 (24 %)
spectroscopic multiple systems. This fraction is 30 % lower with
respect to Papers I and III. Nine and six of them also display
a strong and very strong lithium line (Table B.2), respectively.
Using Gaia DR2 data, we found that 40 of our targets and six of
eight young stars in Papers II and III have comoving companions
with an angular separation ranging from a few arcsecond to a few
arcmin (Table 5). Five of these visual binaries (#6, #18, #119,
#131, G4) also have one component classified as an SB2 system.
They are, therefore, likely hierarchical triple systems.
4.2. Young stars towards the CO Cepheus void
The possible detection of a new young association in Cepheus
(age = 10–20 Myr; Paper II) is supported by our identification
of 20 PMS stars (plus three small-separation companions
ob-served during our spectroscopic campaigns) in the same region
(Fig. 10) and our discovery of their eight comoving
compan-ions (Table 5). These are overplotted on the visible extinction
A
V,RQmap of Planck Collaboration et al. (2016),
7derived from
the thermal dust emission modeling presented by Draine & Li
(2007). The PMS stars are highly clumped near the Galactic
co-ordinates (X, Y, Z) = (76, 130, 43) pc (Fig. 8). To better see their
distribution, we zoomed in this smaller region (Fig. 11).
7
The map results from the renormalization of the visible extinction
one based on the analysis of quasi-stellar objects observed in the Sloan
Digital Sky Survey. This A
V,RQmap is available from the Planck Legacy
Archive (http://pla.esac.esa.int/pla/#home) and corresponds to the file:
COM_CompMap_Dust-DL07-AvMaps_2048_R2.00.fits[AV_RQ].
Fig. 9.
Spatial distribution of our targets, overplotted on the extinction
(A
v) map of Dobashi et al. (2005). In addition to the symbols defined in
Fig. 6, we denote the unobserved sources with crosses.
Table 6.
Properties of the three groups of PMS stars in Cepheus. We
give for each group the number of targets and their multiplicity.
Parameter Unit Cep I Cep II Cep III hli [◦] 122.31 ± 0.04 120.7 ± 2.0 118.7 ± 2.8
hbi [◦] 16.31 ± 0.14 16.37 ± 0.33 15.7 ± 1.7
hµαcos δi [mas yr−1] 23.88 ± 0.29 22.63 ± 0.25 20.35 ± 0.34
hµδi [mas yr−1] −3.11 ± 0.25 −0.31 ± 0.51 1.98 ± 0.49 hRVi [km s−1] −9.05 ± 0.24 −8.98 ± 0.3 −8.30 ± 0.43 hπi [mas] 6.713 ± 0.016 6.439 ± 0.054 6.044 ± 0.094 hTrigo. distancei [pc] 148.97 ± 0.36 155.7 ± 1.3 167.7 ± 2.9 hXi [pc] 76.43 ± 0.19 76.0 ± 0.5 75.9 ± 1.0 hYi [pc] 120.86 ± 0.29 128.5 ± 1.4 141.7 ± 2.7 hZi [pc] 41.75 ± 0.13 43.9 ± 0.4 45.1 ± 0.8 hU⊙i [km s−1] 7.90 ± 0.29 9.15 ± 0.28 9.99 ± 0.33 hV⊙i [km s−1] −16.08 ± 0.26 −15.54 ± 0.24 −14.02 ± 0.44 hW⊙i [km s−1] −5.43 ± 0.26 −5.70 ± 0.15 −5.42 ± 0.27 Age [Myr] 15 ± 5 15 ± 5 15 ± 5 Number of targets [sources]‡ 3 [7] 8 [14] 18 [29]
Fraction of systems 100 % 75 % 61 % Number of single stars 0 2 7 Number of SB1 systems 0 1 2 Number of visual binaries 1 3 7 Number of multiple systems 2 2 2
Note.‡We give for each group the number of targets listed in Table 1, while that
of resolved sources in the Gaia DR2 catalog (Tables 4 and 5) is bracketed.