HAL Id: hal-00176021
https://hal.archives-ouvertes.fr/hal-00176021
Submitted on 27 Jan 2021HAL is a multi-disciplinary open access archive for the deposit and dissemination of sci-entific research documents, whether they are pub-lished or not. The documents may come from teaching and research institutions in France or abroad, or from public or private research centers.
L’archive ouverte pluridisciplinaire HAL, est destinée au dépôt et à la diffusion de documents scientifiques de niveau recherche, publiés ou non, émanant des établissements d’enseignement et de recherche français ou étrangers, des laboratoires publics ou privés.
Accretion-ejection instability and QPO in black hole
binaries I. Observations
J. Rodriguez, P. Varnière, Michel Tagger, Ph. Durouchoux
To cite this version:
J. Rodriguez, P. Varnière, Michel Tagger, Ph. Durouchoux. Accretion-ejection instability and QPO in black hole binaries I. Observations. Astronomy and Astrophysics - A&A, EDP Sciences, 2002, 387, pp.487-496. �10.1051/0004-6361:20000524�. �hal-00176021�
A&A 387, 487–496 (2002) DOI: 10.1051/0004-6361:20000524 c ESO 2002
Astronomy
&
Astrophysics
Accretion-ejection instability and QPO in black hole binaries
I. Observations
J. Rodriguez, P. Varni`ere, M. Tagger, and Ph. Durouchoux
Service d’Astrophysique (CNRS URA 2052), CEA Saclay, 91191 Gif-sur-Yvette, France Received 23 May 2000 / Accepted 25 February 2002
Abstract. This is the first of two papers in which we address the physics of the low-frequency Quasi-Periodic
Oscillation (QPO) of X-ray binaries, in particular those hosting a black hole. We discuss and repeat the recent analysis and spectral modelling of the micro-quasar GRO J1655-40 by Sobczak et al. (2000, hereafter SMR), and compare it with GRS 1915+105; this leads us to confirm and analyze in more detail the different behavior noted by SMR, between GRO J1655-40 and other sources, when comparing the correlation between the QPO frequency and the disk inner radius. In a companion paper (Varni`ere et al. 2002, hereafter Paper II) we will show that these opposite behaviors can be explained in the context of the Accretion-Ejection Instability recently presented by Tagger & Pellat (1999). We thus propose that the difference between GRO J1655-40 and other sources comes from the fact that in the former, observed in a very high state, the disk inner radius always stays close to the Last Stable Orbit. In the course of this analysis, we also indicate interesting differences between the source properties, when the spectral fits give an anomalously low inner disk radius. This might indicate the presence of a spiral shock or a hot point in the disk.
Key words. accretion, accretion disks – X-rays: binaries – stars: individual: GRS 1915+105, GRO J1655-40
1. Introduction
The observation of Quasi-Periodic Oscillations (QPOs) in X-ray binaries is widely considered as a key to under-standing the physics of the inner region of accretion disks around compact objects. Although the origin of the QPOs is still debated, it is considered that such models should yield information of prime importance on the physics and the geometry of the accretion process, in these and other accreting sources. In particular, in the last years, many observational results have pointed to the importance of a low-frequency QPO, found in binaries hosting neutron stars or black holes. A recent result, reported by Psaltis et al. (1999), shows that in these sources its frequency is correlated with that of a higher-frequency QPO (in neutron-star binaries, this is the lower of the pair of so-called “kHz QPOs”), believed to be close to the rotation frequency at the inner edge of the disk. Thus the frequency of this QPO ranges from <∼1 to a few tens of Hz in black-hole and neutron-star binaries. It has been intensively studied, in particular, in the micro-quasar GRS 1915+105, where its occurrence in the low-hard state is so frequent that it has been dubbed the “ubiquitous” QPO (Swank et al. 1997; Markwardt et al. 1999, hereafter SM97 for both these references). These studies have allowed SM97 Send offprint requests to: J. Rodriguez,
e-mail: [email protected]
and Muno et al. (1999) to find a number of correlations, showing that the QPO probably has its origin in the disk, although it affects more strongly the coronal emission.
One of these correlations involves the QPO frequency and the color radius of the disk rcol, considered as a
mea-sure of the disk inner radius rint. Even though this is not
a very tight correlation, it would mean that the QPO fre-quency would most often correspond to a Keplerian rota-tion frequency in the disk, at a radius of a few times (typi-cally∼2 to ∼5) rint; this is consistent with the correlation
of Psaltis et al. (1999), where the high-frequency to low-frequency ratio is about 11, assuming, as usually believed, that the high-frequency QPO is close to the Keplerian fre-quency at the inner edge of the disk.
However these observational results must be taken with extreme caution: rcol is obtained from a fit of the
source spectrum with a model, and the results of the fit raise many questions:
1. The model spectrum consists of a multi-color black-body part, thought to originate in an optically thick disk, and a power-law tail at higher energies, consid-ered as inverse Compton emission from a hot corona which might lie either above the disk, or in the re-gion between the disk and the central object. We will call them, for simplicity, the disk and coronal emis-sions respectively. However in the low-hard state where
the low-frequency QPO is most often seen, the coro-nal emission often dominates the disk one, even at low energies. In this case the extraction of the disk param-eters becomes difficult.
2. Indeed the fits often give values of rcol which must
clearly be ruled out, since they are extremely low and sometimes even within the Schwarzschild radius. 3. In a recent paper Merloni et al. (2000, hereafter MFR)
have shown that other effects, associated with the ver-tical structure of the disk, could strongly affect the determination of the disk parameters. Using synthetic spectra to test the fitting algorithm, they find that the disk black body model underestimates the radius by a factor which may be quite large, when the coronal emission dominates the disk emission. This makes the extraction of disk parameters difficult, since we have little information on the conditions causing this effect. 4. Even when the disk emission is strong enough to allow a reliable fit, the model spectrum contains assump-tions which may affect the outcome. In particular the disk is assumed to be axisymmetric with a tempera-ture varying as T−3/4, following the standard α-disk model. These are strong assumptions which may af-fect the validity of the fit parameters. However, since the RXTE/PCA data starts above 2 keV, the obser-vations are not very sensitive to the whole structure of the disk itself. On the other hand, various corrections (e.g. due to electron scattering) must be applied. One can only expect that, when the assumptions are not too far from reality, there is a proportionality between the color radius rcoland the disk inner radius rint.
Points (1–3) above thus lead us to take with extreme cau-tion, or rule out, determinations of the disk parameters when the ratio of the disk black body flux (determined from the fit) is less than about half of the total flux. We will see below that indeed, among the data points we ob-tain for GRO J1655-40, all the ones giving anomalously low values of rcol are excluded if this criterion is applied.
On the other hand point (4) above is much more difficult to address, as long as we have no observational tests of the disk structure. Determining the nature of the QPO would be very likely to shed light on this, but this also depends on our knowledge of the disk parameters.
Recently SMR have analyzed observations of the micro-quasar GRO J1655-40, and found that in this source the low-frequency QPO differed markedly from other sources, in particular XTE J1550-564: the color radius was found to be quite small (down to a few kms), and to increase with the QPO frequency. On the contrary in XTE J1550-564, and in most observations of other sources, the color radius and the QPO frequency are inversely correlated.
In this paper our goal is to check this reversed corre-lation which (as will be seen in Paper II) might be consis-tent with the explanation of this QPO by the Accretion-Ejection Instability (AEI) recently presented in Tagger & Pellat (1999). It would be due to relativistic effects,
when the disk inner radius approaches the Last Stable Orbit. Thus we begin in Sect. 2.1 by reconsidering the data points from GRO J1655-40 presented by SMR, re-peating the whole data reduction and fitting process; we discuss them in regard to the criterion of MFR, which we take as a guide for the validity of the fitting procedure. This results in excluding all the points at anomalously low radius values, and retaining points only in a limited radial range. We then turn to the other source studied by SMR, XTE J1550-564, but the criterion of MFR leads us to exclude almost the whole data set: the source was at the time of the study in an extremely bright high soft state/ very high outburst state. We thus chose to study a different source, GRS 1915+105, because its high vari-ability and the large number of observations including the low frequency QPO suggested that we could explore the radius-frequency correlation over a much broader range of values for rcol. In particular the observations of SM97
showed that, during the much studied 30 min cycle of that source, both νQPO (the QPO frequency) and rcol vary by
a large factor, and apparently in opposite directions. The choice of this particular observation was driven also by the existence of a multiwavelength campaign (Mirabel et al. 1998), that could allow a richer discussion between QPOs, disk instabilities and ejections of plasma, since several au-thors have now linked the changes of luminosity to disk instabilities (e.g. Feroci et al. 1999; Fender et al. 2002, and references therein). We have thus analyzed two such cy-cles, essentially repeating the analysis of SM97 and turn-ing our attention to the frequency-radius correlation.
We will present the observations of GRO J1655-40 and GRS 1915+105 in Sects. 2.1 and 2.2 respectively. We will then in Sect. 2.3 discuss and compare the results, which will be then be confronted with a theoretical model in Paper II. We will also discuss the different behaviors ob-served when the disk color radius takes anomalously small values, leading to a discussion of disk properties and to a possible explanation for these very small values.
2. Data reduction and analysis
2.1. GRO J1655−40
GRO J1655-40 (Nova Scorpii 1994) was discovered in 1994 by the Burst and Transient Source Experiment (BATSE) (Wilson et al. 1994). Its optical counterpart was discov-ered in 1995 (Bailyn et al. 1995), and the orbital param-eters gave a primary mass of 7.02± 0.22 M (Orosz & Bailyn 1997; van der Hooft et al. 1998), placing it well above the 3 M maximum mass for neutron stars. Its dis-tance is estimated at 3.2± 0.2 kpc (Hjellming & Rupen 1995), with an inclination angle∼69.5◦. GRO J1655-40 is also known as one of the few galactic microquasars, since radio observations show two extended radio lobes with su-perluminal motions (Hjellming & Rupen 1995). In order to be able to compare directly the results on the disk color radius with the ones presented below for GRS 1915+105, we have re-done the data reduction and analysis of the
J. Rodriguez et al.: AEI and QPO in BH binaries. I. 489
RXTE/ASM (1.2 - 12 keV) BATSE (20 - 100 keV)
Fig. 1. GRO J1655-40 light curves during 1996, obtained at
high energies with BATSE (20−100 keV) and at lower ones with the RXTE All Sky Monitor (1.2−12 keV). Arrows show the dates where low-frequency QPO were observed.
series of twelve public observations (AO1) of GRO J1655-40 during its 1996 outburst (see Fig. 1), already presented by SMR, when QPO were observed. Figure 1 shows the BATSE and RXTE ASM light curves during that period, and the dates where QPO were observed. Table 1 gives the corresponding disk parameters.
For our analysis the RXTE spectra were obtained us-ing only the Proportional Counter Array (hereafter PCA). We used the standard 2 data only when the offset point-ing was less than 0.02◦and the elevation angle above 10◦; in almost all cases all the PCU were “on” during the ob-servation, but we chose to use only the spectra extracted from PCU 0 and 1 separately, and then fit them together in XSPEC. Given the high flux of the source this allows us to get sufficient statistics while limiting the effects associated with the various PCUs. The data reduction/extraction was made following the standard RXTE data reduction. In order to compare precisely with the results of SMR, we have used FTOOLS package 4.1, but checked that pack-age 5.0 gave nearly identical results.
We first generated spectra using all the PCU layers, which gives a higher count rate, and then extracted spec-tra only from the top layer; the fits parameters deduced with the two methods presented no significant differences, and since there was, for this source, no particular need to get the highest count rate (the source was sufficiently bright, and the exposure sufficiently long that the data had small statistical errors), the results presented here are obtained with the later method. The background was esti-mated using the PCABACKEST tool version 2.1, and we chose to ignore channel energies bellow 2.5 keV, and above 20 keV, in order to use the best detector energy band (choosing this band, we avoided the uncertainties due to the response matrix at lower and higher energies, and the problems due to background subtraction near 25 keV – see also SMR); we then added a systematic error of 1.5% on each data point. The response matrices were generated
using the PCARSP tool version 2.38, and we deadtime cor-rect the spectra following the RXTE cook book method. The spectral fits were obtained using XSPEC version 10., using the multicolor disk blackbody model with a power law tail at higher energy, and a hydrogen column absorp-tion fixed at NH= 0.9× 1022 cm−2 as found with ASCA
(Zhang et al. 1997a). We have found that no other contri-butions to the spectrum (e.g. iron line) needed to be in-troduced in the fit, giving results consistent with those of SMR while reducing the number of fit parameters. On the other hand, since there is little uncertainty on the QPO centroid frequencies, we have not re-done the power spec-tra analysis, and we use here the frequency values given by SMR.
Table 1 shows the results of our fits. Column 7 shows the ratio (Disk black body flux/total flux) which, accord-ing to MFR, we will first use to discriminate between two different spectral states of the source. For our purpose, the total flux is obtained by extrapolating the spectra to 50 keV. Table 1 shows that the observations clearly come in two categories: one where the ratio Disk black body flux/total flux is lower than .5, so that according to the criterion of MFR the disk radius value should be consid-ered as unreliable, and where indeed the radius is always unrealistically low; and one where the ratio is higher than .5 and where the obtained radius appears to be more trust-worthy: it lies in the range we expect for a disk around a black hole, and gives more consistent values.
Figure 2 shows the spectra for the first two obser-vations, typical of these two behaviors: on July 25 the disk emission dominates at low energy, allowing a sat-isfying spectral fit. On August 1 the coronal emission dominates at all energies, and results in an unreliable fit. Figure 3 is the resulting plot, for the data points we retain, of the QPO centroid frequency versus the disk color radius, where rcol is given in km, with R? =
((rcol/km)/(D/10 kpc))2cos θ R? being the XSPEC
di-mensionless parameter. Comparing with Fig. 2 of SMR, we note that the points we exclude correspond to higher temperatures and lower disk flux. It is quite remarkable that they are also the observations where a higher fre-quency QPO is simultaneously observed. This might con-firm that indeed the disk is in a different state in the obser-vations we retain and the ones we reject, but we will not attempt to explore an explanation, which would clearly require reaching a much better understanding of the disk behavior than our present one – although in our discussion we will contrast this with the behavior of GRS 1915+105. On the other hand, with the data points we retain, we confirm the general tendency noted by SMR that, con-trary to other sources, the QPO frequency increases with increasing disk radius in GRO J1655-40.
2.2. GRS 1915 +105
We thus turn to the microquasar GRS 1915+105. This source has been the object of very frequent observations,
Channel Energy (keV)
Normalized Count/s/keV
July 25 1996 August 01 1996
Channel Energy (keV)
Normalized Count/s/keV
Fig. 2. Spectral fits for the first two observations of GRO J1655-40. On July 27 the black-body part dominates at low energy,
allowing a satisfying extraction of disk parameters. On August 1 the coronal part dominates at all energies. The plots show (top curve) a superposition of spectra from PCU’s 0 & 1, and (lower curves) the spectral components (multicolor black body and power-law tail) obtained from the fit. The X axis is in keV, and the Y axis is in counts/sec/keV.
Table 1. Best fit parameters for the observations of GRO J1655-40. R? = ((R
col/km)/(D/10 kpc))2cos θ, where θ is the inclination angle. Powerlaw normalization is in unit of photon/cm2/s at 1 keV.
# Date Tcol (keV) Rcol α Powerlaw Ratio χ2ν(91 d.o.f.)
1 07-25-96 1.272± 3.6 × 10⁻³ 20.62± 0.15 2.589± 0.022 15.93± 0.98 0.64 0.69 2 08-01-96 1.63± 1.4 × 10⁻² 8.41± 0.28 2.49± 0.012 50.68± 1.78 0.21 0.76 3 08-06-96 1.53± 8.7 × 10⁻³ 10.90± 0.23 2.65± 0.013 47.93± 1.856 0.31 0.7 4 08-15-96 1.247± 3.7 × 10⁻³ 20.69± 0.15 2.56± 0.024 13.58± 0.9 0.65 0.98 5 08-16-96 1.27± 6.6 × 10⁻³ 16.88± 0.27 2.59± 0.016 34.40± 1.578 0.36 0.82 6 08-22-96 1.25± 5 × 10⁻³ 19.10± 0.20 2.6± 0.017 26.79± 1.26 0.47 0.62 7 08-29-96 1.59± 1.2 × 10⁻² 9.41± 0.27 2.54± 0.013 50.28± 1.86 0.24 0.68 8 09-04-96 1.25± 4 × 10⁻³ 20.56± 0.17 2.61± 0.02 19.50± 1.0 0.59 0.72 9 09-20-96 1.23± 3.6 × 10⁻³ 21.10± 0.14 2.49± 0.023 9.94± 0.65 0.69 0.7 10 10-15-96 1.29± 3.5 × 10⁻³ 20.80± 0.13 2.36± 0.028 7.098± 0.56 0.74 0.6 11 10-22-96 1.28± 3.5 × 10⁻³ 21.13± 0.13 2.48± 0.025 10.79± 0.76 0.70 0.62 12 10-27-96 1.32± 5 × 10⁻³ 17.84± 0.21 2.64± 0.017 34.31± 1.66 0.46 0.7 many of them showing the low-frequency QPO and strong
variability. In particular, the very exhaustive analysis of Muno et al. (1999) shows the QPO, in different spectral states, and over a large range of frequencies. Furthermore, SM97 had shown that, during the ∼30 min cycles of GRS 1915+105, the QPO could be tracked at a varying frequency, together with a color radius varying by a factor ∼5, during the “low and hard” part of the cycle. These cycles have been extensively studied; multiwavelength ob-servations (Mirabel et al. 1998; see also Chaty 1998) have shown them to be associated with supra-luminal ejections, and they turn out to be the most frequent type of behav-ior of that source after the steady ones (Muno et al. 1999; Belloni et al. 2000). Observing the correlated changes of radius and QPO frequency during such events may limit the influence of other effects, such as the mass accre-tion rate etc., and provide a way to analyze the disk his-tory during such events. This could then complement the
analysis of Belloni et al. (2000), based only on color-color diagrams.
Figure 4 shows three consecutive cycles observed by RXTE on 1997 Sep. 9. The first cycle is the one shown in detail by SM97, while the second cycle was the ob-ject of the multiwavelength observations of Mirabel et al. (1998). We have thus chosen to analyze these two consec-utive cycles: we repeat the analysis of SM97 for the first cycle, using for the spectral fits and color radius deriva-tion the same procedure as for GRO J1655-40. In order to confirm the results we obtain, we repeat the same anal-ysis for the following cycle. We have also made a rapid analysis showing that the same behavior is observed dur-ing the third cycle. We treat only the time interval over which the QPO was observed by SM97, i.e. starting near the transition from the high/soft to the low/hard state, and ending at the intermediate peak halfway through the low state. At that time the QPO disappears, and the
J. Rodriguez et al.: AEI and QPO in BH binaries. I. 491 18,5 1 9 19,5 2 0 20,5 2 1 21,5 2 2 22,5 20,2 20,4 20,6 20,8 2 1 21,2 rc o l www w Q P O
Fig. 3. Plot of νQP O vs. rcol for GRO J1655-40. X axis is in km, Y axis is in Hz.
Relative Time (s)
Fig. 4. Lightcurve of GRS 1915+105 during the whole
obser-vation of 1997 Sep. 9. X axis is in seconds since the beginning of the observation, Y range is in count/s.
power-law emission decreases dramatically (Mirabel et al. 1998; Chaty 1998).
2.2.1. Spectral analysis
Our goal was to track the variations of the QPO frequency and of the disk color radius, while they vary rather rapidly. We thus reduced the time interval over which the spectral fit and the QPO frequency determination were obtained, to the minimal value compatible with sufficient statistics. We used the standard 2 data accumulated over 16s in-tervals; although the source occasionally varies on shorter time scales, we have checked that this does not affect the results we present. Due to the poorness of the statistics, we extracted spectra from all available PCU (though only PCU 0 to 3 were “on” during the whole observation), and all layers to get the most possible incoming flux. The spec-tra, after dead time correction and background correction, were first fitted, as for GRO J1655-40, between 2.5 and 20 keV in XSPEC with the standard model consisting of
a multicolor disk blackbody and a power law tail at higher energy, taking into account a low energy absorption with NH fixed at 5.7× 1022 cm−2 (Markwardt et al. 1999).
The fits were not satisfactory, with an average reduced χ square∼2.5. An analysis of the residual showed a large difference between the spectra and the model used around 6 keV, so that in a second pass we added to the model an iron emission line, with centroid energy found at∼5.9 keV. As for GRO J1655-40, the coronal emission dominates the light curve in some observations. We thus choose the following procedure: we distinguish in the observations a high state and a low state; the latter is defined by the com-bination of a low temperature (<∼1 keV) and a large ra-dius. In this state, the coronal contribution dominates but the correction of MFR (which was derived for high states) should not apply, and the color radius is much larger than at other times, so that we retain these points – which correspond to most of the intervals where the QPO was present. In the high state on the other hand, the radius is much lower and we apply the same criterion as above, retaining only data points where the black-body contri-bution exceeds half of the total (extrapolated to 50 keV), although we find that in general the radius values for the rejected points are more consistent than in GRO J1655-40. The resulting parameters and classification are presented in Table 2.
2.2.2. Temporal analysis
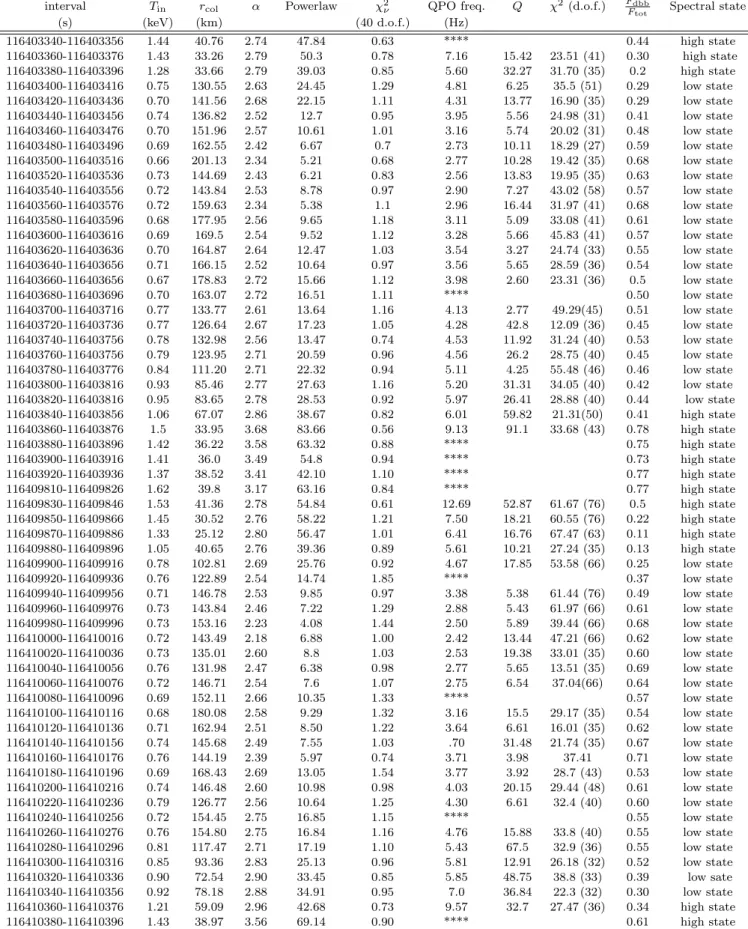
As we wanted to follow the QPO in the range 2–12 Hz found in SM97, we generate power spectra for the first cycle of Fig. 4 using the binned data, with 8 ms resolu-tion, and the event data with time resolution of 62 µs collected during 4 s accumulation, after background cor-rection. Actually the background is so low that retain-ing it would change the results only by less than ∼.5%. From this we generated a dynamical power spectrum of the source, repeating the analysis of SM97. Our result, shown in Fig. 5 (left), confirms theirs: the shaded, U-shaped pattern seen on the lower part of Fig. 5 between times ∼1000 and ∼1500, shows the QPO frequency and its evolution during the cycle. We then repeated this anal-ysis for the second cycle, confirming the generality of this behavior (Fig. 5, right).
The second step was then to track as precisely as pos-sible the QPO frequency, and to correlate it with the disk color radius extracted with the same process used for GRO J1655-40 in Sect. 2.1. We do this using the same time resolution data, but with exposures of 16 s. Power spectra were then generated using POWSPEC version 1, after background subtraction and collimator correction; they were then fitted with a model consisting of a power law with average index ∼−1.5, plus a Lorentzian whose line center is taken as the QPO centroid frequency; in some cases several Lorentzians were required to fit the 16 s power spectrum; we then chose the one closest to the frequency at which power was strong in power spectra of
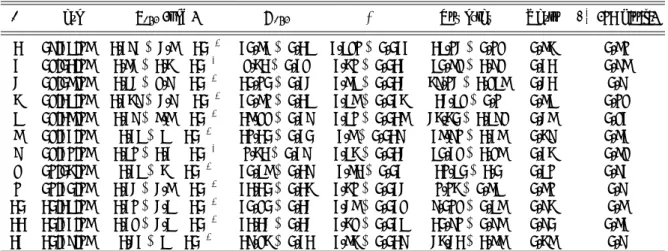
Table 2. Spectral and temporal fit parameters for GRS 1915+105, for each interval. R?= ((rcol/km)/(D/10 kpc))2cos θ, where θ is the inclination angle, and R? is the XSPEC blackbody normalization parameter. Q is a parameter relative to the QPO width with Q = νQPO/σQPO. Spectral states are defined by the values of the disk and the power law parameters; in particular a low state is defined by a low disk temperature (<∼1 keV) and a high radius, together with a predominance of the power law component. Based on the criterion of Merloni et al., we reject data points in the high state when the ratio Fdbb/Ftot is < .5.
interval Tin rcol α Powerlaw χ2ν QPO freq. Q χ2 (d.o.f.) Fdbb
Ftot Spectral state
(s) (keV) (km) (40 d.o.f.) (Hz) 116403340-116403356 1.44 40.76 2.74 47.84 0.63 **** 0.44 high state 116403360-116403376 1.43 33.26 2.79 50.3 0.78 7.16 15.42 23.51 (41) 0.30 high state 116403380-116403396 1.28 33.66 2.79 39.03 0.85 5.60 32.27 31.70 (35) 0.2 high state 116403400-116403416 0.75 130.55 2.63 24.45 1.29 4.81 6.25 35.5 (51) 0.29 low state 116403420-116403436 0.70 141.56 2.68 22.15 1.11 4.31 13.77 16.90 (35) 0.29 low state 116403440-116403456 0.74 136.82 2.52 12.7 0.95 3.95 5.56 24.98 (31) 0.41 low state 116403460-116403476 0.70 151.96 2.57 10.61 1.01 3.16 5.74 20.02 (31) 0.48 low state 116403480-116403496 0.69 162.55 2.42 6.67 0.7 2.73 10.11 18.29 (27) 0.59 low state 116403500-116403516 0.66 201.13 2.34 5.21 0.68 2.77 10.28 19.42 (35) 0.68 low state 116403520-116403536 0.73 144.69 2.43 6.21 0.83 2.56 13.83 19.95 (35) 0.63 low state 116403540-116403556 0.72 143.84 2.53 8.78 0.97 2.90 7.27 43.02 (58) 0.57 low state 116403560-116403576 0.72 159.63 2.34 5.38 1.1 2.96 16.44 31.97 (41) 0.68 low state 116403580-116403596 0.68 177.95 2.56 9.65 1.18 3.11 5.09 33.08 (41) 0.61 low state 116403600-116403616 0.69 169.5 2.54 9.52 1.12 3.28 5.66 45.83 (41) 0.57 low state 116403620-116403636 0.70 164.87 2.64 12.47 1.03 3.54 3.27 24.74 (33) 0.55 low state 116403640-116403656 0.71 166.15 2.52 10.64 0.97 3.56 5.65 28.59 (36) 0.54 low state 116403660-116403656 0.67 178.83 2.72 15.66 1.12 3.98 2.60 23.31 (36) 0.5 low state 116403680-116403696 0.70 163.07 2.72 16.51 1.11 **** 0.50 low state 116403700-116403716 0.77 133.77 2.61 13.64 1.16 4.13 2.77 49.29(45) 0.51 low state 116403720-116403736 0.77 126.64 2.67 17.23 1.05 4.28 42.8 12.09 (36) 0.45 low state 116403740-116403756 0.78 132.98 2.56 13.47 0.74 4.53 11.92 31.24 (40) 0.53 low state 116403760-116403756 0.79 123.95 2.71 20.59 0.96 4.56 26.2 28.75 (40) 0.45 low state 116403780-116403776 0.84 111.20 2.71 22.32 0.94 5.11 4.25 55.48 (46) 0.46 low state 116403800-116403816 0.93 85.46 2.77 27.63 1.16 5.20 31.31 34.05 (40) 0.42 low state 116403820-116403816 0.95 83.65 2.78 28.53 0.92 5.97 26.41 28.88 (40) 0.44 low state 116403840-116403856 1.06 67.07 2.86 38.67 0.82 6.01 59.82 21.31(50) 0.41 high state 116403860-116403876 1.5 33.95 3.68 83.66 0.56 9.13 91.1 33.68 (43) 0.78 high state 116403880-116403896 1.42 36.22 3.58 63.32 0.88 **** 0.75 high state 116403900-116403916 1.41 36.0 3.49 54.8 0.94 **** 0.73 high state 116403920-116403936 1.37 38.52 3.41 42.10 1.10 **** 0.77 high state 116409810-116409826 1.62 39.8 3.17 63.16 0.84 **** 0.77 high state 116409830-116409846 1.53 41.36 2.78 54.84 0.61 12.69 52.87 61.67 (76) 0.5 high state 116409850-116409866 1.45 30.52 2.76 58.22 1.21 7.50 18.21 60.55 (76) 0.22 high state 116409870-116409886 1.33 25.12 2.80 56.47 1.01 6.41 16.76 67.47 (63) 0.11 high state 116409880-116409896 1.05 40.65 2.76 39.36 0.89 5.61 10.21 27.24 (35) 0.13 high state 116409900-116409916 0.78 102.81 2.69 25.76 0.92 4.67 17.85 53.58 (66) 0.25 low state 116409920-116409936 0.76 122.89 2.54 14.74 1.85 **** 0.37 low state 116409940-116409956 0.71 146.78 2.53 9.85 0.97 3.38 5.38 61.44 (76) 0.49 low state 116409960-116409976 0.73 143.84 2.46 7.22 1.29 2.88 5.43 61.97 (66) 0.61 low state 116409980-116409996 0.73 153.16 2.23 4.08 1.44 2.50 5.89 39.44 (66) 0.68 low state 116410000-116410016 0.72 143.49 2.18 6.88 1.00 2.42 13.44 47.21 (66) 0.62 low state 116410020-116410036 0.73 135.01 2.60 8.8 1.03 2.53 19.38 33.01 (35) 0.60 low state 116410040-116410056 0.76 131.98 2.47 6.38 0.98 2.77 5.65 13.51 (35) 0.69 low state 116410060-116410076 0.72 146.71 2.54 7.6 1.07 2.75 6.54 37.04(66) 0.64 low state 116410080-116410096 0.69 152.11 2.66 10.35 1.33 **** 0.57 low state 116410100-116410116 0.68 180.08 2.58 9.29 1.32 3.16 15.5 29.17 (35) 0.54 low state 116410120-116410136 0.71 162.94 2.51 8.50 1.22 3.64 6.61 16.01 (35) 0.62 low state 116410140-116410156 0.74 145.68 2.49 7.55 1.03 .70 31.48 21.74 (35) 0.67 low state 116410160-116410176 0.76 144.19 2.39 5.97 0.74 3.71 3.98 37.41 0.71 low state 116410180-116410196 0.69 168.43 2.69 13.05 1.54 3.77 3.92 28.7 (43) 0.53 low state 116410200-116410216 0.74 146.48 2.60 10.98 0.98 4.03 20.15 29.44 (48) 0.61 low state 116410220-116410236 0.79 126.77 2.56 10.64 1.25 4.30 6.61 32.4 (40) 0.60 low state 116410240-116410256 0.72 154.45 2.75 16.85 1.15 **** 0.55 low state 116410260-116410276 0.76 154.80 2.75 16.84 1.16 4.76 15.88 33.8 (40) 0.55 low state 116410280-116410296 0.81 117.47 2.71 17.19 1.10 5.43 67.5 32.9 (36) 0.55 low state 116410300-116410316 0.85 93.36 2.83 25.13 0.96 5.81 12.91 26.18 (32) 0.52 low state 116410320-116410336 0.90 72.54 2.90 33.45 0.85 5.85 48.75 38.8 (33) 0.39 low sate 116410340-116410356 0.92 78.18 2.88 34.91 0.95 7.0 36.84 22.3 (32) 0.30 low state 116410360-116410376 1.21 59.09 2.96 42.68 0.73 9.57 32.7 27.47 (36) 0.34 high state 116410380-116410396 1.43 38.97 3.56 69.14 0.90 **** 0.61 high state
J. Rodriguez et al.: AEI and QPO in BH binaries. I. 493 Time (s) Count Rate (kcts/s) Frequency (Hz) Count Rate (kcts/s) Frequency (Hz) Time (s)
Fig. 5. Dynamical power spectra of GRS 1915+105. The left and right panels correspond respectively to the first and second
cycles analyzed. The X axis is is seconds, with the zero corresponding in each case to the beginning of accumulation.
Fig. 6. Power spectra from the second cycle; top left corresponds to the first time interval analyzed in this cycle, and bottom
right to the last one. Arrows indicate the position of the QPO found from the fit in each interval, using the dynamical power spectrum (Fig. 5) as a guide to reduce ambiguities. Even with this help, the limited statistics makes it difficult or impossible in some cases to correctly identify the QPO.
neighboring intervals. The trend of the usually strongest feature is easily picked out from the dynamical power spec-trum. The choice of this 16 s interval for the temporal analysis is a compromise between conflicting constraints: looking at variations of the disk radius and the QPO centroid frequency on short enough time scales (with-out averaging on too long time intervals over which the source varies rapidly), having enough flux to get sufficient
statistics on each data point, and getting the QPO fre-quency with good accuracy.
2.3. Results
The individual power spectra, obtained from interval # 2, are shown in Fig. 6. One sees that, with the time intervals
Frequency (Hz)
Color Radius (km) Color Temperature (keV)
Count Rate (kcts/s)
Count Rate (kcts/s)
Frequency (Hz)
Color Radius (km) Color Temperature (keV)
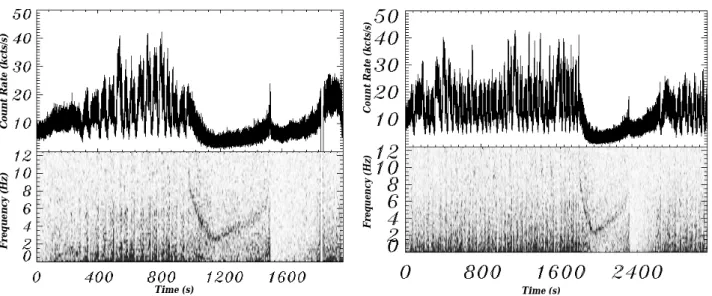
Fig. 7. Plot of the timing evolution of the source flux during the first (left), and second (right) cycle. Subpanel is a temporal
zoom on the interesting timing region, with, under the zoomed lightcurve, the fit values of the QPO frequency and the disk radius. Error bars are one σ confidence level.
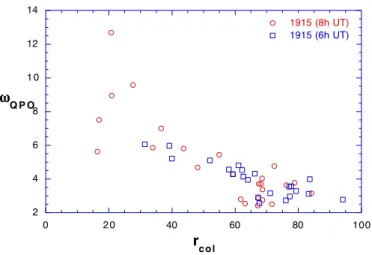
of 16 s, the QPO can most often be identified and properly found with our fitting procedure. Figure 7 shows superpo-sitions of our results for the disk color radius, the QPO frequency, and the disk temperature during both cycles. Figure 8 shows, for both cycles, the correlation between the QPO frequency and the disk color radius. At large rcol
the QPO frequency decreases with increasing rcol, as
dis-cussed by Sobczak et al. (2000) for XTE J1550-564; this is also the general tendency for this correlation, noted by SM97 during one cycle, and more generally by Muno et al. for an ensemble of observations (in particular for similar 30 min cycles).
It would be tempting to interpret the points at lower radius as a turnover, indicating a reversed correlation as seen in GRO J1655-40. However, returning to Fig. 7, one sees that this interpretation must be excluded: the points at lowest radius correspond to the very first manifesta-tions of the QPO. At this time the count rate has not yet started to decrease (this might indicate that the appear-ance of the QPO is not a consequence of the transition, but possibly its cause), while the QPO frequency decreases monotonously; the color radius first decreases before it starts growing, when the count rate decreases, marking the transition to the low state: this causes the reverse cor-relation seen in Fig. 8. On the other hand, returning to the data points in the high state, before the onset of the QPO one sees that in its variations the color radius consis-tently shows a fixed lower bound, which probably marks the Last Stable Orbit.
The data points showing an inverse QPO frequency-color radius correlation lie at lower frequency-color radius, and at these times the disk temperature decreases, as predicted by MFR. It is thus very likely that, in the spectral fits for these points, the correlation between the color radius and the disk inner radius has become anomalous.
3. Discussion
The possibility, which will be explored in Paper II, of a theoretical explanation has led us to reconsider the contrasting correlations, observed by SMR in GRO J1655-40 and XTE J1550-564, between the disk color radius and the QPO frequency. First guided by the arguments of MFR, we have rejected data points for GRO J1655-40 where the measure of the disk color radius was dubious. The major result of this work is thus that, though we have used the most stringent criterion to select “good” obser-vational data points, the reverse correlation remains: the QPO frequency decreases with decreasing radius in the case of GRO J1655-40.
In the case of XTE J1550-564 the data, for the obser-vations where a QPO is seen, always correspond to a low value of the ratio disk black body/total flux, and may not be reliable according to the criterion of MFR. We have thus turned to GRS 1915+105, because previous work by SM97 and Muno et al. (1999) had shown that, during the frequently observed 30 min cycles of that source, the QPO frequency and disk color radius varied in a correlated man-ner over a large interval. We have done a complete analy-sis of two of these cycles, sampling data over the minimal time interval compatible with proper statistics in order to follow as precisely as possible the rapid variations of the source. This does not show a reverse correlation as in GRO J1655-40. Data points obtained at the onset of the QPO would seem to indicate it, but a detailed analysis shows that they are probably incorrect (the spectral fit returning an anomalous value of the disk color radius), so that we have to rule them out.
However the measure of the radius is not an absolute one. It is obtained from a multicolor black-body + power law tail model (plus an iron line when needed), involv-ing a number of hypotheses (such as axisymmetry of the disk emission, and ∼r−3/4 radial temperature profiles), and should be submitted to a number of corrections (such
J. Rodriguez et al.: AEI and QPO in BH binaries. I. 495 2 4 6 8 1 0 12 14 0 2 0 40 60 80 100 1915 (8h UT) 1915 (6h UT) rc o l w w w wQ P O
Fig. 8. Plot of νQPO vs. rcol for GRS1915+105 for the first (squares) and second (circles) cycles; error bars shown in Fig. 7 are not displayed here, for the sake of clarity.
as electron diffusion or spectral hardening factor) which we have not tried to include here. Furthermore, MFR have recently shown that effects due to the finite disk thickness could result in a systematic underestimation of the radius, when it becomes small. It is remarkable here that, for the GRS 1915+105 data we have rejected, the spectral fit re-turns a color temperature which is lower than usual, and in particular lower than at times just preceding the onset of the QPO, although the radius decreases: this is compat-ible with the predictions of MFR, whose mechanism relies in part on the dissipation of part of the accretion energy in the corona rather than the disk (so that the disk cools down).
On the other hand, the data we have rejected for GRO J1655-40 show a very different behavior, also frequently observed in the low and steady state of GRS 1915+105 (Muno et al. 1999): there, the color radius takes extremely small values (sometimes very few kilome-ters) while the color temperature becomes high. This is not the behavior predicted by MFR, and it is quite unlikely that corrections of this type could explain so strongly anomalous values of the radius: the lowest radius value found by Sobczak et al. (2000) is about 4 times lower than the ones we retain.
However, we note that, if the emissivity is close to unity, the spectral fits actually measure (essentially by the intensity of the black body emission) the size of the emitting region: a simplistic view of the multicolor black-body spectrum used in the spectral fits is that the peak of the emission corresponds to the highest temperature in the disk, and the total intensity to the area of the emit-ting region at that temperature, all this weighted by the temperature distribution in the disk. In GRO J1655-40 we find that the color radius can strongly vary, while the to-tal luminosity remains approximately constant. The most obvious explanation would then be that the total accre-tion energy dissipated in the disk does not vary much, but that the area of the region where it is dissipated does. This leads us to suggest that the anomalously low
mea-sured radius, together with a high temperature, could be interpreted by the presence in the disk of a hot point or a spiral shock, where a substantial fraction of the accretion energy would be dissipated. A spiral shock could result from the non-linear evolution of the AEI, just as the gas forms shocks in the arms of spiral galaxies.
The discussion about the exact ratio rcol/rin, related to
the hardening factor by rin= rcol×f2, with f = Tcol/Teff,
being the hardening factor (Ebisawa et al. 1994) is a very complex one. It appears to be dependent on many phys-ical parameters, as shown e.g. by Shimura & Takahara (1995), for a Schwarschild Black Hole. Although both GRS 1915+105 and GRO J1655-40 are thought to be a Kerr Black Hole, we adopted the best result found in their work, f = 1.9, and tentatively estimated the po-sition of the last stable orbit, using RLSO∼ 35× 0.8Rcolf2
(Ebisawa et al. 1994). We chose for each source the low-est “good” value of Rcolas the one approaching RLSOthe
most. In the case of GRO J1655-40, this leads to an es-timation of RLSO ∼ 36 km, inconsistent with a ∼7 M
Schwarschild Black Hole, where RLSOwould be of the
or-der of 63 km. This large difference can be due to two effects. First, the value we adopt is not the exact measure of the last marginally stable orbit, but is really a rough estimation of it (we at least expect it to be closer to the compact object). The second one, which may be the ma-jor effect, is that this source, in particular, is expected to be a maximally rotating Black Hole (Strohmayer 2001), where RLSO = 17 km, which is, then, much more
consis-tent (Paper II). The case of GRS 1915+105 can now be explored, since Greiner (2001) has estimated the mass of the Black Hole to be close to 14 M . The result found (RLSO ∼ 59 km), as for GRO J1655-40, is inconsistent
with a Schwarschild Black Hole of 14 M , but would per-fectly fit the case of a maximally rotating Kerr Black Hole of such mass (see Paper II). We also note as an interesting possibility to discuss the mass of the Black Hole the work of di Matteo & Psaltis (1999), which should be enriched by recent measurements of this mass.
But we have to exercise here, extreme caution, since: – all the calculations in Shimura & Takahara (1995), in
particular the determination of the best value of the hardening factor, are made for a Schwarschild black hole;
– all the calculations, presented in Ebisawa et al. (1994), and Shimura & Takahara (1995), are done for a Shakura & Sunyaev (1973) α-disk, where energy and angular momentum are locally dissipated in the disk under the effect of viscous stresses; whereas in the framework of the AEI, only a small part of the en-ergy warms the disk. Most of it is transported toward the corotation radius (Tagger & Pellat 1999; Paper II; Varni`ere et al. in prep.);
– the Kerr metric may also affect the relation of Ebisawa et al. (1994), between RLSO, the radius of the Last
– although in the case of GRO J1655-40 the black hole is thought to be rapidly rotating, this is still unsolved for GRS 1915+105; its temporal behavior does not allow a firm conclusion (Strohmayer 2001) (one has to note, nevertheless, that previous studies give preference to a rapidly rotating black hole (Zhang et al. 1997b). The relevance of these calculations is thus a matter of debate, and we cannot draw conclusion on the value f = 1.9 for the hardening factor, or on the rotation of the black holes. It is however remarkable that the inde-pendent method presented in Paper II gives a good range of masses, for both sources, in the cases where both are spinning rapidly.
Our conclusions must be considered as tentative, given the uncertainties on the measure of the disk color ra-dius and its relation with its inner rara-dius, and given the other effects associated with the disk parameters, such as the amplitude and the radial distribution of the magnetic field. On the other hand, a coupled investigation of the low frequency QPO and of the disk spectral properties seems to be a most promising way to probe the physics of the inner accretion disk in black hole binaries.
Acknowledgements. The authors wish to thank many experts of the field for helpful discussions and comments. In particu-lar we thank C. Markwardt (including help with his IDL li-brary site and advice on producing dynamical power spectra), S. Chaty, F. Mirabel, E. Morgan, M. Muno, and R. Remillard. We also thank all the people contributing to the GSFC public database existence and update, and the helpful and construc-tive comments of both referees.
References
Bailyn, C. D., Orosz, J. A., Girard, T. M., et al. 1995, Nature, 374, 701
Belloni, T., Klein-Wolt, M., M´endez, M., van der Klis, M., & van Paradijs, J. 2000, A&A, 355, 271
Chaty, S. 1998, Th`ese de Doctorat, Universit´e Paris XI, Orsay Castro-Tirado, A., Brandt, S., Lund, N., et al. 1994, ApJS, 92,
469
di Matteo, T., & Psaltis, D. 1998, ApJ, 526, 101
Ebisawa, K., Ogawa, M., Aoki, T., et al. 1994, PASJ, 46, 375
Fender, R. P., Rayner, D., Trushkin, S. A., et al. 2002, MNRAS, 330, 212
Feroci, M., Matt, G., Pooley, G., et al. 1999, A&A, 351, 985 Greiner, J., Cuby, J. G., & McCaughrean, M. J. 2001, Nature,
414, 522
Hjellming, R. M., & Rupen, M. P. 1995, Nature, 375, 464 Markwardt, C. B., Swank, J. H., & Taam, R. E. 1999, ApJ,
513, 37
Merloni, A., Fabian, A. C., & Ross, R. R. 2000, MNRAS, 313, 193 (MFR)
Mirabel, I. F., & Rodr´ıguez, L. F. 1994, Nature, 371, 46 Mirabel, I. F., Dhawan, V., Chaty, S., et al. 1998, A&A, 330, L9 Mirabel, I. F., & Rodr´ıguez, L. F. 1999, ARA&A, 37, 409 Morgan, E. H., Remillard, R. A., & Greiner, J. 1997, ApJ, 482,
993
Muno, M. P., Morgan, E. H., & Remillard, R. A. 1999, ApJ, 527, 321
Orosz, J. A., & Bailyn, C. D. 1997, ApJ, 482, 1086
Psaltis, D., Belloni, T., & van der Klis, M. 1999, ApJ, 526, 262 Remillard, R. A., Morgan, E. H., McClintock, J. E., Bailyn,
C. D., & Orosz, J. A. 1999, ApJ, 522, 397
Remillard, R. A., McClintock, J. E., Sobczak, G. J., et al. 1999, ApJ, 517, 127
Shimura, T., & Takahara, F. 1995, ApJ, 445, 780
Sobczak, G. J., McClintock, J. E., Remillard, R. A., et al. 2000, ApJ, 531, 537 (SMR)
Strohmayer, T. E. 2001, ApJ, 554, L169 Strohmayer, T. E. 2001, ApJ, 552, L49
Swank, J., Chen, X., Markwardt, C., & Taam, R. 1997, Proc. of the conference Accretion Processes in Astrophysics: Some Like it Hot, held at U. Md., October 1997, ed. S. Holt, & T. Kallman
Tagger, M., & Pellat, R. 1999, A&A, 349, 1003
Tagger, M. 1999, Proc. of the 5th Compton Symp., Portsmouth (USA) [astro-ph/9910365]
van der Hooft, F., Heemskerk, M. H. M., Alberts, F., & van Paradijs, J. 1998, A&A, 329, 538
van der Klis, M. 1994, ApJS, 92, 511
Varni`ere, P., Rodriguez, J., & Tagger, M. 2002, A&A, 387, 497 (Paper II)
Wilson, C. A., Harmon, B. A., Fishman, G. J., et al. 1994, A&AS, 185, 120
Zhang, S. N., Ebisawa, K., Sunyaev, R., et al. 1997a, ApJ, 479, 381