HAL Id: cea-02384610
https://hal-cea.archives-ouvertes.fr/cea-02384610
Submitted on 28 Nov 2019
HAL is a multi-disciplinary open access archive for the deposit and dissemination of sci-entific research documents, whether they are pub-lished or not. The documents may come from teaching and research institutions in France or
L’archive ouverte pluridisciplinaire HAL, est destinée au dépôt et à la diffusion de documents scientifiques de niveau recherche, publiés ou non, émanant des établissements d’enseignement et de recherche français ou étrangers, des laboratoires
Measurements of miniature ionization chamber currents
in the JSI TRIGA Mark II reactor demonstrate the
importance of the delayed contribution to the photon
field in nuclear reactors
Vladimir Radulović, Damien Fourmentel, Loïc Barbot, Jean-Francois Villard,
Tanja Kaiba, Žerovnik Gašper, Luka Snoj
To cite this version:
Vladimir Radulović, Damien Fourmentel, Loïc Barbot, Jean-Francois Villard, Tanja Kaiba, et al.. Measurements of miniature ionization chamber currents in the JSI TRIGA Mark II reactor demon-strate the importance of the delayed contribution to the photon field in nuclear reactors. Nuclear Instruments and Methods in Physics Research Section A: Accelerators, Spectrometers, Detectors and Associated Equipment, Elsevier, 2015, 804, pp.149-154. �10.1016/j.nima.2015.09.015�. �cea-02384610�
Measurements of miniature ionization chamber currents in the JSI
TRIGA Mark II reactor demonstrate the importance of the delayed
contribution to the photon field in nuclear reactors
Vladimir Radulovi´ca,∗, Damien Fourmentela, Lo¨ıc Barbota, Jean-Fran¸cois Villarda, Tanja Kaibab, Gaˇsper ˇZerovnikb,∗∗, Luka Snojb
a
CEA, DEN, DER, Instrumentation Sensors and Dosimetry Laboratory, Cadarache, F-13108 St-Paul-Lez-Durance, France
b
Joˇzef Stefan Institute, Jamova cesta 39, SI-1000 Ljubljana, Slovenia
Abstract
The characterization of experimental locations of a research nuclear reactor implies the determination of neutron and photon flux levels within, with the best achievable accuracy. This study focuses on the photon flux problematic. In nuclear reactors, photon fluxes are commonly calculated by Monte Carlo simulations but rarely measured on-line. In this context, experiments were conducted with a miniature gas ionization chamber (MIC) based on miniature fission chamber mechanical parts, recently developed by the CEA (French Atomic Energy and Alternative Energies Commission) irradiated in the core of the Joˇzef Stefan Institute TRIGA Mark II reactor in Ljubljana, Slovenia. The aim of the study was to compare the measured MIC currents with calculated currents based on simulations with the MCNP6 code. A discrepancy of around 50% was observed between the measured and the calculated currents; in the latter taking into consideration only the prompt photon field. Further experimental measurements of MIC currents following reactor SCRAMs (reactor shutdown with rapid insertions of control rods) provides evidence that over 30% of the total measured signal is due to the delayed photon field, originating from fission and activation products, which are untreated in the calculations. In the comparison between the measured and calculated values, these findings imply an overall discrepancy of less than 20% of the total signal which is still unexplained.
Keywords: TRIGA reactor Miniature ionization chambers, Delayed photons, Monte Carlo
calculations, MCNP6
1. Introduction
In research reactors it is of primary importance to know with the best achievable accuracy the experimental conditions of irradiation locations. The primary method for the determi-nation of neutron flux levels are activation measurements, although the use of absolutely
∗Corresponding author. vladimir.radulovic@cea.fr, Tel.: +33 44 22 5 71 51 ∗∗Currently at EC-JRC-IRMM, Geel, Belgium
calibrated miniature fission chambers can provide, in addition to the flux levels themselves, detailed information on gradients and flux distributions [1] [2]. Knowledge on the photon flux levels is extremely important, especially for Material Testing Reactors (MTRs), where gamma heating effects are significant and an important constraint for the design of experi-mental devices. Another similar case are reference irradiation locations, used to qualify or calibrate nuclear instrumentation devices, sensitive to both neutrons and photons, as is the present case.
State of the art Monte Carlo particle transport codes (e.g. MCNP6) are able to per-form photon transport calculations, this problem is however significantly more extensive compared to neutron transport calculations. Not all processes of photon production are taken into account and some nuclear data for photon production are missing [3]. Therefore measurements have to be performed to obtain information on the photon flux levels and subsequently to aid in the validation of the results obtained from particle transport cal-culations. Currently, information on the photon fields in experimental locations is mostly obtained by nuclear heating measurements. However, recent studies for Material Testing Reactors (MTRs) showed the possibility of using miniature gas ionization chambers (MICs) to evaluate the absolute photon flux [4] [5] [6] [7].
Firstly, this paper presents an experimental campaign wherein a MIC based on miniature fission chamber mechanical parts (from the Photonis SAS company), recently developed by the CEA (French Atomic Energy and Alternative Energies Commission) was irradiated in the core of the Joˇzef Stefan Institute TRIGA Mark II reactor in Ljubljana, Slovenia. Measurements of the MIC current were performed at several stabilized reactor power levels and during sequences in which the reactor was started up from zero power, stabilized at full power and shut-down by rapid insertions of the control rods (so called SCRAM or trip). The experimental work is described in Section 2. Section 3 presents Monte Carlo calculations, which have been performed using the Monte Carlo particle transport code MCNP6 and a computational model of the JSI TRIGA Mark II reactor, which was previously verified and validated for neutronics calculations [8]. Based on technical drawings, a MIC has been modelled explicitly in the irradiation location used in the experimental campaign. Neutron and photon spectra have been calculated in the MIC components and surrounding regions, which serve as entry data for the determination of the MIC current in a second phase of Monte Carlo calculations. The comparison of the measured and calculated MIC currents is presented in Section 4, along with a discussion of the results.
2. Experimental MIC current measurements
2.1. JSI TRIGA Mark II reactor
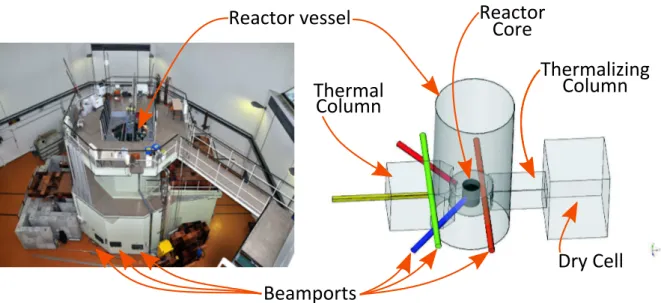
The 250 kW TRIGA Mark II reactor is a light water pool type reactor, cooled by nat-ural convection. The reactor core is of annular configuration with diameter of 44.2 cm and active fuel height of 38.1 cm. There are 90 positions in the reactor core available for fuel elements, control rods, irradiation channels, etc. In the aluminium grid plate above the re-actor core, there are 26 additional small holes, i.e. measurement positions (MPs), enabling access into the reactor core. For example, fission and ionization chambers can be inserted
Reactor vessel
Thermal
Column
Dry Cell
Beamports
Reactor
Core
Thermalizing
Column
Figure 1: Photograph and schematic view of the main components of the JSI TRIGA Mark II reactor.
Table 1: MIC component dimensions.
Anode Internal diameter [mm] 1.5 External diameter [mm] 2.0 Cathode Internal diameter [mm] 2.5 External diameter [mm] 3.0 Gas Gap [mm] 0.25
in any of these positions to measure the neutron or gamma flux at any axial position in (and above/below) the reactor core. A photograph and a schematic view of the main re-actor components are shown in Figure 1. Schematic drawings of the rere-actor core and the experimental configuration (the latter described in Section 2.2) are displayed in Figure 2.
2.2. Measurements at stable reactor power
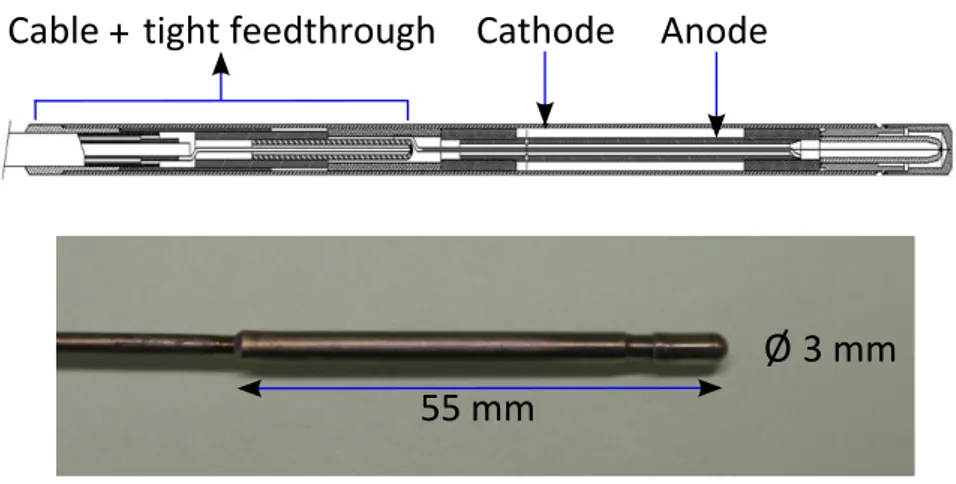
For the experimental measurements a miniature ionization chamber was employed. The ionization chamber, displayed in Figure 3 was assembled by the CEA’s Instrumentation, Sensors and Dosimetry Laboratory located in Cadarache. It is based on the mechanical parts of miniature fission chambers, but manufactured without fissile material deposition. Its main characteristics are detailed in Table 1.
Aluminium guide tubes, 6 m in length and 8 mm or 10 mm in diameter are employed to insert the fission or ionization chambers into the reactor core. A conical plug is welded to the bottom of the guide tubes to facilitate their insertion into the MPs from the reactor platform. A depth-stop, consisting of an aluminium annulus is welded around the exterior of the guide tube at 800 mm from the bottom in the interior of the guide tube. When inserted into the core, the depth-stop holds the guide tube at a known depth inside the reactor core, measured from the top grid plate. An aluminium guide tube containing a ionization chamber is also schematically displayed in Figure 2.
CC A1 B1 B6 B5 B4 B3 B2 C1 C6 C5 C4 C3 C2 C6 C6 C9 C8 C7 C12 C11 C10 S P D1 D6 D5 D4 D3 D2 D11 D10 D9 D7 D15 D14 E1 E5 E4 E3 E2 E13 E8 E7 E6 E12 E9 E17 E16 E15 E14 E20 E19 E18 E24 E23 E22 E21 F1 F5 F4 F3 F2 F8 F7 F6 F11 F10 F9 F15 F14 F13 F12 F19 F18 F17 F16 F20 F23 F22 F21 F26 F25 F24 F30 F29 F28 F27 D13 D12 D18 D17 D16 R C NS PT FPTS IC IC IC TIC CC Fuel element Control rod Irradiation channel Neutron source Measurement position Measurement position MP25 800 mm 10mm Aluminium guide tube Aluminium grid plates
Core configuration
(top view)
Guide tube and MIC
(side view)
Ionization chamber
364
mm
Figure 2: Left: JSI TRIGA Mark II reactor core configuration - Positions A-F in the reactor core contain fuel elements, control rods, irradiation channels and a neutron soruce, Measurement Positions (MPs) enable access into the reactor core. Right: Schematic view of the experimental configuration - an aluminium guide tube, 10 mm in diameter, containing a miniature ionization chamber is inserted into position MP25.
Cable
Cathode
Anode
55 mm
3 mm
Ø
+
tight feedthrough
Figure 3: Diagram (Photonis SAS) and photograph of the miniature ionization chamber used in the exper-iment.
Figure 4: Reactor power as a function of time during the measurements at steady power levels.
For the experiment, the MIC was inserted into MP25, inside a 10 mm guide tube. The MIC was lowered to the bottom of the guide tube and widthdrawn (436 ± 2) mm using a specially developed computer-controlled pneumatic positioning system. The depth of the bottom of the ionization chamber, measured from the top of the upper aluminium guide plate was (364 ± 2) mm. For the current measurement and the high voltage supply a Keithley 6517 electrometer was employed, which was controlled by a Labview based data aquisition application. The voltage for the measurement was set to 250 V. The current was measured with a sampling rate of 5 Hz.
The measurement was initiated at zero power, to determine the background signal due to the photon field present in the reactor core, originating from long-lived activation products in the fuel and reactor structural materials. Subsequently the power was increased in 11 steps, allowing for the power to stabilize at each step. In the last step the power was raised to full-power, i.e. 250 kW and kept steady in order to verify any drifting of the measured signal. Figure 4 displays the reactor power as a function of time during the experiment.
2.3. Measurements of start-up - shut-down sequences
Measurements were conducted to assess the fraction of the total MIC current due to the activation of the MIC structures themselves and the fraction of the total MIC current due to the delayed photon field, using the same MIC and guide tube in the same location in the reactor core as in the experiment at steady power levels. The idea of the experiment
was to measure the MIC current as a function of time after a reactor SCRAM (shutdown with rapid insertion of the control rods) with a sufficienly high measurement frequency. In theory after a SCRAM the photon flux exhibits a prompt drop, which follows the prompt drop in the neutron flux, then decays as a sum of exponential decay functions, depending on the radioactive precursors of the delayed photons. The same data acquisition system was employed as in the previous measurements. The measurement frequency was increased to 10 Hz, to capture the time dependence in sufficient detail.
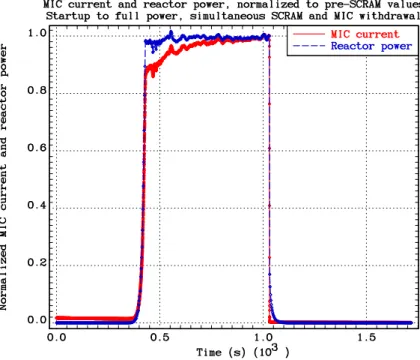
Firstly a series of three measurements was performed, in which the reactor power was increased from zero to full power (250 kW), then simultaneously a SCRAM was initiated and the MIC was withdrawn from the reactor core by around 3 m, where the measured signal originating from the core is negligible. This initial series was aimed at assessing the delayed contribution of the measured signal originating from the activation of the MIC components themselves. Figure 5 displays a measurement of the time dependence of the MIC current along with the reactor power following a reactor SCRAM, both normalized to the value prior to the reactor SCRAM, from the first series of measurements.
Following the first series a second series of three measurements was performed, in which the MIC was kept at the same position inside the reactor core throughout. Figure 6 dis-plays a measurement of the time dependence of the MIC current along with the reactor power following a reactor SCRAM, again both normalized to the value prior to the reactor SCRAM. The delayed photon contribution originating from the reactor core and surround-ing structures becomes visible comparsurround-ing Figures 5 and 6 and is seen to exhibit exponential decay.
3. Monte Carlo calculations
3.1. Photon flux and spectra calculations
The photon flux levels and spectra were calculated using the Monte Carlo particle trans-port code MCNP6 [9], in conjunction with the ENDF/B-VII.1 nuclear data library, using a detailed computational model of the JSI TRIGA Mark II reactor, which has been verified and validated against experimental measurements for neutron transport calculations. The validation first begun with calculation of kef f and the comparison with the criticality bench-mark experiment, performed in 1991 [8]. Subsequently, in order to expand the applicability of the computational model, comparisons were made between calculated and experimentally determined reaction rate distributions for the197Au(n, γ)198Au and 27Al(n, α)24Na reactions in the irradiation channels of the reactor [10] and more recently for the 197Au(n, γ)198Au reaction within the reactor core [11].
A CEA miniature ionization chamber and an aluminium guide tube have been explicitly modelled inside the MP25 position in the reactor core, to replicate the experimental con-ditions. Neutron and photon spectra in fine energy group structures have been calculated inside the ionization chamber components and inside several cylindrical water shells and the aluminium guide tube surrounding the chamber, using the track length estimator - the F4 tally in MCNP terminology. Vertical sections of the computational model used in this step
Figure 5: Measured MIC current normalized to maximum value versus time: reactor start-up from zero to full power, followed by a simultaneous reactor SCRAM and MIC withdrawal
and in the following one, described in the following section are displayed in Figure 7. The calculated results φF4 are normalized according to the reactor power level according to:
φ = φF4 P ν
wkef f, (1)
to obtain actual physical values [12]. This data serves as entry data for the determination of the MIC current, described in the following section.
3.2. MIC current calculations
To translate the calculated absolute photon flux values to electric currents, a second phase of Monte Carlo calculations was performed using a model comprised of the MIC and surrounding water shells and aluminium guide tube. The main contribution to the current due to the photon field is calculated using a photon source defined in the outermost water shell in the model, having an energy distribution matching the photon spectrum from the first step. Further calculations are performed using a neutron source to evaluate the contributions to the MIC current from the neutron field. In all cases the calculated response is the energy deposition per source particle in the gas between the ionization chamber electrodes, using the so called *F8 tally. The two-phase calculation process is required in order to achieve satisfactory statistical uncertainties in the calculated results inside the ionization chamber active volume, which is very small in size. In previous work
Figure 6: Measured MIC current normalized to maximum value versus time: reactor start-up from zero to full power, followed by a reactor SCRAM
Hori o t se tio
Ph se ho e re tor ode
Ph se
odes s guide t ue ue ue ertise tio Hori o t se tio
erti se tio oid
Figure 7: Horizontal and vertical sections of the computational models used in the calculations. Left: MIC inserted into MP25 in the computational model of the JSI TRIGA Mark II reactor, first phase of calculations. Right: computational model of a MIC, second phase of calculations.
[4] the MIC current contributions were calculated from the calculated energy deposition results using the following relationships:
Iγ =∗F 8γφγ 4 S e0 Epair, In = ∗ F 8nφn 4 S e0 Epair (2) where ∗ F 8γ and ∗
F 8n is the calculated energy deposition per source particle from photons or neutrons, respectively, φγ and φn are, respectively, the absolute photon and neutron flux values outside the MIC, S is the external surface of the MIC, e0 is the elementary charge and Epair is the average energy to produce an electron-ion pair in the gas within the ionization chamber. The assumption in relationships (2) is the translation of the photon flux outside the MIC outmost boundary to a photon current directed towards the MIC, represented by the term φγ/4, which holds if the photon flux is isotropic. In the present work, the computational model for the second phase of calculations has been extended to include the water around the MIC, the aluminium guide tube in which it is located and two external water shells. The particle source was located in the outermost water shell. General expressions to translate the calculated energy deposition into absolute electric currents are proposed: Iγ =∗ F 8γφ 1 γ φ2 γ e0 Epair, In= ∗ F 8nφ 1 n φ2 n e0 Epair, (3) where φ1
γ and φ2γ are the photon flux values inside the active MIC volume (where the energy deposition is calculated) in the first and second calculation phases, respectively, φ1
n and φ2n are the neutron flux values, where the indices 1 and 2 have the same meaning as for the photon flux values. This approach is currently being used with promising results in the interpretation of the measured Self-Powered Neutron Detector (SPND) currents, which are being researched and developed at CEA Cadarache [13].
4. Results and discussion
4.1. Measurements at stable reactor power, comparison with calculations
Figure 8 displays the measured MIC current as a function of reactor power at steady power levels. Table 2 reports the reactor power, the measured and calculated MIC cur-rent along with the uncertainties, and the relative differences between the calculated and measured MIC currents.
The uncertainties in the reactor power were assessed from the variations in the signal obtained from the reactor instrumentation and do not include any systematic uncertainties. The measured current values were determined by averaging several hundred measurement values at each power step. The quoted uncertainty in the measured values is a compound uncertainty, assessed from the variation of the measured signal (the relative standard de-viations being around 0.4 %) and from the uncertainty in the MIC position in the reactor core. The latter was estimated from recently performed axial profile measurements [14]; the uncertainty in the measured MIC current due to an uncertainty of 2 mm in the position is 0.8 %.
Figure 8: Measured MIC current as a function of reactor power at steady power levels.
In the calculation of the MIC currents the most important source of uncertainty is the normalization constant, defined in Equation 1, which includes the reactor power level. An uncertainty of 5 % in the power level is adopted, following a recent study in which measured and calculated197Au(n, γ)198Au reaction rates in the JSI TRIGA Mark II reactor core were compared [11].
We can observe that the dependence of the MIC current on the reactor power level is linear, which demonstrates that MICs are good monitors of the reactor power. This result was observed and studied in 1970s with other different gamma sensors [15] [16]. Slight devi-ations from linearity at around 150 kW, 200 kW and full power (250 kW) are attributable to the fact that the measurement was initiated with the reactor not having been started-up for a period of several days prior to the experiment. During the measurement, at progressively higher reactor power levels, a buildup occurred of the concentrations of radioactive precur-sors, causing an increase in the magnitude of the delayed photon field, thereby resulting in a slight convex curvature in the measurement results.
The measured and calculated MIC currents at different reactor power levels are reported in Table 2. At zero and low power levels the relative differences are significant (70-80%) and are due to the delayed photon background present in the reactor, caused by relatively long-lived radioactive precursors, which is not treated in the calculations. At higher power levels (above 5 kW) the relative differences are seen to stabilize at a value of around -50%. As shown in the following section, the major part of the discrepancy is attributable to the delayed photon field originating relatively short-lived radioactive precursors, which again is
Table 2: Measured and calculated MIC currents at different stable reactor power levels.
Power Power Measured Meas. curr. Calc. Calc. curr. Relative (kW) unc. (kW) current (A) unc. (A) current (A) unc. (A) diff. (%)
0 0 1.39×10⁻⁹ 1×10⁻¹¹ 0 0 -100 0.1 0.0005 1.92×10⁻⁹ 2×10⁻¹¹ 2.5×10⁻¹⁰ 1×10⁻¹¹ -86.9 0.501 0.002 4.00×10⁻⁹ 3×10⁻¹¹ 1.3×10⁻⁹ 6×10⁻¹¹ -68.2 0.998 0.005 6.60×10⁻⁹ 5×10⁻¹¹ 2.5×10⁻⁹ 1×10⁻¹⁰ -62.6 5.01 0.02 2.71×10⁻⁸ 2×10⁻¹⁰ 1.3×10⁻⁸ 6×10⁻¹⁰ -53.0 10 0.05 5.29×10⁻⁸ 4×10⁻¹⁰ 2.5×10⁻⁸ 1×10⁻⁹ -52.1 30.2 0.05 1.53×10⁻⁷ 1×10⁻⁹ 7.6×10⁻⁸ 4×10⁻⁹ -49.9 50 0.2 2.55×10⁻⁷ 3×10⁻⁹ 1.3×10⁻⁷ 6×10⁻⁹ -50.3 99.5 0.7 5.01×10⁻⁷ 5×10⁻⁹ 2.5×10⁻⁷ 1×10⁻⁸ -49.7 150.5 1 7.47×10⁻⁷ 7×10⁻⁹ 3.8×10⁻⁷ 3×10⁻⁸ -48.8 200 2.5 1.00×10⁻⁶ 1×10⁻⁸ 5.1×10⁻⁷ 3×10⁻⁸ -49.4 251 3 1.31×10⁻⁶ 1×10⁻⁸ 6.4×10⁻⁷ 3×10⁻⁸ -51.4
Table 3: Assessed relative contributions to the measured MIC current originating from the activation of the MIC itself and from the delayed photon field in the reactor.
Measurement Relative contribution Measurement Relative contribution (MIC withdrawal) due to MIC activation (MIC position constant) due to delayed photons
1 (0.4 ± 0.1)% 4 (32 ± 4) % 2 (0.4 ± 0.1)% 5 (32 ± 4) % 3 (0.5 ± 0.1)% 6 (34 ± 4) %
not treated in the calculations.
4.2. Measurements of start-up - shut-down sequences
Figure 5 displays a measurement of the time dependence of the MIC current following a simultaneous reactor SCRAM and MIC withdrawal, along with the reactor power, both normalized to the value prior to the reactor SCRAM. It can be observed that the signal quickly drops to less than 1% of the value at full reactor power indicating that the contri-bution to the measured signal due to the activation of the MIC components is very low. By observing the time dependence of the measured signal, assessments were made of the contribution to the measured signal originating from the activation of the MIC itself. The values are reported in Table 3.
Figure 6 displays a measurement of the time dependence of the MIC current following a reactor SCRAM along with the reactor power, again both normalized to the value prior to the reactor SCRAM. The time dependence of the measured MIC current clearly exhibits a prompt drop, followed by decaying behaviour. Assessments were made of the magnitude of the signal immediately after the reactor SCRAM, due to the delayed contribution to the photon field. The values for three measurements, reported in Table 3, are in excess of 30% of the total measured signal.
5. Conclusions
This paper provides experimental evidence on the significant magnitude of the delayed contribution to the photon field present in a nuclear reactor. On the basis of the presented
results a general recommendation can be made to include photon flux measurements in the characterization of irradiation facilities in nuclear reactors. This is especially valid when nuclear heating effects present an important constraint on the design of irradiation devices. Preliminary results from two recent experimental campaigns in two different research nuclear reactors, involving multiple radiation detectors, including MICs, have confirmed the same order magnitude of the delayed photon field [17].
The main conclusions of the present work are two. It has been shown that the most recent version of MCNP (MCNP6.1), without taking the delayed photon field into account, underpredicts the magnitude of the photon field in the JSI TRIGA Mark II reactor by around 50 % and that the magnitude of the delayed photon field exceeds 30 % of the total. This implies that a fraction of less than 20% of the total photon field remains unaccounted for in the present work, which, in the field of nuclear heating measurements is an encour-aging result. With the development of Monte Carlo transport codes, new capabilities are being introduced, including the creation and transport of delayed photons originating from the decay of fission and activation products. In future research, the presented experiments will serve as a reference case, against which improvements in the particle transport codes (MCNP) and the nuclear data libraries for photons can be verified and validated.
Acknowledgements
This work has been performed with funding from the Nuclear Instrumentation Project, Nuclear Energy Division of CEA, and in the framework of a Bilateral Cooperation between the CEA and the Slovenian Ministry of Higher Education, Science and Technology. The au-thors would like to thank the JSI TRIGA Mark II reactor operators Mr. Darko Kavˇsek, Mr. Anˇze Jazbec and Mr. Sebastijan Rupnik for their assistance in performing the experiments.
References
[1] L. Snoj et al., CEA-IJS Joint Experimental Campaign at TRIGA Mark II Reactor at Joˇzef Stefan Institute. In: Proceedings of the International Conference Nuclear Energy for New Europe 2011, Bovec, Slovenia, Paper no. 407.
[2] ˇZ. ˇStancar et al., Evaluation of the Axial Absolute Power Profile Measurements at the JSI Triga Mark II Reactor. In: Proceedings of the International Conference Nuclear Energy for New Europe 2012, Ljubljana, Slovenia, Paper no. 1008.
[3] A-C Colombier et al., ”Nuclear data production, calculation and measurement: a global overview of the gamma heating issue”, EPJ Web of Conferences, 42, 04001 (2013), DOI: 10.1051/epjconf/20134204001. [4] D. Fourmentel, P. Filliatre, J-F. Villard, et al., ”Measurement of photon flux with a miniature gas ion-ization chamber in a Material Testing Reactor”, Nuclear Instruments and Methods in Physics Research A 724 (2013) 76-82.
[5] D. Fourmentel, C. Reynard-Carette, A. Lyoussi, et al., ”Nuclear heating measurements in material testing reactor: a comparison between a differential calorimeter and a gamma thermometer”, IEEE Transactions on Nuclear Science NS-60 (1) (2013) 328-335, Part: 2.
[6] D. Fourmentel, ”Mesures neutroniques et photoniques combines pour la caract´erisation precise des canaux exp´erimentaux du futur r´eacteur d’irradiation Jules Horowitz (RJH)”, PhD, Aix-Marseille Uni-versity, 2013.
fission chambers with Monte Carlo simulations”, Nuclear Instruments and Methods in Physics Research A648(2011)228-237.
[8] M. Ravnik, R. Jeraj, ”Research reactor benchmarks,” Nucl. Sci. Eng. 145(2003)145-152. [9] D. B. Pelowitz et al., MCNP6 User’s Manual, Version 1.0 May 2013, LA-CP-13-00634.
[10] L. Snoj et al., Analysis of neutron flux distribution for the validation of computational methods for the optimization of research reactor utilization, Appl. Radiat. Isot. 69, 136-141.
[11] V. Radulovi´c et al., Validation of absolute axial neutron flux distribution calculations with MCNP with 197
Au(n, γ)198
Au reaction rate distribution measurements at the JSI TRIGA Mark II reactor, App. Rad. Isot. 84, 2014, 57-65.
[12] G. ˇZerovnik, M. Podvratnik, L. Snoj, On normalization of fluxes and reaction rates in MCNP criticality calculations, Annals of Nuclear Energy, 63, 2014, 126-128.
[13] V. Radulovi´c et al., ”Multi-step Monte Carlo calculations applied to nuclear reactor instrumentation - source definition and renormalization to physical values”, paper in preparation for the International Conference ANIMMA 2015, 20-24 April 2015, Lisbon, Portugal.
[14] G. ˇZerovnik et al., Validation of the neutron and gamma fields in the JSI TRIGA reactor using in-core fission and ionization chambers, App. Rad. Isot. 96, 2015, 27-35.
[15] O. Strindehag, ”Response of self-powered gamma detectors”, Atomkernenergie Germany, Vol. 17(4), pp. 267-270, 1971.
[16] F.E. Levert, ”A threshold self-powered gamma detector for use as a nuclear reactor power monitor”, IEEE Transactions on Nuclear Science, Vol. NS-24(1), pp. 683-686, 1977.
[17] D. Fourmentel et al., ”Delayed Gamma Measurements in Different Nuclear Research Reactors Bringing Out the Importance of the Delayed Contribution in Gamma Flux Calculations”, paper in preparation for the International Conference ANIMMA 2015, 20-24 April 2015, Lisbon, Portugal.