HAL Id: halshs-02995835
https://halshs.archives-ouvertes.fr/halshs-02995835
Submitted on 22 Dec 2020HAL is a multi-disciplinary open access
archive for the deposit and dissemination of sci-entific research documents, whether they are pub-lished or not. The documents may come from teaching and research institutions in France or abroad, or from public or private research centers.
L’archive ouverte pluridisciplinaire HAL, est destinée au dépôt et à la diffusion de documents scientifiques de niveau recherche, publiés ou non, émanant des établissements d’enseignement et de recherche français ou étrangers, des laboratoires publics ou privés.
Introduction to global container shipping market
César Ducruet, Hidekazu Itoh
To cite this version:
César Ducruet, Hidekazu Itoh. Introduction to global container shipping market. Global Logistics Network Modelling and Policy. Quantification and Analysis for International Freight, Elsevier, pp.3-30, 2021, �10.1016/B978-0-12-814060-4.00001-0�. �halshs-02995835�
Introduction to Global Container Shipping Market
César Ducruet, CNRS
Hidekazu Itoh, Kwansei Gakuin University
In: Shibasaki R., Kato H., Ducruet C. (Eds.) (2020) Global Logistics Network
Modelling and Policy. Quantification and Analysis for International Freight, Elsevier,
pp. 3-30.
1. Introduction: Containerization and global logistics
In 26th April, 1956, an American land transporter named Malcom McLean started competing with freight railway companies on inter-state long distance transport in the US. He first navigated a hopped-up container ship from Newark, New Jersey, to Houston, Texas, along the US East Coast by his shipping company (later named Sea-Land). Maritime containers were acquired for two main purposes: 1) to reduce port handling costs by unitization (container “box”) of cargo and 2) to reduce truck transport cost on long-distance delivery. Indeed, the container ship permitted cargo to deliver cargo through intermodal transport on land and sea (Levinson, 2006).
The strongest advantage of containerization was to provide a more efficient cargo handling on the docks. At this time, a container was mounted on a wagon for land transport, or current roll-on/roll-off (Ro-Ro) shipping. However, because the system was initially inefficient due to the weight and space of wagons, container ships used cranes to handle the box between ship and yard. Finally, the Sea-Land company launched a modern full-container ship without crane onboard in 1966 to cross the Atlantic, as European ports such as Antwerp became able to handle containers in the late 1960s (Morel and Ducruet, 2015). After certain technological progress, gantry cranes were placed on berths to carry containers between ship and terminal, while chasee and trailer moved containers inside the container terminal.
Containerization helped reducing handling time on both sea and land sides. At the time of early containerization, the total duration of a round-trip in the Pacific Ocean between East Asia (e.g. Kobe, Japan) and North America (NA) (e.g. San Francisco, US East Coast) by conventional ship (general cargo) was about eighty days (35 days on sea, and 45 days on land) in 1956. However, in 1968, after full-container ships were launched, the total duration of a round-trip decreased to thirty days (23 days on sea, and 7 days) between Tokyo and Los Angeles (Hoshino, 1995). Containerization had contributed to delete temporal gaps between origin and destination along supply chains, while accelerating global trade and horizontal division of production. In 2017, because of slow steaming and multi-stops at hub-ports, most of round-trips’ duration are currently
35 days (five weeks) or 42 days (six weeks) on the route (International Transportation Handbook, 2017), as explained below.
Finally, maritime transport business had changed from labor-intensive to capital-intensive industry. For example, global major ports heavily invested in new gantry cranes for faster handling operations. In addition to container terminal development, container ships grown in size to achieve economies of scale. Indeed, after the introduction of over-Panamax1 vessels in 1988, shipping lines built ever-larger container ships (Table 3). Such vessels again needed investments on the terminal side to accommodate ship calls all over the world. Deeper container berths, mega-gantry cranes, and larger container yards became the norm for terminal operations. For instance, such cranes must be cover 24 lines for the beam of 18,000 TEUs class container ships today.
Such operational and technological changes are both causes and consequences of wider global economic (e.g. manufacturing shifts) dynamics affecting the global port hierarchy, as seen with Table 1 for the period 1975-2016. In 1975, most of the top ranked container ports were North American, European and Japanese due to the provision, in the “Triade” (Ohmae, 1985), of container berths with gantry and terminal cranes that were still lacking at developing countries. However in 2016, seven ports are Chinese (including Hong Kong) within the top ten, following high economic growth and rapid port development since the 2000s. The other three ports are also Asian, like Singapore, Busan, and Dubai.
Despite their initial domination within Asia, Japanese ports, and especially Kobe, had been taken over by other East Asian ports, especially by Busan due to networks effects and the Hanshin Earthquake in January 1995 (Xu and Itoh, 2018). In a similar vein, and after playing a crucial role as a gateway and hub for mainland China due to its pre-1997 status as an independent city-state with Western trade practices, lost cargo in the last decade to Shenzhen, which is adjacent to Hong Kong. By contrast, Singapore maintained its port growth as the transit point between Pacific Ocean and Indian Ocean connecting Asia with Europe, and highly frequent feeder services with neighboring Southeast Asian countries. Yet, competitors started to emerged such as Tanjung Pelepas in Malaysia (2000), Cai-Mep Thi-Vai in Vietnam (1996), and Jakarta / New Priok in Indonesia (under construction) to provide alternative transit points and enhance their respective local economies.
[Table 1]
In this chapter, we discuss the changes of maritime and port logistics affected by containerization in the last 50 years. In section 2, we show the impact of containerization on the
1 Based on the ship size which can navigate on Panama Canal, the size which cannot navigate on the
world economy and global maritime networks including supply chain. Section 3 discusses the function of container terminal enhancing maritime transport and connecting the land and sea transports, especially in this section about the constraint and challenges of port development for larger ships and about the port management and terminal operation. In section 4, we present operational logics of shipping lines and alliances while providing concrete empirical evidences on changing patterns of global container flows. As reference, next Chapter 2 discusses port hinterland which is the connection to port on the land side with shippers.
2. Economic growth and container cargo movements
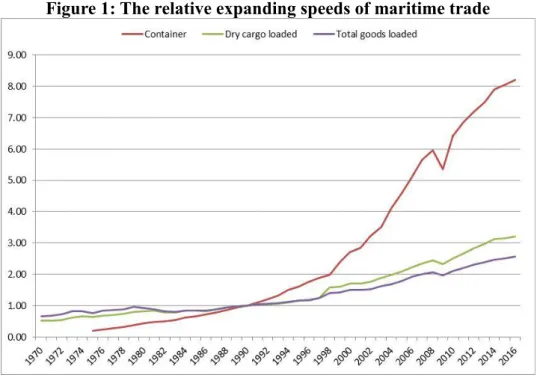
The innovation of containerization in maritime trade cause a rapid expansion of global trade (see also Bernhofen et al., 2013). Figure 1 compares the evolution of different maritime trades in the last four decades (the handling level of 1990 is base-line). Most of goods shipped in containers being general cargo, or intermediate and finished goods, container traffic had expanded much quicker than general cargo, especially after 1998 (see also Figure 4). Indeed, a growing share of general cargo had become containerized in the last two decades. In addition, the impacts of global recession for maritime trade were much bigger on container than on general cargoes.
[Figure 1]
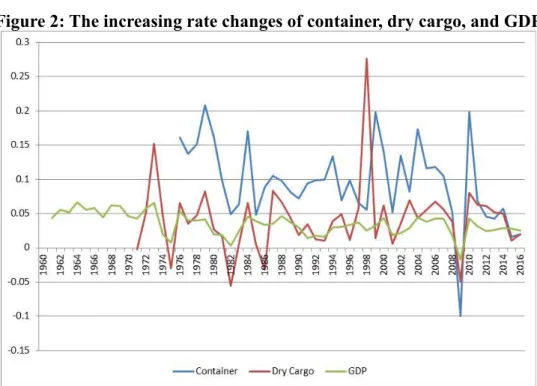
The relationship between maritime trade, especially containerization, and economic activities, Figure 2 shows the increasing rate changes of container handlings volumes (TEUs) and dry cargo (ton base) compared to Global Domestic Product (GDP) in the last four decades or so. Except for 1998 and 2009, the increasing rate of container handling volumes was higher than the ones of dry cargo and GDP. The average growth rate of container handling is about 9.6% as compared to 4.1% for dry cargo and 3.0% for GDP. On the other hand, the standard deviation of container handling growth rates is 5.8, compared with 5.0 and 1.3 for dry cargo and GDP, respectively. Several factors can explain such a result. First, handling items in containers are mainly high value added goods (i.e. consumption and intermediate goods), so that the demand of container transport is less stable than for general cargo and natural resources (i.e. bulks). Second, container handling is highly connected with economic circulation. For example, the correlation coefficients of the growth rates with GDP are 0.66 with container and 0.47 with dry cargo. Third, slowing trade, or increasing global GDP is higher than for global trade, as the Lehman shock is said to have finished in 2017 (CPB Netherlands Bureau for Economics Policy Analysis, 24th November, 2017).
[Figure 2]
When observing the growth rates of container handling volumes and GDP by countries (see Appendix, Table A1), again, the growth rate of container handling has been higher than that of GDP. However, the current Chinese growth rates of container handling remain rather moderate, while the one of Hong Kong had been negative in the last five years. The center of gravity of economic expansion had, indeed, shifted towards South Asia, like Indonesia and Vietnam (Itoh, 2012).
Figures 3 (a) and (b) show the relative scales of container handling volumes and value added (GDP) by regions/countries (see Appendix, Table A2). Until the mid-1990s, most of container traffic was handled in advanced economies and regions as mentioned above, until Chinese ports increased their share after 1995, and especially 2001 (entry of China in the World Trade Organization (WTO)). Nowadays, the total Chinese share including Hong Kong is more than 30%, while European ports witnessed a decrease from 30% in 1975 to 12% in 2015. Although Hong Kong had increased their global share until the middle of 1990s, their share was taken by the mainland Chinese ports by the container terminal developments, turning into a global financial and value-added center instead of a cargo handling hub (see Wang and Chen, 2010).
On the other hand, the relative shares of GDP have been changing more smoothly than for container handling. For example, although the Chinese economy including Hong Kong occupies about 12% in 2015, the advanced economies, like NA, Europe (Germany, UK, and France) and Japan still take their position to some extent. This result is partly due to the fact that container handling volumes are sometimes inflated by official statistics because of large transshipment volumes, leading to double-counts of each container move.
[Figure 3]
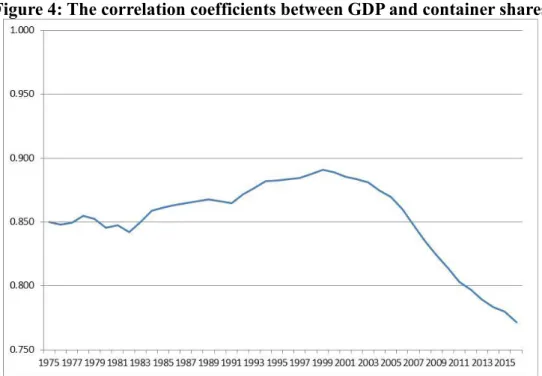
Until the end of 1990s, the relative changes of economic activities (GDP) and cargo movements (containers) had maintained relatively tight linkages. In Figure 4, the correlation coefficients between the relative shares of GDP and container handling on countries (see Appendix, Tables A2) had been increasing until 1999. The decrease after 2000, including China’s entry in the WTO and the global financial crisis effects, can be explained by the rapid progress of supply chain development in emerging economies (i.e. BRICS countries), especially in Asia, and a growing imbalanced international horizontal division of production (see Table 2).
Tables 2 (a) and (b) show the inter- and intra-regional container movements in 1998 and 2016. As discussed above, the distribution of container and economic activities had been tightly connected until 1999. However, they are less connected in the 2000s. The center of gravity of container movements have been shifting to intra-regional activities in Asia in a context of increased regional integration, thereby concentrating more than 25% of global container movements. Nowadays, the impact of economic growth on container movements is amplified and imbalanced on routes, or highly weighted inside Asia. Containerization had increased the speed of economic growth at emerging economies and expanded the imbalance of cargo movements on routes and regions throughout the world.
[Table 2]
3. Port development and terminal operations
3.1 Terminal development and new ports openingThe first ship in 1956 by McLean delivered 58 boxes. Containerships expanded through economies of scale (see Table 3) as underlined by Cullinane and Khanna (2000). For instance, although ship capacity was less than one thousand in the 1960s, nowadays the world’s largest containership “MOL Triumph” of the shipping line MOL built in 2017 reaches more than 20 thousand Twenty-foot Equivalent Units (20,170 TEUs), 400m length, and 59m width. As a consequence, such “mega-ships” require high-standard container terminals in terms of both berth length and depth (see Ducruet and Berli, 2018 for an empirical analysis of the global distribution of mega-ship traffic). These facilities affect port operational efficiencies (Tongzon, 2001; Itoh 2002) and leads to a debate on whether ports and nation-states should follow such a trend. Previously already, so-called “Post-Panamax II” ships carrying about 8,000 TEUs needed the container berth with 16-18 meters water depth and 18,000 TEUs capacity on the terminal (ULCS).
[Table 3]
Larger-size container ship imposes the expansion of container terminals. Except the ports of Marseilles and Barcelona in Europe, Los Angeles and Long Beach in NA, numerous ports are located upstream rivers and estuaries as a reflection of their historical background of port development, so that their expansion faces important limitations, with Antwerp and Hamburg as exceptional cases (Notteboom, 2016). This explains why larger ships increasingly call at deep-water ports, the exemplary case being London, mainly served by Felixstowe (operated by Hong
Kong- based Hutchinson Whampoa), 250 kilometers away, although recently the global operator Dubai Ports World (DPW) developed the new London Gateway container terminal with the slogan “ship closer, save money”. Rotterdam is a special case as it has been relocating its container terminals by sea reclamation through the Maasvlakte projects. Most of nowadays ports and container terminals have to invest in mega gantry cranes, or longer arm of crane, for lifting on and off the containers inside a width ship.
In East Asia, the ports of Shanghai and Busan also had constructed new container terminals through sea reclamation (i.e. Yangshan deep-water port in 2005, Busan New port in 2006). Elsewhere, Laem Chabang in Thailand (1991) and Cai-Mep Thi-Vai in Vietnam (1996) were newly constructed for containerization away from their old river ports (i.e. Bangkok and Ho Chi Minh, respectively). Lastly, the new port of Tanjung Pelepas in Malaysia (2000) was constructed for competing with Singapore (see Table 1). At its opening, APM Terminals, the main terminal operator of Maersk, shifted from Singapore to Tanjung Pelepas, it’s the direct effect of decreasing Singapore’s traffic by 30%, for the sake of competition but also as a way to bargain port costs. Following Maersk, Evergreen also shifted their hub-port to Tanjung Pelepas. Although Maersk returned to Singapore less than a year later, Tanjung Pelepas has been increasing its container throughput in the last years.
3.2 Port management and terminal operations
Although the port logistics industry before containerization was more labor-intensive, container terminal activity remains a highly capital-intensive industry. As discussed above, larger-size container ships needs high-standard container terminals, handling facilities and equipments. Most of the global major container terminals are operated by (public and private) port operating companies and terminal operators instead of (central and local governmental) port managers (Figure 5), because the operation and management of container terminal needs massive investments and management technology, and has been making profits with the growth of container transport.
[Figure 5]
In general, port management is classified amongst the following four types; 1) central government management, 2) local government management, 3) public enterprise management, and 4) private company management. Types 3) and 4) are consolidated as port operating company as seen in Figure 5. In Type 1), central government management, due to the lack of reliability, agility, and efficient management, is not so much common, except in the case of Hong Kong before the handover to China (1997). However, central governments are concerned by the
development of basic facilities on the sea and port side (waterways, breakwater, and infrastructure). Most ports are managed by Type 2) local governments (European major ports, the ports of Los Angeles, Long Beach, Miami, and Everglade, Japanese major ports) and Type 3) public firms because of the large local economic impacts of port activities. Type 3) public businesses are divided into some cases based on the independence of budget and decision making on port business and planning. For example, local governments established public firms (i.e. government-affiliated firms, such as Korea Container Terminal Authority and Singapore Port Authority - PSA, before privatization), which manage port operation. They often establish public corporations under specific activity framework at the region level (e.g. Kaohsiung, Keelung, Seattle, and Tacoma). Lastly, a firm, which has public elements and constraints, is established under (general) company law. As the example of Type 4) private company, the ports of United Kingdom (UK) and New Zealand are managed by fully private companies (Doi, 2003).
Port operating types are thus classified into four types based on the construction, ownership, and operation of infra-and super-structure between port manager and port (terminal) operator. In addition, leased home is divided into two types for port facilities (infra-structure and super-structure) (Table 4). About term-leased land, port operator constructs not only super structure (gantry and yard cranes, container yard, shed, and warehouse) but also infra-structure (berthing facilities). For example, most Western ports (i.e. Europe and NA) are leased home without super-structure type. However, the port of Hong Kong is term-leased land without no-profit infrastructure type (or, waterway and breakwater). The terminal operator at Hong Kong pays concession money of terminal development to Hong Kong government, and develops new terminal including landfill, terminal facilities’ construction and their equipment procurements. Although new terminal developed by the operator belongs to Hong Kong government, the operator borrows terminals and operates the terminal. The port of Singapore was also managed by the central government. However, all its terminals were transferred to PSA by privatization in 1997. UK ports were also privatized in the second half of the 1980s (Kurihara, 2014).
[Table 4]
Terminal operators are classified into two types; 1) global stevedores’ terminal operator and 2) global carrier’s terminal operators (Table 5). The first type (1) is a pre-play company focused on port service business. Most of stevedores mainly operate at their home-base and neighboring areas focusing on competitive and efficient operations. For example, although HPH has 52 terminals in 26 countries in 2017, they have 9 terminals in China and Hong Kong. The second type (2) is divided into two sub-types. On the one hand, terminal operation is focused as profit center inside their group company working for other shipping lines. On the other hand, the
second case is focused as cost center for more efficient operations inside their group company’s shipping network. In the past, major carriers had been making their global terminal operation supporting maritime business of their mother companies (or, cost center). However, under difficult situations in a sensitive shipping market (cf. Figure 2), port service business’ profit has become more stable than maritime business. Therefore, some shipping lines changed their terminal service not only for own shipping lines but also other (competitive) shipping lines and group at their own / dedicated terminals for getting lower handling charges. Nowadays, about 80% of total container throughput at terminals are handled by global operators, and this share has been increasing (78.8% in 2015, cf. Table 6).
[Table 5] [Table 6]
4. Global maritime container shipping
It is now well-known that horizontal integration pushed shipping lines to deploy global
networks by the principle of merger and acquisition, such as Maersk (Frémont, 2007) and
CMA-CGM (Frémont, 2015), although there are variants in the way this process had
taken place among companies and among regions (Slack and Frémont, 2009). Global
maritime container flows are currently transported by a handful of large companies, often
through alliances, with a growing concentration that accelerated after the 2008 Financial
Crisis (see Table 7), which led to important turmoil in the shipping industry until the
bankruptcy of Hanjin Shipping in 2017. Other companies adopted the strategy of slow
steaming, defined by decreasing travel speed and increased vessel size, to increase
economies of scale, save fuel and money, and at the same time, send to scrap their older
or smaller vessels. Certain shipping, to avoid financial losses, even reincorporated
favorable sailing winds in their route operations to save even more fuel and money. In the
meantime, other costs are trying to be levied through China’s efforts to build a
round-the-world Maritime Silk Road (Wang et al., 2018), trying to bypass Panama Canal costs
through the project of a new Nicaragua Canal, and to bypass the Suez Canal through a
railway land bridge through Israel, as well as a through Myanmar to avoid the Malacca
Straits. The pattern of global shipping is thus still changing very fast and a lot of research
remains to be done to foresee what will be routes of the future. For the rest, the Arctic
passage, should it be Canadian or Russian, is still not yet a reality and is a very minor
priority for container shipping given all the geopolitical, technical, and financial issues
not resolved yet.
[Table 7]
A glimpse of what the current (or recent) world pattern of maritime container flows is
proposed in Figure 6, where we can see the major routes and trunk lines’ distribution
across the globe. Regional integration in East Asia and the major link between Europe
and Asia are responsible for the concentration in these parts of the world, notwithstanding
an important share of Trans-Pacific trade, bur which is more imbalanced due to the large
proportion of boxes returning empty from NA to Asia (see also Table 2).
[Figure 6]
The aforementioned changes and dynamics are examined in this section in two ways.
First, we recall the main operational aspects of shipping lines to give a better
understanding on how they design their various liner shipping services. Second, we
provide some empirical evidence on how these economic and operational aspects have
affected the distribution of global shipping flows in the last decade.
4.1 Operational aspects of liner shipping services
Apparently very complex, the way shipping lines organize their services is based on
numerous factors but a few key principles, as seen in Figure 7. All is a matter of business
profitability, but with the exception, compared with other businesses, of geographic
aspects that shipping lines cannot avoid. They thus analyze the route along which ships
should be deployed (fleet), and in the meantime, zoom on the route to select the best ports
of call according to multiple criteria that are so much researched in the literature. Why
this port and not another is not a straightforward question, which has to do with efficiency,
performance, technical quality and capacity, handling costs, and presence of specific
arrangement with terminal operators, finally the proximity or not to the end markets
(Tiwari et al., 2003; Tongzon, 2009). Shipping lines are often said to be “footloose” in
terms of port selection because they keep a certain margin in the case of disruption in
transport chains (Achurra-Gonzalez et al., 2017), due to many causes (dockers’ strikes,
natural disasters, etc.). Then come the choice of service shipping lines offer to their
customers (mainly, shippers) to satisfy their needs. Volatility, freight rate fluctuation, and
seasonality also come into play.
The main configuration is based on “bundling” as a key driver of container service design.
This can take place at two levels: individual liner service or bundling by
combining/linking two or more liner services. The first aims to “collect container cargo
by calling at various ports along the route instead of focusing on an end-to-end service”
(Ducruet and Notteboom, 2012). This service is a set of several roundtrips of several
vessels having in common calling patterns (i.e. order of port calls) and time intervals (i.e.
frequency) between consecutive port calls. The overlap of all these roundtrips provide an
optimal calling frequency. It is important to note that bundling can be symmetric or
asymmetric; in the latter case, different ports of calls are used on the way back. In general,
carriers select about five ports of call per loop, keeping in mind that increases in vessel
size may have even decreased the number of ports of call. Two extreme forms of line
bundling are round-the-world services and pendulum services.
Another option is to bundle container lines by combining two or more liner services as
follows: hub-and-spoke network (hub/feeder), interlining, and relay. On their side,
governments and port authorities invested heavily in the development of specific
redistribution nodes to make it happen, called “intermediate hubs” (Rodrigue and
Notteboom, 2010). Such hubs should provide good nautical accessibility, proximity to
main shipping lanes and ownership, in whole or in part, by carriers or multinational
terminal operators, most of those being located along the East-West circumterrestrial
trunk line, “in-between” main producer or consumer markets. Their pivotal role
complements the one of so-called “gateway ports” within those markets to access final
consumers through hinterland services. Container carriers use both gateways and hubs to
design their services in the most efficient way possible, but it was demonstrated that the
same node is often “dedicated” to one main shipping line (Frémont and Soppé, 2009),
just like terminal operators, through concession agreements (Notteboom et al., 2012).
Another strategy of shipping lines is to focus on a preferential corridor development by
investing gateways and inland ports (Franc and Van der Horst, 2010), often through
vertical integration, especially in countries where the transport sector is more liberalized
(Ducruet and Van der Horst, 2009).
4.2 The evolution of flow patterns
One simple and classic way to investigate how have container port traffic patterns evolved
under the aforementioned circumstances is to look at two famous concentration indices,
namely Gini coefficient and Herfindahl-Hirschman Index (HHI) (Figure 8). The latter
index exhibits a clear tendency towards a de-concentration as many more ports are
constructed and adopt the “container revolution” through successive diffusion waves
across the world (Guerrero and Rodrigue, 2014). Thus, the bulk of global container port
traffic is less and less concentrated in the top of the world hierarchy overtime. In
opposition, but without being contradictory to the previous observation, there is a
tendency (cf. Gini coefficient) for this traffic to be increasingly concentrated across space,
despite a less clear-cut trend and several fluctuations. For example, although the
concentration (Gini coefficient) of port traffic in Asia had been stable between 1985 and
2005, the gaps inside Southeast, South and West Asia, or containerized backward regions,
had been expanding (Itoh, 2012). We cannot observe a paramount concentration but this
is the trend until the early 2000s as containerization has been highly selective and
concentrated around large hubs and gateways, until a process of de-concentration
occurred, already exemplified by the pioneering work of Hayuth (1981) on the matter.
The global shift of manufacturing from the Western to the Asian world is also responsible
for such a mixed evidence, including the “China effect”, especially since its integration
in the WTO in 2001.
[Figure 8]
Another but complementary way to understand the evolution of the global pattern of
container flows is to apply one of the simplest graph-theoretical algorithms to the
unweighted inter-port matrix of vessel flows (Figure 9), namely the Gamma index, often
coined “density” in the network-analytical literature, i.e. the proportion of observed links
(or “edges”) in the maximum possible number of links in the network (see Ducruet and
Lugo, 2013 for a review of transportation network measures). The clear decline proves
that at least until the late 1990s and early 2000s, global container flows went through a
process of rationalization and simplification, i.e. a lesser number of linkages compared
with the number of ports, resulting in a star-like configuration, or hub-and-spokes, as a
consequence of the aforementioned strategies of shipping lines when designing their
networks and selecting large hubs. Despite a revival and re-densification of the network
afterwards especially just after the global financial crisis, the latter shifted again towards
centralization so that the last value of 2016 is the lowest of the time-series. This means a
lot about global trade and connectivity in terms of vulnerability vs. robustness, as the
routes of the past have been replaced by ever-more efficient and optimal routes centered
around large hubs and gateways, but at the expense of smaller, medium-size ports that
cannot access the rest of the network without passing through this recently installed
redistribution platforms.
[Figure 9]
5. Conclusion
This chapter recalled and demonstrated deep changes in the way maritime transport had been reorganized with the ongoing advent of containerization in the past decades up to nowadays. This multifaceted approach to containerization is not so common as often, specific aspects are well covered and analyzed by scholars and professionals but without offering an all-encompassing view. Reviewing the complex and changing relationships between containerization (technological change) and economic development, port and shipping line operations, and related impacts on former ways of doing things is necessary before widening the approach to other segments of the global value and supply chain, such as hinterlands and shipping networks, as seen in the following chapters. We wish this book to become a useful if not a key reference to scholars, students, but also experts and practitioners for a better understanding of past, current, and future transformations of transport and logistics systems serving our world as a whole.
References
Achurra-Gonzalez P., Angeloudis P., Zavitsas K., Niknejad A., Graham D.J. (2017) Attacker-defender modelling of vulnerability in maritime logistics corridors. In: Ducruet (Ed.),
Advances in Shipping Data Analysis and Modeling. Tracking and Mapping Maritime Flows in the Age of Big Data. Routledge Studies in Transport Analysis, Routledge: London & New
York, pp. 297-315.
Bernhofen D.M., El-Sahli Z., Kneller R. (2013) Estimating the effects of the container revolution
on world trade. Lund University Working Paper 2013:4, Department of Economics, School of
Economics and Management.
Cullinane K.P.B., Khanna M. (2000) Economies of scale in large containerships: optimal size and geographical implications. Journal of Transport Geography, 8(3): 181-195.
Doi M (Ed.) (2003) Economics of Ports and Regions, Tokyo, Taga-Shuppan. (in Japanese) Ducruet C., Berli J. (2018) Mapping the globe: the patterns of mega-ships. Port Technology
International, 77: 94-96.
Ducruet C., Berli J., Bunel M. (2018) Geography vs. topology in the evolution of the global container shipping network (1977-2016). In: Wilmsmeier G., Monios J. (Eds.), Geographies
of Maritime Transport, Edward Elgar Publishing (forthcoming).
and applications. In: Rodrigue J.P., Notteboom T.E., Shaw J. (Eds.), The SAGE Handbook of
Transport Studies, SAGE Publications, pp. 347-364.
Ducruet C., Notteboom T.E. (2012) Developing liner service networks in container shipping. In: Song, D.W., Panayides, P. (Eds.), Maritime Logistics: A Complete Guide to Effective Shipping
and Port Management, Kogan Page, pp. 77-100.
Ducruet C., Van der Horst M.R. (2009) Transport integration at European ports: Measuring the role and position of intermediaries. European Journal of Transport and Infrastructure
Research, 9(2): 121-142.
Franc P., Van der Horst M.R. (2010) Analyzing hinterland service integration by shipping lines and terminal operators in the Hamburg-Le Havre range. Journal of Transport Geography, 18(4): 557-566.
Frémont A. (2007) Global maritime networks: The case of Maersk. Journal of Transport
Geography, 15(6): 431-442.
Frémont A. (2015) A geo-history of maritime networks since 1945. The case of the Compagnie Générale Transatlantique’s transformation into CMA-CGM. In: Ducruet C. (Ed.), Maritime
Networks: Spatial Structures and Time Dynamics, Routledge Studies in Transport Analysis,
London and New York, pp. 37-49.
Frémont A., Soppé M. (2007) Northern European Range: Shipping line concentration and port hierarchy. In: Wang J.J., Olivier D., Notteboom T.E., Slack B. (Eds.), Ports, Cities, and Global
Supply Chains. Aldershot: Ashgate, pp. 105-120.
Guerrero D., Rodrigue J.P. (2014) The waves of containerization: shifts in global maritime transportation. Journal of Transport Geography, 35: 151-164.
Hayuth Y. (1981) Containerization and the load center concept. Economic Geography, 57(2): 160-176.
Hoshino H. (1995) The impacts of Containerization to International Logistics. The
Containerization, 272. (in Japanese)
Itoh H. (2002) Efficiency changes at major container ports in Japan: a window application of Data Envelopment Analysis. Review of Urban & Regional Development Studies, 14(2): 133-152. Itoh H. (2012) Structural Changes in Port Cargo Flow Distribution in Asian Container Port
Systems. the proceeding at the International Association of Maritime Economist (IAME)
Annual Conference, 6-8 September, 2012, Taipei, Taiwan.
Kurihara Y. (2014) The global trend of port service industry. Mitsui & Co. Global Strategic Studies Institute. (in Japanese)
Morel J.C., Ducruet C. (2015) Interview - The man who brought containerisation to Europe.
Portus Online, 29:
Levinson M. (2006) The Box: How the Shipping Container Made the World Smaller and the World
Economy Bigger. Princeton University Press.
Mori T. (2018) Introduction to Modern Logistics. 3rd Edition, Tokyo, Dobunkan Publisher. (in Japanese)
Notteboom T.E. (2016) The adaptive capacity of container ports in an era of mega vessels: The case of upstream seaports Antwerp and Hamburg. Journal of Transport Geography, 54: 295-309.
Notteboom T.E., Pallis A.A., Farrell S. (2012) Guest editorial: Terminal concessions in seaports revisited. Maritime Policy and Management, 39(1): 1-5.
Ohmae K. (1985) Triad Power: The Coming Shape of Global Competition. Paris: Flammarion (translation in French).
Rodrigue J.P. (2017) The Geography of Transport Systems. 4th Edition, New York, Routledge. Rodrigue J.P., Notteboom T.E. (2010) Foreland-based regionalization: Integrating intermediate
hubs with port hinterlands. Research in Transportation Economics, 27(1): 19-29.
Slack B., Frémont A. (2009) Fifty years of organisational change in container shipping: regional shift and the role of family firms. Geojournal, 74(1): 23-34.
Tiwari P., Itoh H, Doi M. (2003) Shippers' port and carrier selection behaviour in China: a discrete choice analysis. Maritime Economics & Logistics, 5(1): 23-39.
Tongzon J. (2001) Efficiency measurement of selected Australian and other international ports using data envelopment analysis. Transportation Research Part A, 35: 107-122.
Tongzon J. (2009) Port choice and freight forwarders. Transportation Research Part E, 45: 186-195.
Wang J.J., Chen M.C. (2010) From a hub port city to a global supply chain management center: A case study of Hong Kong. Journal of Transport Geography, 18(1): 104-115.
Wang L., Zhu Y., Ducruet C., Bunel M., Lau Y.Y. (2018) From hierarchy to networking : The evolution of the 21st century Maritime Silk Road’ container shipping system, Transport
Reviews, 38(4) : 416-435.
Xu H., Itoh H. (2018) Density economies and transport geography: Evidence from the container shipping industry. Journal of Urban Economics, 105: 121-132.
Table 1: The container handling ranking changes at ports
(unit: thousand TEUs)(Data) Containerization International Yearbook (-2009), and UNCTAD Stat (2010-2016).
1 NY/NJ 1,730 NY / NJ 1,947 Rotterdam 2,655 Singapore 5,220 Hong Kong 12,550 2 Rotterdam 1,079 Rotterdam 1,901 NY/NJ 2,367 Hong Kong 5,100 Singapore 11,846 3 Kobe 905 Hong Kong 1,465 Hong Kong 2,289 Rotterdam 3,670 Kaohsiung 5,232 4 San Juan 877 Kobe 1,456 Kaohsiung 1,901 Kaohsiung 3,490 Rotterdam 4,787
5 Hong Kong 802 Kaohsiung 979 Kobe 1,857 Kobe 2,600 Busan 4,503
6 Oakland 522 Singapore 917 Singapore 1,699 Busan 2,350 Hambrug 2,890
7 Seattle 481 San Juan 852 Yokohama 1,327 Los Angeles 2,120 Yokohama 2,757 8 Baltimore 421 Long Beach 825 Antwerp 1,243 Hambrug 1,970 Los Angeles 2,555 9 Bremen 410 Hambrug 783 Long Beach 1,172 NY / NJ 1,900 Long Beach 2,390
10 Long Beach 391 Oakland 782 Hambrug 1,159 Keelung 1,810 Antwerp 2,329
11 Tokyo 369 Seattle 782 Keelung 1,158 Yokohama 1,650 NY / NJ 2,276
12 Melbourne 365 Antwerp 724 Busan 1,115 Long Beach 1,600 Tokyo 2,177
13 Keelung 246 Yokohama 722 Los Angeles 1,104 Tokyo 1,560 Keelung 2,170
14 Hambrug 326 Bremen 703 Tokyo 1,004 Antwerp 1,550 Dubai / Jebel Ali 2,073
15 Antwerp 297 Keelung 660 Bremen 986 Felixstowe 1,420 Felixstowe 1,898
16 Virginia 292 Busan 634 San Juan 882 San Juan 1,380 Manila 1,668
17 Sydney 262 Los Angeles 633 Oakland 856 Seattle 1,170 San Juan 1,593
18 London 260 Tokyo 632 Seattle 845 Bremen 1,160 Oakland 1,550
19 Yokohama 329 Jeddah 563 Felixstowe 726 Oakland 1,120 Shanghai 1,527
20 Le Havre 232 Baltimore 523 Baltimore 706 Manila 1,039 Bremen 1,526
1975 1980 1985 1990 1995
1 Hong Kong 18,100 Singapore 23,192 Shanghai 29,069 Shanghai 36,537 Shanghai 37,130 2 Singapore 17,040 Hong Kong 22,427 Singapore 28,431 Singapore 30,922 Singapore 30,900 3 Busan 7,540 Shanghai 18,084 Hong Kong 23,699 Shenzhen 24,204 Shenzhen 23,979 4 Kaohsiung 7,426 Shenzhen 16,197 Shenzhen 22,510 Ningbo 20,620 Ningbo 21,560 5 Rotterdam 6,280 Busan 11,843 Busan 14,194 Hong Kong 20,114 Busan 19,850 6 Shanghai 5,613 Kaohsiung 9,471 Ningbo 13,144 Busan 19,469 Hong Kong 19,580 7 Los Angeles 4,879 Rotterdam 9,300 Guangzhou 12,550 Guangzhou 17,625 Guangzhou 18,885 8 Long Beach 4,601 Hamburg 8,088 Qingdao / Tsingtao 12,012 Qingdao / Tsingtao 17,510 Qingdao / Tsingtao 18,000 9 Hambrug 4,248 Dubai / Jebel Ali 7,619 Dubai / Jebel Ali 11,600 Dubai / Jebel Ali 15,592 Dubai / Jebel Ali 14,772 10 Antwerp 4,082 Los Angeles 7,485 Rotterdam 11,146 Tianjin 14,100 Tianjin 14,500 11 Shenzhen 3,994 Long Beach 6,710 Tianjin 10,080 Rotterdam 12,235 Port Kelang 13,183 12 Port Kelang 3,207 Antwerp 6,482 Kaohsiung 9,181 Port Kelang 11,890 Rotterdam 12,385 13 Dubai / Jebel Ali 3,059 Qingdao / Tsingtao 6,307 Port Kelang 8,870 Kaohsiung 10,264 Kaohsiung 10,465 14 NY / NJ 3,050 Port Kelang 5,716 Antwerp 8,468 Antwerp 9,654 Antwerpen 10,037
15 Tokyo 2,899 Ningbo 5,208 Hamburg 7,900 Dalian 9,450 Dalian 9,614
16 Felixstowe 2,853 Tianjin 4,801 Tanjung Perapus 6,530 Xiamen 9,183 Xiamen 9,414 17 Bremen 2,712 NY / NJ 4,793 Long Beach 6,263 Tanjung Perapus 9,120 Hamburg 8,910 18 Gioia Tauro 2,653 Guangzhou 4,685 Xiamen 5,820 Hamburg 8,821 Los Angeles 8,857 19 Tanjung Priok / Jakarta2,476 Tanjung Pelepas 4,177 NY / NJ 5,292 Los Angeles 8,160 Tanjung Perapus 8,029 20 Yokohama 2,317 Laem Chabang 3,766 Dalian 5,242 Long Beach 7,192 Laem Chabang 7,227
2016
Table 2: World Container Movements
(unit: thousand TEUs)(a) 1998
Origin/Destination North America Europe East/Southeast Asia North America - 2,036 (5.7%) 3,338 (9.4%)
Europe 1,509 (4.2%) - 2,296 (6.5%)
East/Southeast Asia 5,938 (16.7%) 4,246 (12.0%) 5,873 (16.5%) (Note) The estimated total container handling volumes are 35,528,000 TEUs.
(Data) MOL Research Institute (1999).
(b) 2016
Origin/Destination North America Europe East/Southeast Asia North America 482 (0.3%) 2,048 (1.3%) 7,252 (4.7%)
Europe 3,913 (2.6%) 6,928 (4.5%) 7,022 (4.6%) East/Southeast Asia 16,708 (10.9%) 15,049 (9.8%) 39,214 (25.6%)
(Note) The estimated total container handling volumes are 153,270,049 TEUs. (Data) Japan Maritime Public Relations Center (2017).
Table 5: The classification of global/international terminal operators
Classification Management type Ex.
Stevedores Profit center
Public company PSA International, DP World, HHLA Private company Hatchison Port Handling (HPH), Eurogate, SSA Marine, Dragados, Crup TCB, ICTSI
Carriers
Cost center Private company Public company CMA/CGM, Evergreen, APL, Hanjin, K-line, Terminal Investment Limited (TIL) MISC, MOL, Yang Ming, Hyundai (HMM) Profit center Private company Public company COSCO Pacific APMT, NYK
(Source) Mori (2018).
Table 6: Global/International terminal operators’ throughput
(Data) Drewry (2017), Global Container Terminal Operators: Annual Review and Forecast.
Operator Million TEU Share (%)
1 China COSCO Shipping 85.5 12.2%
2 Hatchison Ports 79.1 11.3%
3 APM Terminals 71.4 10.2%
4 PSA International 67.3 9.6%
5 DP World 62.4 8.9%
6 Terminal Investment Limited (TIL) 37.7 5.4%
7 China Merchants Port Holdings 28.5 4.1%
8 CMA CGM 16.6 2.4%
9 Hanjin 14.0 2.0%
10 Eurogate 11.9 1.7%
11 SSA Marine / Carrix 10.6 1.5%
12 NYK 9.6 1.4%
13 Evergeen 9.4 1.3%
14 ICTSI 8.7 1.2%
15 OOCL 6.7 1.0%
16 China Shipping Terminal Development 6.4 0.9%
17 MOL 5.9 0.8%
18 Yildirim / Yilport 5.6 0.8%
19 Yang Ming 4.4 0.6%
20 Bollore 4.3 0.6%
555.1 79.4% Global/International Operators Total
Table 7: The four major alliances on the east-west trades in 2015
Source: Frémont (2015)
Alliance
Carriers
Country
Market share (%) on
the Asia-North
Europe trade
G6
American President Line
Singapore
24
Hapag Lloyd
Germany
Hyundai Merchant Marine
South Korea
Mtsui OSK Line
Japan
NYK Line
Japan
Orient Overseas Container
Line
Hong Kong
CKYHE
COSCO
China
24
K Line
Japan
Yang Ming
Taiwan
Hanjin Shipping
South Korea
Evergreen
Taiwan
2M
Maersk
Danemark
31
MSC
Switzerland
Ocean
Three
CMA-CGM
France
21
China shipping (CSCL)
China
Figure 1: The relative expanding speeds of maritime trade
Figure 2: The increasing rate changes of container, dry cargo, and GDP
Figure 3: The shares for global total by countries/regions
(a) Container handling volumes
(Data) Based on the data from Table A2 (a).
(b) Gross Domestics Products (GDP)
Figure 4: The correlation coefficients between GDP and container shares
Figure 5: Container port management system
Terminal Service Handling Service
Port Manager Port Operating Company
Terminal Operator
Port transport service provider
Port User
Handling Charge Use fees
Fees for facilities and operation Use rights
Figure 6: Global maritime container flows in 2016
Figure 7: The process of liner service design
Figure 8: Global container port traffic concentration, 1977-2016
Source: own elaboration based on Lloyd’s List Intelligence data
N.B. calculations realized using Wessa software, https://www.wessa.net
Figure 9: Global container network concentration, 1977-2016
Appendix:
Table A1: Average growth rates by countries/regions
(a) Container handling volumes
(Note) West Germany and East Germany are integrated as Germany before 1990. And, Hong Kong is excluded in China for constant discussion.
(b) Gross Domestic Products (GDP)
(Note) The GDP data of Taiwan is not available on the World Bank Open Data.
1975-1980 1980-1985 1985-1990 1990-1995 1995-2000 2000-2005 2005-2010 2010-2015 USA 10.5% 6.3% 5.7% 4.6% 7.5% 7.2% 4.6% 1.0% Canada 12.1% 7.5% 7.2% 3.1% 16.3% 7.4% 3.2% 4.0% Germany 15.3% 8.8% 7.8% 6.4% 11.8% 12.1% -0.2% 9.3% Spain 22.8% 16.7% 5.2% 10.7% 12.9% 9.7% 6.8% 3.0% Netherlands 12.6% 6.2% 6.5% 5.4% 5.7% 8.3% 4.2% 2.1% Belgium 13.7% 10.3% 5.3% 8.8% 12.1% 9.4% 7.5% 0.4% Italy 31.3% 4.8% 3.5% 10.9% 18.6% 7.4% -0.1% 1.0% UK 10.5% 5.1% 7.0% 3.2% 6.7% 5.6% 1.8% 5.8% France 22.4% 7.2% 1.3% 2.4% 11.6% 6.6% 3.1% 4.2% Sweden 9.4% 8.9% 0.2% 9.7% 3.9% 7.9% -0.5% 3.4% Ireland 8.2% 1.9% 7.6% 8.8% 9.4% 6.2% -3.7% 2.3% Denmark 39.2% 6.1% -1.4% 4.4% 4.5% 14.4% -37.2% -1.0% China 65.3% 53.1% 26.8% 93.4% 19.5% 11.1% 16.6% 6.9% Hong Kong 13.3% 9.4% 17.5% 19.9% 7.7% 4.6% 1.2% -3.0% Japan 13.6% 10.3% 7.7% 6.0% 4.6% 5.5% 1.6% 2.3% Korea 32.8% 13.3% 13.9% 14.1% 15.0% 11.1% 4.5% 6.6% Taiwan 28.8% 13.8% 12.7% 7.6% -20.9% 4.1% 0.6% 2.5% Singapore 33.2% 13.3% 25.3% 17.8% 7.6% 6.6% 5.2% 1.8% Malaysia 21.2% 18.1% 18.2% 18.6% 17.8% 22.0% 8.5% 5.7% Indonesia 49.2% 23.6% 33.5% 17.4% 18.4% 7.9% 11.0% 8.4% Thailand 94.7% 16.3% 22.0% 12.8% 10.4% 10.0% 5.4% 5.1% Vietnam 16.8% 18.7% 8.7% Philippines 36.3% 8.8% 17.2% 8.3% 10.4% 3.7% 7.5% 7.3% India 224.8% 22.9% 12.0% 15.1% 12.6% 15.3% 13.1% 5.6% Brazil 74.7% 31.6% 3.1% 16.0% 12.8% 19.9% 5.1% 6.4% Australia 10.4% 3.7% 4.1% 6.9% 9.3% 8.0% 4.9% 3.4% Turkey 117.7% 15.2% 16.3% 42.1% 16.3% 14.1% 7.4% UAE 58.7% 16.6% 17.6% 17.9% 27.2% 14.6% 9.7% 7.1% Saudi Arabia 80.9% 3.8% -3.4% 7.7% 6.7% 75.1% 7.5% 8.2% 1970-1975 1975-1980 1980-1985 1985-1990 1990-1995 1995-2000 2000-2005 2005-2010 2010-2015 USA 2.7% 3.7% 3.4% 3.4% 2.6% 4.3% 2.5% 0.8% 2.2% Canada 4.4% 3.7% 2.7% 2.6% 1.7% 4.0% 2.6% 1.2% 2.2% Germany 2.4% 3.4% 1.4% 3.3% 2.1% 1.9% 0.6% 1.3% 1.7% Spain 5.3% 2.0% 1.4% 4.5% 1.5% 4.1% 3.4% 1.1% -0.2% Netherlands 3.3% 2.6% 1.1% 3.4% 2.3% 4.3% 1.3% 1.3% 0.8% Belgium 3.7% 3.2% 0.9% 3.1% 1.6% 2.9% 1.8% 1.4% 1.0% Italy 3.2% 4.5% 1.7% 3.1% 1.3% 2.0% 0.9% -0.3% -0.6% UK 2.1% 2.3% 2.4% 3.5% 1.6% 3.3% 2.8% 0.4% 2.1% France 3.9% 3.4% 1.6% 3.4% 1.3% 2.9% 1.7% 0.8% 1.0% Sweden 2.6% 1.4% 2.0% 2.4% 0.7% 3.6% 2.6% 1.7% 2.1% Ireland 4.9% 4.6% 2.6% 4.7% 4.7% 9.4% 5.6% 0.8% 7.7% Denmark 1.7% 2.7% 2.8% 1.5% 2.3% 3.0% 1.3% 0.3% 1.1% China 5.9% 6.6% 10.7% 8.0% 12.3% 8.6% 9.8% 11.3% 7.9% Hong Kong 6.6% 11.6% 5.8% 7.8% 5.3% 2.7% 4.3% 4.0% 3.0% Japan 4.6% 4.4% 4.3% 5.0% 1.6% 1.1% 1.2% 0.2% 1.0% Korea 10.0% 8.6% 9.4% 10.5% 8.4% 5.7% 4.7% 4.1% 3.0% Taiwan Singapore 9.6% 8.6% 6.9% 8.7% 8.7% 5.7% 4.9% 6.9% 4.1% Malaysia 7.2% 8.6% 5.2% 6.9% 9.5% 5.0% 4.8% 4.6% 5.3% Indonesia 7.0% 7.9% 4.8% 6.3% 7.1% 1.0% 4.7% 5.7% 5.5% Thailand 5.8% 8.0% 5.4% 10.3% 8.2% 0.9% 5.5% 3.8% 2.9% Vietnam 3.8% 4.8% 8.2% 7.0% 6.9% 6.3% 5.9% Philippines 5.8% 6.1% -1.1% 4.7% 2.2% 3.6% 4.6% 5.0% 5.9% India 2.9% 3.2% 5.2% 6.0% 5.1% 6.1% 6.7% 8.3% 6.8% Brazil 10.3% 6.7% 1.2% 2.3% 3.1% 2.1% 2.9% 4.5% 1.1% Australia 3.2% 2.8% 2.9% 4.0% 2.4% 4.2% 3.2% 2.8% 2.7% Turkey 5.8% 2.5% 4.9% 5.7% 3.3% 4.1% 4.9% 3.4% 7.1% UAE 16.2% -1.3% 3.3% 3.8% 5.6% 5.4% 2.5% 4.9% Saudi Arabia 15.0% 7.5% -9.9% 7.6% 3.7% 1.7% 4.1% 2.8% 5.2%
Table A2: The relative shares for global total by countries/regions
(a) Container handling volumes
(Note) West Germany and East Germany are integrated as Germany before 1990. And, Hong Kong is excluded in China for constant discussion.
(b) Gross Domestic Products (GDP)
(Note) The GDP data of Taiwan is not available on the World Bank Open Data.
1975 1980 1985 1990 1995 2000 2005 2010 2015 USA 30.3% 23.1% 20.6% 17.8% 13.9% 11.8% 9.8% 8.3% 7.0% Canada 2.5% 2.0% 1.9% 1.8% 1.3% 1.3% 1.1% 0.9% 0.8% Germany 4.2% 4.0% 4.0% 3.8% 3.2% 3.3% 3.5% 2.3% 2.8% Spain 1.5% 1.9% 2.7% 2.3% 2.3% 2.5% 2.3% 2.3% 2.1% Netherlands 6.5% 5.5% 5.0% 4.4% 3.6% 2.8% 2.4% 2.1% 1.8% Belgium 2.8% 2.5% 2.6% 2.2% 2.1% 2.2% 2.0% 2.0% 1.6% Italy 1.8% 3.3% 2.7% 2.1% 2.2% 3.0% 2.5% 1.8% 1.5% UK 8.0% 6.1% 5.2% 4.7% 3.4% 2.8% 2.1% 1.5% 1.6% France 2.3% 2.9% 2.7% 1.8% 1.2% 1.3% 1.0% 0.8% 0.8% Sweden 1.2% 0.8% 0.8% 0.6% 0.5% 0.4% 0.3% 0.2% 0.2% Ireland 1.2% 0.6% 0.5% 0.4% 0.4% 0.3% 0.2% 0.1% 0.1% Denmark 1.2% 0.9% 0.8% 0.4% 0.3% 0.2% 0.2% 0.1% 0.1% China 0.0% 0.1% 0.8% 1.4% 12.6% 17.7% 17.2% 25.4% 28.3% Hong Kong 4.6% 3.9% 4.1% 6.0% 9.1% 7.8% 5.8% 4.3% 2.9% Japan 10.7% 9.2% 9.9% 9.3% 7.7% 5.7% 4.4% 3.3% 2.9% Korea 1.1% 1.8% 2.2% 2.7% 3.3% 3.9% 3.9% 3.4% 3.7% Taiwan 2.7% 4.4% 5.5% 6.4% 5.7% 4.5% 3.3% 2.4% 2.1% Singapore 1.3% 2.5% 3.0% 6.1% 8.6% 7.4% 5.9% 5.3% 4.6% Malaysia 0.4% 0.5% 0.7% 1.0% 1.5% 2.0% 3.1% 3.3% 3.5% Indonesia 0.0% 0.2% 0.4% 1.1% 1.5% 1.6% 1.4% 1.5% 1.7% Thailand 0.1% 0.5% 0.7% 1.3% 1.4% 1.4% 1.3% 1.2% 1.2% Vietnam 0.0% 0.0% 0.0% 0.0% 0.0% 0.5% 0.6% 1.1% 1.3% Philippines 0.5% 1.2% 1.1% 1.6% 1.4% 1.3% 0.9% 0.9% 1.0% India 0.0% 0.4% 0.7% 0.8% 1.0% 1.1% 1.3% 1.7% 1.7% Brazil 0.3% 0.4% 1.1% 0.8% 1.0% 1.0% 1.4% 1.3% 1.4% Australia 4.3% 3.2% 2.5% 1.9% 1.7% 1.5% 1.3% 1.2% 1.1% Turkey 0.0% 0.0% 0.3% 0.4% 0.5% 0.7% 0.8% 1.1% 1.2% UAE 0.0% 0.9% 1.3% 1.8% 2.6% 2.2% 2.5% 2.8% 3.1% Saudi Arabia 0.0% 2.2% 1.7% 0.9% 0.8% 0.6% 1.0% 1.0% 1.1% Others 10.5% 14.9% 14.4% 14.1% 5.1% 7.2% 16.4% 16.6% 16.5% 1975 1980 1985 1990 1995 2000 2005 2010 2015 USA 23.7% 23.5% 24.3% 23.9% 24.4% 25.4% 24.8% 22.7% 22.0% Canada 2.8% 2.8% 2.8% 2.7% 2.6% 2.7% 2.6% 2.4% 2.4% Germany 7.5% 7.3% 6.9% 6.8% 6.7% 6.2% 5.5% 5.2% 4.9% Spain 2.6% 2.3% 2.2% 2.3% 2.2% 2.3% 2.3% 2.2% 1.9% Netherlands 1.6% 1.5% 1.4% 1.4% 1.4% 1.5% 1.4% 1.3% 1.2% Belgium 1.0% 1.0% 0.9% 0.9% 0.8% 0.8% 0.8% 0.7% 0.7% Italy 4.8% 5.0% 4.7% 4.6% 4.4% 4.1% 3.7% 3.2% 2.7% UK 4.8% 4.4% 4.4% 4.3% 4.2% 4.2% 4.1% 3.7% 3.6% France 5.5% 5.4% 5.1% 5.0% 4.8% 4.7% 4.4% 4.0% 3.7% Sweden 1.1% 0.9% 0.9% 0.8% 0.8% 0.8% 0.8% 0.7% 0.7% Ireland 0.2% 0.2% 0.2% 0.2% 0.2% 0.3% 0.4% 0.3% 0.4% Denmark 0.7% 0.7% 0.7% 0.6% 0.6% 0.6% 0.5% 0.5% 0.5% China 1.1% 1.2% 1.8% 2.2% 3.5% 4.5% 6.1% 9.2% 11.8% Hong Kong 0.1% 0.2% 0.2% 0.3% 0.3% 0.3% 0.3% 0.3% 0.3% Japan 10.4% 10.7% 11.6% 12.4% 12.0% 10.7% 9.8% 8.6% 7.9% Korea 0.4% 0.5% 0.7% 1.0% 1.3% 1.4% 1.5% 1.7% 1.7% Taiwan 0.0% 0.0% 0.0% 0.0% 0.0% 0.0% 0.0% 0.0% 0.0% Singapore 0.1% 0.1% 0.1% 0.2% 0.2% 0.3% 0.3% 0.4% 0.4% Malaysia 0.1% 0.2% 0.2% 0.2% 0.3% 0.3% 0.4% 0.4% 0.4% Indonesia 0.5% 0.7% 0.7% 0.8% 1.0% 0.9% 1.0% 1.1% 1.3% Thailand 0.2% 0.2% 0.3% 0.4% 0.5% 0.4% 0.5% 0.5% 0.5% Vietnam 0.0% 0.0% 0.1% 0.1% 0.1% 0.1% 0.1% 0.2% 0.2% Philippines 0.3% 0.3% 0.2% 0.2% 0.2% 0.3% 0.3% 0.3% 0.4% India 1.0% 1.0% 1.1% 1.2% 1.4% 1.6% 1.9% 2.5% 3.0% Brazil 3.2% 3.6% 3.4% 3.1% 3.3% 3.1% 3.1% 3.3% 3.1% Australia 1.7% 1.6% 1.6% 1.6% 1.6% 1.7% 1.7% 1.7% 1.7% Turkey 0.8% 0.8% 0.9% 1.0% 1.0% 1.0% 1.1% 1.2% 1.4% UAE 0.2% 0.4% 0.3% 0.3% 0.4% 0.4% 0.4% 0.4% 0.5% Saudi Arabia 1.1% 1.3% 0.7% 0.8% 0.8% 0.8% 0.8% 0.8% 0.9% Others 22.3% 22.3% 21.6% 20.6% 18.6% 18.5% 19.3% 20.2% 19.8%
Table 3: The changes of container ship sizes
1 2 3 4 5 6 7 8 9
Category Early Cellular Fully Panamax Panamax Max Panamax Post Panamax II Post Panamax New- (very large) VLCS (ultra large) ULCS
Year 1956- 1970s 1980 1985- 1988- 2000- 2014- 2006- 2013- Capacity 500-800 1,000-2,500 3,000-3,400 3,400-4,500 4,000-6,000 6,000-8,500 12,500 11,000-15,000 18,000-21,000 Length(m) 200 215 250 290 300 340 366 397 400 Beam(m) 20 20 32 32 40 43 49 56 59 Draft(m) 9 10 12.5 12.5 13 14.5 15.2 15.5 16 Across 6 10 13 13 15 17 19-20 22 23 High * 4 (4) 5 (4) 6 (5) 8 (6) 9 (5) 9 (6) 10 (6) 10 (8) 10 (8)
(Note) * High is the number of container high on deck, the number in parenthesis is below deck. (Source) Rodrigue (2017).
Table 4: The classification of port management organization and operational form
1. Government With equipment 2. Leased home Without equipment 3. Term-leased land 4. Ownership
development plan and permission Port manager Port manager Port manager Port manager Port manager Operator Construction Infra-
Non-profit
Port manager Port manager Port manager
Port manager Port manager
Operator
Profit Operator Operator
Super- Operator
Ownership
Infra-non-profit
Port manager Port manager Port manager Port manager
Port manager
Operator
Infra-profit Operator
Super- Operator Operator Operator
Operating Port manager Operator Operator Operator Operator Operator
Example Tanjung Priok (Indonesia), Laem Chabang (Thailand), Durban (South Africa), Haifa (Israel) Kaohsiung, (Taiwan) Busan (Korea), Japanese major ports, Seattle (USA), Chinese ports, Dubai (UAE) European major ports (Rotterdam, Humbug), Los Angeles, Long Beach, NY/NJ (USA)
Hong Kong Kaohsiung (Taiwan), Busan (Korea), Leam Chabang (Thailand), Jawaharlal Nehru Port (India) Singapore, UK, New Zealand (Source) Kurihara (2014).