HAL Id: inserm-00461125
https://www.hal.inserm.fr/inserm-00461125
Submitted on 3 Mar 2010
HAL is a multi-disciplinary open access archive for the deposit and dissemination of sci-entific research documents, whether they are pub-lished or not. The documents may come from teaching and research institutions in France or abroad, or from public or private research centers.
L’archive ouverte pluridisciplinaire HAL, est destinée au dépôt et à la diffusion de documents scientifiques de niveau recherche, publiés ou non, émanant des établissements d’enseignement et de recherche français ou étrangers, des laboratoires publics ou privés.
Intracellular Pharmacokinetics of Antiretroviral Drugs
in HIV-Infected Patients, and their Correlation with
Drug Action.
Caroline Bazzoli, Vincent Jullien, Clotilde Le Tiec, Elisabeth Rey, France
Mentré, Anne-Marie Taburet
To cite this version:
Caroline Bazzoli, Vincent Jullien, Clotilde Le Tiec, Elisabeth Rey, France Mentré, et al.. Intracellular Pharmacokinetics of Antiretroviral Drugs in HIV-Infected Patients, and their Correlation with Drug Action.. Clinical Pharmacokinetics, Springer Verlag, 2010, 49 (1), pp.17-45. �10.2165/11318110-000000000-00000�. �inserm-00461125�
1 2 3 4 5
Intracellular pharmacokinetics of antiretroviral drugs
6
in HIV-infected patients and correlation with drug
7
action
8
Caroline Bazzoli1, Vincent Jullien2, Clotilde Le Tiec3, Elisabeth Rey2, 9
France Mentré1, Anne-Marie Taburet3 10
1
INSERM, U738, Paris, France; Université Paris Diderot, UFR de Médecine, Paris, 11
France. 12
2
Université Paris Descartes ; AP-HP ; Groupe Hospitalier Cochin – Saint-Vincent de 13
Paul ; Service de Pharmacologie Clinique ; Inserm U663 14
3
Clinical Pharmacy Department, Hôpital Bicêtre, Assistance Publique hôpitaux de 15
Paris (AP-HP), France. 16
17
Running title: Intracellular pharmacokinetics of antiretrovirals
18 19
27 pages of text 20
9547 words for text only 21
2 Figures (attached file) 22 4 Tables 23 24 25 26 27 28 29
Acknowledgements
1
The authors are no conflicts of interest that are directly relevant to the content of this 2
review. No sources of funding were used to assiste the preparation of this review. 3 4
Correspondence
5 Pr France Mentré 6UMR 738 INSERM - Université Paris Diderot 7
16 rue Henri Huchard 8 75018 Paris, France 9 tel: 33 (0) 1 57 27 75 34 10 fax: 33 (0) 1 57 27 75 21 11 email : france.mentre@inserm.fr 12 13
1
Table of Contents
2 3 ABSTRACT ... 5 4 1 INTRODUCTION ... 7 52 CLINICAL PHARMACOKINETICS OF ARVS ... 8
6 2.1 ENTRY INHIBITORS ... 8 7 2.1.1 CCR5 INHIBITORS ... 8 8 2.1.2 ENFUVIRTIDE... 9 9
2.2 NUCLEOSIDE AND NUCLEOTIDE ANALOG INHIBITORS OF REVERSE TRANSCRIPTASE ... 9
10
2.3 NON NUCLEOSIDE ANALOG INHIBITORS OF REVERSE TRANSCRIPTASE ... 10
11 2.4 INTEGRASE INHIBITORS ... 10 12 2.5 PROTEASE INHIBITORS ... 10 13 3 METHODOLOGICAL CONSIDERATIONS ... 11 14 3.1 CELL COLLECTION ... 11 15
3.2 ESTIMATION OF CELL NUMBER ... 12
16
3.3 ANALYTICAL METHODS FOR INTRACELLULAR ASSAYS ... 12
17
3.3.1 NUCLEOSIDE ANALOG INHIBITORS OF REVERSE TRANSCRIPTASE ... 13
18
3.3.2 NON NUCLEOSIDE ANALOGS AND PROTEASE INHIBITORS ... 15
19
4 MECHANISMS INFLUENCING INTRACELLULAR ACCUMULATION ... 16
20
4.1 GENERAL PRINCIPLES ... 16
21
4.2 NUCLEOSIDE AND NUCLEOTIDE ANALOG INHIBITORS OF REVERSE TRANSCRIPTASE ... 17
22
4.3 NON NUCLEOSIDE ANALOG INHIBITORS OF REVERSE TRANSCRIPTASE ... 18
23
4.4 PROTEASE INHIBITORS ... 18
24
4.5 IMPORTANCE OF GENETIC POLYMORPHISM ... 19
25
5 CLINICAL STUDIES WITH INTRACELLULAR CONCENTRATIONS ... 20
26
5.1 RELATIONSHIP BETWEEN INTRACELLULAR AND PLASMA PHARMACOKINETICS ... 20
27
5.2 DRUG-DRUG INTERACTIONS AT THE INTRACELLULAR LEVEL ... 21
28
5.3 RELATIONSHIP BETWEEN INTRACELLULAR CONCENTRATIONS AND EFFICACY ... 26
29
5.4 RELATIONSHIP BETWEEN INTRACELLULAR CONCENTRATIONS AND TOXICITY ... 30
30
6 CONCLUSION ... 33
31 32
Figure captions
1 2
Fig. 1. Host-cell-mediated sequential enzymatic phosphorylation steps required for
3
activating the nucleotide- and nucleoside-analogue reverse-transcriptase inhibitors 4
(NRTIs) to the triphosphate moiety (Reproduced from Anderson et al.[17]). ABV = 5
abacavir; AMPD = adenosine monophosphate deaminase; AMPK = adenosine 6
monophosphate kinase (adenylate kinase); APT = adenosine phosphotransferase; 7
CBV = carbovir; dCK = deoxycytidine kinase; dCMPK = deoxycytidine 8
monophosphate kinase; ddA = 2',3'-dideoxyadenosine; ddI, = didanosine; DP, = 9
diphosphate; d4T = stavudine; FTC = emtricitabine; gK = guanylate kinase; MP 10
monophosphate; PMPA = tenofovir (PMPA DP is a triphosphate analogue); TFV = 11
tenofovir; TP = triphosphate; ZDV = zidovudine; 3TC = lamivudine; 5'NDPK = 5' 12
nucleoside diphosphate kinase; 5'NT = 5' nucleotidase. 13
14
Fig. 2. Schematic representation of uptake and efflux transporters that may influence
15
intracellular concentrations of antiretroviral drugs in peripheral blood cells. 16
Transporters are named by gene and proteins (Adapted from Ford et al.[53] and 17
updated[55-57]). OCT = Organic Cation Transporters, hCNT = Concentrative 18
Nucleoside Transporter, ENT = Equilibrative Nucleoside Transporter, gp = P-19
glycoprotein, MRP = Multidrug Resistance Protein, BCRP = Breast Cancer 20 Resistance protein. 21 22 23 24 25 26 27
Abstract
1
In patients infected by human immunodeficiency virus (HIV), the efficacy of highly 2
active antiretroviral therapy (HAART) through the blockade of different steps of this 3
retrovirus life-cycle is now well established. As HIV is a retrovirus which replicates 4
within the cells of the immune system, intracellular drug concentrations are important 5
to determine antiretroviral efficacy and toxicity. Indeed, nucleoside reverse 6
transcriptase inhibitors (NRTI), non nucleoside reverse transcriptase inhibitors 7
(NNRTI), newly available integrase inhibitors and protease inhibitors (PI) act on 8
intracellular targets. NRTIs are prodrugs that require intracellular anabolic 9
phosphorylation to be converted into their active form: the triphosphorylated drug 10
metabolite (NRTI-TP), half-life of which being longer than plasma half-life of the 11
parent compound for most. Activity of intracellular kinases, expression of uptake 12
transporters which may be dependent upon cell functionality or their activation state 13
may greatly influence intracellular concentrations of NRTI-TP. In contrast, NNRTIs as 14
well as PIs are not prodrugs and exert their activity by inhibiting directly enzyme 15
targets. All PIs, are substrates of CYP3A, which explains most of them display poor 16
pharmacokinetic properties with intensive pre-systemic first pass metabolism and 17
short elimination half-lives. There are evidences that intracellular concentration of PIs 18
depends on P-gp and/or other efflux transporters activity, which is modulated by 19
genetic polymorphism and co-administration of drugs with inhibiting or inducing 20
properties. Assaying adequately the intracellular concentrations of antiviral (ARVs) 21
drugs is still a major technical challenge, together with the isolation and the counting 22
of peripheral blood mononuclear cells (PBMCs). Furthermore, intracellular drug could 23
be bound to cell membranes or proteins; the amount of intracellular ARV available for 24
antiretroviral effectiveness is never measured which is a limitation of all published 25
studies. In this review, we summarized the results of thirty-one articles that provided 26
results of intracellular concentrations of ARVs in HIV-infected patients. Most studies 27
also measured plasma concentrations but few of them studied the relationship 28
between plasma and intracellular concentrations. For NRTIs, most studies could not 29
established significant relationship between plasma and triphosphate concentrations. 30
Only eight published studies reported an analysis of the relationships between 31
intracellular concentrations and virological or immunological efficacy of antiretroviral 32
drugs in HIV patients. In prospective studies well designed and with a reasonnable 33
number of patients, a significant correlation between virological efficacy and 1
intracellular concentrations of NRTIs was found with no influence of plasma 2
concentration. For PIs, the only prospectively design trial on lopinavir found both the 3
influence of trough plasma and intracellular concentrations. ARVs are known to 4
produce important adverse effects through their interferences with cellular 5
endogenous processes. The relationship between intracellular concentrations of 6
ARVs and their related toxicity were investigated in only four articles. For zidovudine, 7
the relative strength of the association between haemoglobin decrease and plasma 8
zidovudine compared to intracellular zidovudine-triphosphate is still unknown. 9
Similarly, for efavirenz and neuropsychological disorder methodological differences 10
penalize the comparison between studies. In conclusion, intracellular concentrations 11
of ARVs play a major role in their efficacy and toxicity and are influenced by 12
numerous factors. However the number of published clinical studies in that area is 13
limited; most studies were small and not always adequately designed. In addition, 14
standardization of assays and PBMC counts are warranted. Larger and prospectively 15
designed clinical studies are needed to further investigate the links between 16
intracellular concentrations of ARVs and clinical endpoints. 17
18 19 20 21
1 Introduction
1
Human Immunodeficiency Virus (HIV) is a retrovirus, which replicates within the cells 2
of the immune system. The efficacy of highly active antiretroviral therapy (HAART), is 3
now well established, and has provided extraordinary benefits to many patients with 4
HIV infection.[1]The morbidity and mortality related to HIV infection have dramatically 5
decreased in countries in which HAART has been available, turning HIV infection into 6
a chronic manageable disease.[2] Life-long antiretroviral treatment seems necessary, 7
as viral replication and loss of CD4 cells resume when HAART is interrupted. HAART 8
regimens have shown some limitations, the major one being the failure to eradicate 9
HIV even after several years of therapy. One of the reasons is that despite potent 10
antiretroviral (ARV) treatment, compartments of replication-competent virus persist, 11
suggesting that ARVs do not reach all the infected cells: however, there are no data 12
to support this theorical assumption. This article will focus on pharmacologic 13
principles that govern intracellular concentrations of antiretroviral drugs and on 14
clinical studies which aimed at assessing whether intracellular concentrations of 15
ARVs could be a useful parameter to predict efficacy or toxicity of antiretroviral drug 16
regimen. 17
The different steps of HIV replication are now well identified and understood. A 18
number of antiretroviral drugs are now available and are grouped in five 19
pharmacologic classes according to their mechanism of action. These drugs target 20
essential receptors or enzymes at different steps of the life cycle of the virus and will 21
block the production of infectious retroviral particles from the cell.[3] However virus 22
eradication cannot be achieved with the available treatments because of the pool of 23
latently infected CD4 cells.[4] 24
HAART is the standard of care to avoid selection of viral mutations. Selection of 25
drugs for treatment naïve patients and experienced patients take into account the risk 26
benefit ratio and the viral genotype. Current guidelines recommend in 27
treatment-naïve patients a combination of a ritonavir boosted PI or a NNRTI plus two 28
NRTIs and in treatment experienced patients a combination of at least two active 29
ARV drugs from different classes based on viral genotype.[5-7] 30
Besides entry inhibitors which act on receptors located on cell surface, most ARV 31
drugs inhibit viral replication inside the cell, therefore intracellular concentration 32
should be a reliable parameter to consider when relating pharmacokinetics and 33
efficacy. Results from several in vitro studies also exist in this area. But, because of 1
the difficulties of extrapolating the results from in vitro to in vivo studies, in this paper, 2
we focus only on in vivo studies. 3
This article summarizes clinical trials where intracellular concentrations were 4
measured and related to plasma concentrations, virological efficacy or toxicity. Prior 5
to this presentation and to understand limitations of such studies, the following topics 6
are presented and discussed: clinical pharmacokinetics of ARVs, intracellular drug 7
assays and mechanisms influencing intracellular diffusion and accumulation. 8
9
2 Clinical pharmacokinetics of ARVs
10
Pharmacokinetic parameters of ARVs are summarized in table I. [6, 8-13] 11
2.1 Entry inhibitors
12Entry inhibitors block the virus attachment on receptor of the cell surface. They have 13
an extracellular mode of action and therefore differ from other available classes of 14
antiretroviral agents. Two drugs of this class are available, enfuvirtide and maraviroc, 15
considering their mechanism of action, they are outside the scope of this review. To 16
have an exhaustive overview of ARVs, their pharmacological properties are briefly 17
summarized below. 18
2.1.1 CCR5 inhibitors
19CCR5 or CXCR4 chemokine co-receptor antagonists were promising entry inhibitors. 20
Maraviroc is the first approved drug of this new class. Maraviroc inhibits CCR5 21
chemokine co-receptor preventing HIV binding to cell membrane. Pharmacokinetic 22
characteristics have been summarized elsewhere.[14] In brief, maraviroc is a CYP3A 23
substrate and dosing differs according to combined drugs (150 mg bid with ritonavir 24
boosted PI, 600 mg bid when combined with drugs with enzyme inducing properties 25
such as efavirenz and 300 mg bid when combined with nucleoside analogs). 26
Maraviroc is a P-gp substrate, which limits intracellular concentrations. 27
Concentrations in cervico-vaginal fluid and vaginal tissue are higher than in plasma. 28
2.1.2 Enfuvirtide
1Enfuvirtide (T20) is a HIV-1 fusion inhibitor, which prevents fusion of HIV-1 and host 2
cell membranes. It is a synthetic peptide (4492 Da), which is not bioavailable when 3
taken orally and is administered subcutaneously twice daily (90 mg bid) which is 4
obviously a limitation to its long-term use. Pharmacokinetic properties have been 5
previously reported.[15] 6
2.2 Nucleoside and nucleotide analog inhibitors of reverse
7transcriptase
8Zidovudine (ZDV) is the oldest antiretroviral drug; since a number of nucleoside 9
analogs were developped (zalcitabine, didanosine (ddI), stavudine (d4T) lamivudine 10
(3TC), emtricitabine (FTC), abacavir (ABC)). Tenofovir (TFV) is a nucleotide analog 11
obtained after drug administration of tenofovir disoproxil (TDF), its ester prodrug. 12
Apricitabine is a new NRTI under development. 13
Although absolute bioavailaility is unknown, bioavailability is supposed to be high for 14
most nucleoside analogs but ddI, which is degraded at acid pH, and TDF. None of 15
these drugs are highly protein bound. Elimination of parent compound occurs as 16
unchanged drug via the kidney or non-CYP drug metabolizing enzymes, therefore 17
potential for drug-drug interaction is low, although TDF was demonstrated to inhibit 18
ddI metabolism.[16] Triphosphate (TP) metabolites are the active component of all 19
nucleoside analogs.They also inhibits to varying degrees human mitochondrial 20
polymerase γ. Phosphorylation steps occur within the cell and involved kinases, 21
which are listed in figure 1.[17] Half-life of the active moiety is longer than plasma half-22
life of the parent compound for all nucleoside analogs. Long half-lifes of TP 23
metabolites favor once daily dosing for most of nucleoside analogs except ZDV and 24
d4T, which are administered on a twice-daily basis. TFV is a nucleotide analog for 25
which the active form is a diphosphate (DP). All NRTIs compete with endogenous 26
analogs and stop DNA elongation. Nucleosides such as ABC (carbovir (CBV)) and 27
TFV are much less apt to cause mitochondrial toxicity compared with d4T.[18] 28
2.3 Non nucleoside analog inhibitors of reverse transcriptase
1NNRTIs do not require phosphorylation to inhibit reverse transcriptase. Nevirapine 2
(NVP) and efavirenz (EFV) are the most commonly used. Delavirdine is available in 3
some countries, and etravirine is a new NNRTI recently approved in the European 4
Union and in the United States. NVP and EFV have long half-life after single dose 5
administration. They are metabolized through CYP3A and CYP2B6 and a genetic 6
polymorphism has been described which explains at least part of interindividual 7
variability of their total clearance. They both have enzyme inducing and autoinducing 8
properties, which explains drug-drug interactions and their non linear 9 pharmacokinetics.[19] 10 11
2.4 Integrase inhibitors
12Integrase inhibitors represent a new class. These drugs inhibit the integration of HIV-13
DNA into the host genome. Raltegravir was approved in early 2008 and elvitegravir is 14
under development. Raltegravir is rapidly absorbed and plasma concentrations 15
decline with a terminal half-life of 7 to 12 h which supports a twice daily dosing.[20] 16
Plasma protein binding is 83%. Biotransformation pathway involved UGT1A1 17
therefore drug-drug interactions are limited.[21] ATV which inhibits UGT1A1, increases 18
raltegravir concentrations modestly.[22] Inducers such as EFV, TPV or rifampin 19
decrease raltegravir concentrations although the clinical consequences are currently 20 unclear.[21] 21 22
2.5 Protease inhibitors
23Protease inhibitors (PI) prevent cleavage of viral precursor protein into the subunits 24
required to form new virions. Approved PIs include amprenavir (APV), fosamprenavir, 25
atazanavir (ATV), darunavir (DRV), indinavir (IDV), lopinavir/ritonavir (LPV/r), 26
nelfinavir (NFV), ritonavir (RTV), saquinavir (SQV), and tipranavir (TPV). 27
They all are substrate and inhibitor of CYP3A, which explains part of their poor 28
pharmacokinetic properties: pre-systemic first pass metabolism, variable plasma 29
concentrations and short half-life in the 7 to 15 h range. RTV, which is the most 30
potent CYP3A inhibitor, is combined to all PIs but NFV to improve their 31
pharmacokinetic properties, increase plasma exposure and /or decrease the 32
administered dose.[23, 24] As basic organic chemicals they all are bound to plasma 1
proteins, α1-glycoprotein acid and albumin. They differ for some pharmacokinetic 2
parameters, extent of first pass metabolism, extent of protein binding (IDV 60%, LPV 3
98-99%) and some of them such as APV have inducing properties which make drug-4
drug interaction prevision very difficult. 5
6
3 Methodological considerations
7
All intracellular assays described to date do not discriminate between drug localised 8
in cell membrane or in cytoplasm, either bound to intracellular proteins or truly 9
unbound which should be the effective antiretroviral moiety. Measurement of total cell 10
concentrations is somehow of limited value. 11
3.1 Cell collection
12Isolation of PBMCs is the first step before analyzing the intracellular concentrations 13
of either NRTIs, NNRTIs or/and PIs. PBMCs can be isolated either using 14
conventional Ficoll gradient centrifugation or using cell preparation tubes (CPTs) 15
(from Becton Dickinson). The two procedures were compared by Becher et al.[25] on 16
phosphorylated anabolites of two NRTIs and were shown to give identical results. 17
However using CPTs was found to be easier, less time-consuming and therefore 18
quicker which in the case of d4T-TP was most important as the drug was shown 19
instable in the cell ring of the Ficoll gradient (40% loss within 40 min) and lead the 20
authors to collect the ring in less than 10 min. However before this isolation step the 21
stability of the phosphorylated anabolites, that of NNRTIs and PIs in blood should be 22
considered. 23
Regarding d4T-TP, its stability has been checked in blood before PBMCs isolation 24
and the authors recommend to perform the isolation within 6 h after sampling.[26] 25
Similar results were obtained with 3TC-TP and ZDV-TP.[27] It therefore seems that for 26
the phosphorylated anabolites the storage of blood samples in CPTs before isolation 27
could last 6 h, although it has not been thoroughly investigated for CBV-TP and TFV-28
DP. 29
Other issues during cell processing are to avoid contamination by red cells which 30
may phosphorylate some nucleoside analogs[28] and efflux of PIs and NNRTIs out of 31
cells. In contrast the NRTI-TPs are ion-trapped intracellularly. For NNRTIs and PIs 32
intracellular measurements, the collection of PBMCs has not been systematically 1
studied. The authors mentioned that samples should be immediately taken to 2
laboratory (within 5 min) and that all the procedures should be performed at 4°C to 3
inhibit enzymatic activity and to prevent active drug efflux, the time between blood 4
sampling and the cell isolation and extraction procedure should be less than 1 h.[29, 30] 5
6
3.2 Estimation of cell number
7Since the number of cells normalizes intracellular concentration, a critical step in the 8
processus of intracellular assay is the determination of the number of cells from 9
which the compounds were quantified. 10
In most studies when the information is indicated the cells were determined on a 11
small aliquot with a Coulter Counter, or using a Malassez cell and a microscope. 12
However this last procedure may suffer from insufficient accuracy and precision, 13
specifically when multiple sites are involved which explains that a biochemical test 14
was developed based on the relationship between DNA content and cells count by 15
Malassez cell.[31] This test could be performed in the analytical laboratories where 16
there is no Coulter Counter available. 17
The concentration is therefore expressed as amounts per 106 cells and can be 18
converted in amount per volume on the approximation that the PBMC volume is 19
0.4 pL in order to compare intracellular and plasma concentrations.[32] The accuracy 20
of this volume may be questionable as it varies according to the state of the cells 21
(quiescent or stimulated) or to the nature of the cells (cell volume of human 22
lymphoblast : 2.1 pL).[33] This highlights the pitfalls of the conversion. However the 23
0.4 pL volume is mostly used.[29, 34] This calculation step is critical for the comparison 24
of the results from different teams, and a standardized procedure should therefore be 25
chosen.
26
3.3 Analytical methods for intracellular assays
27The approaches regarding the analysis of the intracellular drugs due to the difference 28
in their concentrations (low about fmol/106 cells for intracellular TP anabolites and 29
ng/3×106 cells i.e. about pmol/106 cells for PIs) are quite different. 30
3.3.1 Nucleoside analog inhibitors of reverse transcriptase
1The major problem in measuring intracellular TP anabolites is the small amount 2
present in cells of patients and the presence of the endogenous intracellular 3
nucleotides able to interfere. Thus, selective and sensitive analytical methodologies 4
should be developed. 5
Rodriguez et al.,[35] in 2000 reviewed the latest information regarding the intracellular 6
in vivo quantification of NRTI-TP. The authors described the first methods used and
7
pointed out all their drawbacks (lack of sensitivity, cumbersome assays, inability to 8
differentiate NRTI-TP from the endogenous nucleotides, lack of internal standard). 9
More recent approaches were based on the same first steps, i.e. separation of ZDV-10
anabolites using anion-exchange cartridges, cleavage of the phosphate group using 11
acid phosphatase, addition of an internal standard after enzymatic digestion, 12
desalting and quantification by HPLC-MS/MS. Moreover the calibration curve was 13
prepared from ZDV-TP contrary to the previous procedures, which used the parent 14
compound. The limit of detection was 4.0 fmol/106 cells. The authors applied the 15
same procedure to the simultaneous determination of ZDV-TP and 3TC-TP.[36] The 16
limit of quantification was 0.1 pmol and 4.0 pmol for ZDV-TP and 3TC-TP, 17
respectively. Moore et al.,[37] improved this procedure describing an analytical 18
method which allows to measure simultaneously intracellular 3TC-TP, d4T-TP and 19
ZDV-TP with HPLC-MS/MS. The limits of detection were 5, 25, 25 pg on column for 20
3TC-TP, d4T-TP, ZDV-TP respectively. Similar methods were applied by King et 21
al.,[38] to measure TFV-DP and by Robbins et al.,[39] to measure simultaneously ZDV-22
TP, TFV-DP and 3TC-TP in PBMC i.e. isolation by anion exchange, addition of a 23
stable labeled isotope, dephosphorylation, desaltation and detection by LC MS/MS. 24
The lower limit of quantification were 10 fmol/106 cells for TFV-DP[38] and 0.11 25
pmol/106 cells, 2 fmol/106cells and 3.75 fmol/106 cells for 3TC-TP, ZDV-TP and TFV-26
DP respectively for a sample size of 106 cells.[39] Most of these indirect methods are 27
quite labor-intensive, involving multiple steps, which may restrict their use to 28
specialized laboratories. 29
New methodologies were described based on direct HPLC-MS/MS determination on 30
the cellular extracts without dephosphorylation. However these processes need the 31
use of ion pairing agents to circumvent the poor retention of the nucleotides which 32
most of them are incompatible with ionisation mass spectrometry. Pruvost et al.[26] 33
described the direct determination of d4T-TP as well as that of the endogenous 1
competitor deoxythymidine triphosphate (dT-TP). Just before cell lysis, an internal 2
standard was added. The instrument was operated in the electrospray negative ion 3
mode under MS/MS conditions. The limit of quantification was 9.8 fmol/106 cells i.e. 4
20 pg injected for TP. In this article the authors focus on the stability of the d4T-5
TP at the different steps (in blood, in the cells ring, in dry cells at 4°C, after cell lysis 6
at 4°C, in the injection solvent at room temperatur e). This procedure is very simple to 7
perform as it does not need any extraction step. However due to the very high pH of 8
the mobile phase (ion pairing agent: 1,5-Dimethylhexylamine) the column was 9
changed every two weeks.[40] 10
With slight modifications regarding the internal standard and the chromatographic 11
column, the same authors were able to measure simultaneously d4T-TP, 3TC-TP 12
and ddA-TP (active anabolite of ddI) with their corresponding natural nucleotides in 13
the same run.[25] However regarding ZDV-TP, a massive and tailing peak was 14
observed near the retention time of ZDV-TP, which precludes the analysis of ZDV-TP 15
simultaneously with d4T-TP, 3TC-TP and ddA-TP. To overcome this problem Becher 16
et al.,[41] developed a specific extraction of ZDV-TP using immunoaffinity and 17
detection of ZDV-TP using LC-MS/MS. More recently the same group improved the 18
specificity and obtained a slightly better sensitivity for 3TC-TP, CBV-TP and TFV-TP 19
using a positive electrospray ionization mode. [42] 20
Although the direct methods should be faster and more precise King et al.,[43] were 21
unsuccessful in reproducing these methodologies. In particular they pointed out the 22
difficulty in analyzing ZDV-TP due to the large amount of ATP and to the interference 23
with dGTP, these latter compounds having the same precursor ion and the same 24
product ion. This was evidenced by Compain et al.,[44] who developed an improved 25
method to determine ZDV-TP. The authors chose a minor but specific fragment ion 26
and had to spike their sample with a constant amount of ZDV-TP to allow the signal 27
to emerge from background in order to increase the sensitivity. 28
HPLC-MS/MS is susceptible to matrix effects, i.e. co-eluting matrix components that 29
affect the ionization of the target analyte, resulting in ion suppression, or, in some 30
cases ion enhancement.[45] For intracellular assay the main parameter to study is the 31
influence of the number of cells in the sample, as it cannot be fixed. The matrix effect 32
plus recovery was tested by Becher et al.,[46] on d4T-TP and ddA-TP and the 33
influence of the cell number was evidenced. The use of an appropriate internal 34
standard controlled the influence of the matrix effect between 7 and 14×106 cells for 1
the simultaneous assay of d4T-TP and ddA-TP. However the use of stable isotope 2
analog as internal standard would be the best choice to control the influence of the 3
matrix effect. 4
Monitoring the very low intracellular concentrations of these active anabolites 5
remains an analytical challenge. All the methods described have their drawbacks. 6
However they are all based on sophisticated methods, which can be hardly 7
reproduced, so each laboratory favors the analytical procedure in which it is familiar. 8
Whatever the choice regarding the procedure, indirect or direct, it appears that the 9
quantification of the compounds using HPLC coupled to MS/MS is very specific and 10
may circumvent all the drawbacks due to the multiple natural nucleotides that are 11
found in the complex mixture of the intracellular medium that can interfere with the 12
determination of intracellular phosphorylated anabolites of NRTIs. 13
14
3.3.2 Non nucleoside analogs and protease inhibitors
15The measurement of intracellular concentrations of NNRTIs and PIs could be 16
obtained using HPLC-UV detection as was it published for EFV[34] and for 10 of them 17
(NVP, DLV, APV, IDV, metabolite of NFV (M8), RTV, LPV, EFV, SQV, NFV)[47]. 18
However most reported data were obtained using LC-MS/MS methods either for one 19
drug[48] or for the simultaneous measurement of several of them. The method 20
involved automated solid-phase extraction[48], liquid-liquid extraction
(
(APV, LPV, 21SQV, EFV)[49], NVP[30], (LPV, RTV)[50]
)
or single-step extraction(
(NVP, DLV, APV, 22IDV, M8, RNV, LPV, EFV, SQV, NFV)[47], (IDV, APV, SQV, RTV, NFV, LPV, ATV, 23
EFV)[29]
)
. Few quantitative immunoassays were published for the intracellular 24determination of LPV and ATV.[51, 52] These methods imply the preparation of a 25
polyclonal antibody obtained with a synthetic antiretroviral drug derivative coupled to 26
hemocyanin or serum albumin as the immunogen and the chemical synthesis of an 27
enzyme tracer. Obviously these methods are not available in most laboratories, 28
which preclude their use as useful tools to study the intracellular concentrations of 29
NNRTIs and PIs. 30
4 Mechanisms influencing intracellular accumulation
1
4.1 General principles
2As already stated, most ARVs acting on cell receptors need to enter the cell to bind 3
to antiretroviral targets, reverse transcriptase, integrase or protease. In general, 4
disposition from systemic circulation and capillary lumen to the extravascular 5
compartment occurs by diffusion or involves active transporters 6
Simple diffusion is generally the most common mechanisms for transmembranal 7
movement of xenobiotics in the body. The rate of diffusion is defined by Fick’s law 8
and accordingly the small, lipophilic, unionised and unbound molecules readily 9
diffuse across the membrane. Difference in the pH gradient between plasma and 10
lymphocytes could explain ion trapping. As reported by Ford et al.[53], the pH gradient 11
between plasma and lymphocytes is subject to change depending on the membrane 12
potential. Binding of drugs to plasma proteins may slow diffusion rate as only free 13
unbound drug will cross biological membranes. However basic drugs which have 14
higher affinity for cells or tissues proteins than for plasma proteins may leave very 15
rapidly the blood stream and protein binding is not a limiting factor; for such drugs, 16
volume of distribution is high, the amount of drug in plasma small compared to the 17
amount in tissues and cells and small changes in plasma protein binding will not 18
affect the amount in extra vascular compartments.[54] Membrane transporters (efflux, 19
influx) are now recognized to play an important role in drug absorption and 20
disposition and to explain, at least in part, the broad interindividual variability in 21
intracellular concentrations of drugs. Figure 2 summarizes the different carrier 22
proteins determining intracellular concentrations within a typical immune cell.[53, 55-57] 23
Efflux transporters which operate at the expense of adenosine triphosphate (ATP) 24
hydrolysis are members of ATP-binding cassette (ABC)-type transport proteins and 25
are now well studied. P-gp was first described for its ability to reduce intracellular 26
concentrations of anticancer compounds. Other multidrug resistance proteins (MDR) 27
have been isolated since. They are expressed in the apical membrane of many 28
barrier tissues such as the intestine, liver, kidney, blood-brain-barrier, placenta, testis 29
and in immune cells. Relevance for pharmacotherapy of expression of ABC drug 30
transporters in peripheral blood cell have been reviewed recently.[57] The Breast 31
Cancer Resistance Protein (BCRP) was found to play a major role in nucleoside 32
efflux.[58, 59] Although influx transporters are not as well studied, several proteins have 1
been identified for nucleosides transport (Solute Carrier, SLC); they differ by their 2
mechanism of action. Some are powered by electrochemical gradient (Concentrative 3
Nucleoside Transporter hCNT), others are Equilibrative Nucleoside Transporter 4
(ENT), Organic Cation Transporters (OCT) or Organic Anion transporters (OAT), 5
although this later was not found to be expressed in immune cells.[53, 60] 6
Several factors may influence transporters expression within cell membrane, cell 7
subsets and functionality, activation state of cells and polymorphism of coding genes. 8
Polymorphism in the coding region of the transporter genes has been evidenced 9
which lead to produce functional changes in the encoded transporter protein and 10
result in variation in drug disposition and response, however the studies are 11
scanty.[55] Several factors which could affect intracellular concentrations of ARVs 12
have to be taken into consideration: drug affinity and expression of the transporters 13
according to different cells or tissues, and many of these transporters are known to 14
be modulated by co-administrated ARVs. 15
16
4.2 Nucleoside and nucleotide analog inhibitors of reverse
17transcriptase
18Data on nucleoside analogs (purine or pyrimidine base coupled to a sugar) cellular 19
penetration are scarce. As they are more hydrophilic compounds, it was suggested 20
that they could be substrates of the endogenous nucleoside transporters.[61, 62] 21
Although studies demonstrated that cerebral penetration occurs mainly by passive 22
diffusion and that the low concentration of nucleoside in brain is the consequence of 23
active efflux transporters[63], expression of uptake transporters in lymphocytes could 24
favor high intracellular concentrations. It was evidenced that ZDV-TP and 3TC-TP 25
concentrations were effluxed by MRP4 and BCRP. TFV as a nucleotide has an 26
ionized phosphate group, which confers acidic properties. It was demonstrated that 27
TFV uptake in the kidney proximal tubule basolateral membrane is mediated via 28
OAT1 and cellular efflux into the urine via MRP2 and MRP4.[64] TP concentrations 29
differ according to cell type most likely as a consequence of influx and efflux 30
transporters expression. In healthy volunteers, 3TC-TP concentrations were close in 31
PBMCs and purified CD4 cells, whereas ZDV-TP concentrations were lower in CD4 32
cells than in PBMCs.[65] Concentrations of TFV-DP were compared in PBMC, lymph 33
node tissue and digestive lymphatic tissue and were higher in PBMCs than in other 1
tissues.[66] These data strongly suggest that transporters localisation may differ 2
according to cell functionality. Kinase activity could also influence the intracellular 3
concentration of TP. In vitro experiments suggested this activity varies greatly and is 4
lower in resting cells than in activated PBMC.[67, 68] This could have important 5
consequences as kinases activity will govern the intracellular level of both 6
endogenous triphosphates and NRTI-TP which compete at the level of HIV-reverse 7
transcriptase. All NRTIs have been demonstrated to be more effective in monocyte 8
derived macrophages which are important HIV1 reservoirs than in CD4+T 9
lymphocytes.[69] These could also well explain the differences in NRTI-TP intracellular 10
concentrations according to different cell types and different activation state.[28] 11
12
4.3 Non nucleoside analog inhibitors of reverse transcriptase
13NNRTIs are weakly acidic and predominantly bind to albumin. Neither EFV nor NVP 14
were thought to be substrate of P-gp.[70] In a limited number of patients, Almond et 15
al.,[34] demonstrated a relationship between intracellular concentration of EFV and 16
% bound EFV in plasma. Such data are in contrast with those obtained with NVP by 17
the same team.[30] They demonstrated that intracellular concentrations of NVP are far 18
below those measured in plasma. Intracellular concentration was negatively related 19
to P-gp expression, but not related to plasma % unbound NVP.[30] To explain these 20
data, the authors suggest that NVP could induce P-gp or co-regulated efflux 21
transporter. Clearly, to understand all mechanisms, which are involved in intracellular 22
concentrations of NNRTIs, further studies are needed. 23
24
4.4 Protease inhibitors
25The intracellular pharmacology of PIs has been carefully reviewed by Ford et al.[53]. 26
The PI physio-chemical properties are in favour of passive transfer: 27
- The transfer is in agreement with lipophilicity measured by the n-octanol to water 28
partition coefficient. Accumulation of PIs in lymphocytes reflects the rank order of 29
lipophilicity: the less lipophilic PI being IDV and the most lipophilic NFV. 30
- PIs are weak bases and are mostly unionized in a basic environment; intracellular 31
sequestration is dependant upon pH gradient between plasma and cells. 32
- Protein binding of PIs to α1-acid glycoprotein ranged from 60% for IDV to 97-99% 1
for RTV, LPV, SQV and NFV. However protein binding per se is not a limiting factor 2
to intracellular diffusion as IDV, which is 60% bound, has lower intracellular 3
concentrations than other PIs more highly bound. Within the cell PIs are bound to 4
cell proteins and HIV proteases and therefore their relative affinity for each protein 5
may influence their dynamic equilibrium.[53] 6
However active transport may play a role in the intracellular accumulation. It is now 7
well established that PIs are substrates of P-gp and others efflux transporters such 8
as MRP1[71] or MRP2[72]. P-gp is expressed in the gastro-intestinal tract and the liver 9
and act with CYP3A to reduce their bioavailability. RTV combined to most PIs as a 10
pharmacologic enhancer inhibits both CYP3A and P-gp and markedly increases the 11
bioavailability of PIs. Such transporters are expressed on lymphocytes and may 12
reduce cellular accumulation. Meaden et al.,[73] found a relationship between 13
combined expression of P-gp and MRP1 on PBMCs of HIV-infected patients and 14
intracellular accumulation of SQV and RTV. In summary, there are evidences that 15
intracellular concentration of PIs depends on P-gp and/or other efflux transporters 16
activity, which is modulated by genetic polymorphism and coadministration of drugs 17
with inhibiting or inducing properties. How these transporters will control intracellular 18
concentrations of PIs need further studies. 19
20
4.5 Importance of genetic polymorphism
21At evidence, the role of transporters and their genetic polymorphism in drug 22
disposition should be considered[74] and reviews have summarized findings from 23
recent pharmacogenetics studies.[55, 75] 24
La Porte et al.,[76] studied the relationship between ABCB1 (MDR1) genetic 25
polymorphism, P-gp expression and SQV or SQV/r pharmacokinetics in 150 healthy 26
volunteers. No relationship was found between the C3435T, G2677T/A or C1236T 27
polymorphisms of the ABCB1 gene and the pharmacokinetics of SQV or the 28
expression and activity of P-gp in PBMCs. Seventy one HIV-infected children treated 29
with a NFV backbone antiretroviral drug regimen were evaluated for MDR1 30
polymorphism (MDR1 C3435T), NFV plasma concentrations, CD4 cell count and 31
HIV-RNA.[77] Children with the C/T genotypes had higher 8h post dose NFV 32
concentrations and more rapid response to HAART. Unfortunately, intracellular 33
concentrations of PIs were not measured in these studies. In contrast, in 12 HIV-1
infected patients, Ford et al.,[78] could not evidenced higher intracellular 2
concentrations of NFV or its M8 metabolite and lymphocyte cell surface expression of 3
P-gp. In a cohort of 47 patients treated with PI boosted or not by RTV, Chaillou et 4
al.,[79] demonstrated that intracellular concentration of RTV was related to 5
undetectable plasma HIV-RNA, which was not related to MDR1 gene expression. 6
Interestingly the importance of MRP4 carrier was evidenced by Anderson et al.,[72], 7
as they demonstrated that patients carrying MRP4 T4131G had elevated 3TC-TP 8
concentrations and patients with MRP4 G3724A had a trend for elevated ZDV-TP. 9
They also found that IDV clearance was faster in patients expressing CYP3A5 and in 10
patients carrying the MRP2-24C/T variant[72]; whether this latter may contribute to 11
lower intracellular concentrations remains to be established. 12
Recently, Kiser et al.,[80] demonstrated that intracellular concentrations of TFV-DP 13
were higher, first with decrease in kidney glomerular filtration rate and consequently 14
total and renal clearance of TFV (p=0.04) and second in presence of the ABCC4 15
3463 A>G variant (p=0.04 after adjustment for race, treatment group and glomerular 16
filtration rate). The authors pointed out the limitation of this small sample size study 17
for genetic association and thus results should be confirmed in larger study. Whether 18
those exploratory data could be extrapolated to intracellular concentration of TFV-DP 19
within renal proximal tubule cells is presently unknown. 20
At evidence, the control of intracellular concentrations of ARVs is complex and 21
dependant on many factors and more work is needed in this area taking into account 22
the differences in cell biology. 23
24
5 Clinical studies with intracellular concentrations
25
5.1 Relationship
between
intracellular
and
plasma
26pharmacokinetics
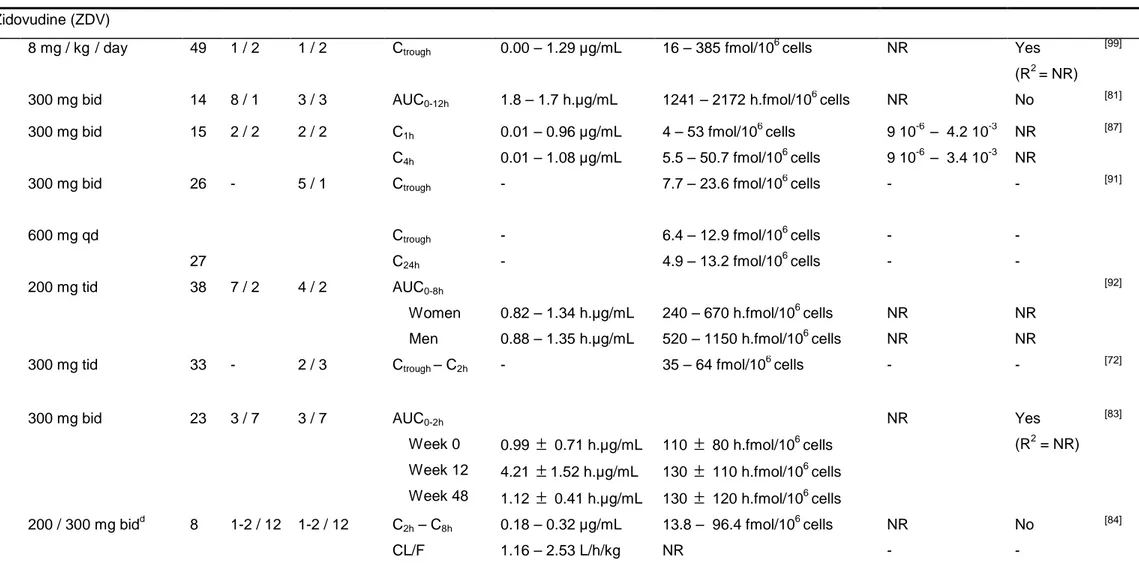
27Clinical studies performed in HIV-infected patients reporting intracellular 28
concentrations are summarized in table II.[9-13, 30, 34, 72, 78, 79, 81-101] They are displayed 29
by antiretroviral class, then within an antiretroviral class they are listed by molecule 30
with respect to the date of Health Authority approval. For each molecule, the more 31
recent studies are presented first. All those studies were published after 2000, except 32
for ZDV for which intracellular concentrations have been studied since 1994. Most 1
studies reported both plasma and intracellular concentrations but only few of them 2
studied the relationship between them. 3
It can be seem from table II that plasma pharmacokinetic parameters are rather 4
similar across studies but some differences are observed for intracellular parameters. 5
For NRTIs, most studies did not established significant relationship between plasma 6
and TP concentrations. In contrast for NNRTIs and PIs results are more conflicting, 7
some studies evidencing correlation, while others could not. These results support 8
the use of plasma concentration of NNRTIs or PIs but not NRTIs to monitor antiviral 9
efficacy. 10
Such results are not surprising knowing first that PBMCs collection, preparation and 11
quantification are not an easy task (see section 3) and second that many factors 12
influence intracellular drug penetration and among them genetic polymorphism of 13
influx and efflux carriers (see section 4). Moreover, these intracellular studies have 14
been carried out in relatively few patients and larger studies would be needed to 15
address consistently the relationship between plasma and intracellular 16
concentrations of ARVs. 17
It is also important to note that there are potential methodological problems when 18
studying relationship between concentrations observed at single time points, as it is 19
done in a number of studies. Indeed, plasma and intracellular half-life are very 20
different. It is more adequate to assess the relationship through pharmacokinetic 21
parameters such as AUC. Surprisingly, most studies reported concentrations at some 22
time points or PK parameters obtained by non-compartmental analysis. Population 23
approaches were never used to analyse intracellular concentrations and their link 24
with plasma concentrations, although this approach seems more appropriate as it 25
allows to analyze sparse measurements. 26
5.2 Drug-drug interactions at the intracellular level
27On a theoretical point of view, changes in the intracellular concentration of 28
antiretroviral drugs can be secondary to modifications of (i) plasma concentration of 29
the drug and/or the prodrug, (ii) activity of the enzymes responsible for drug 30
anabolism/metabolism at the cellular level, (iii) activity of membrane transporters 31
involved in cellular uptake or efflux. Since the intracellular amount of the active drug 32
is responsible for treatment efficacy, interactions leading to changes in intracellular 1
concentrations are a relevant issue regarding the virologic outcome. 2
The clinical impact of these interactions was first evidenced by the poor efficacy of 3
therapies combining ZDV with d4T.[102] Though the likely mechanism of this result, 4
competitive inhibition of d4T phosphorylation by ZDV, was assessed only by in vitro 5
experiments, this phenomenon highlighted the necessity to investigate the possible 6
alteration in the intracellular concentrations of ARVs due to drug association.[103, 104] 7
Potential interactions involving NRTIs at the intracellular level were therefore 8
investigated in several studies. Hawkins et al.,[82] evaluated whether the high rate of 9
virological failure observed in patients receiving a triple NRTIs combination including 10
TDF could be explained by modifications in the intracellular anabolism of these 11
compounds. 12
So, intracellular levels of TFV-DP, CBV-TP and 3TC-TP were measured in 15 HIV-13
infected patients receiving a triple NRTI combination (TDF-ABC-3TC or TDF-ABC- 14
d4T), before and after replacement of TDF or ABC by a NNRTI or a PI. No 15
modification in the intracellular concentrations of the active anabolites of the 16
remaining NRTIs was observed, which suggested the lack of significant interaction 17
between the investigated drugs. Another recent study confirmed these results on 27 18
patients.[105] Taken together, these results suggest the clinical failure that was 19
observed with the triple NRTI (ABC/TDF/3TC) regimen was not due to drug 20
interactions but was more likely the consequence of lack of intrinsic power.[106] This 21
latter study also evidenced a significant 50% increase in the intracellular 22
concentration of TFV-DP when TFV was combined to LPV/r. However, this result 23
could simply be the intracellular reflection of the systemic interaction between these 24
two drugs.[107] This study found no significant difference in the intracellular 25
concentrations of CBV-TP and 3TC-TP with respect to LPV/r use, despite a 46% 26
decrease in ABC plasma concentration in the LPV/r group. Last, nevirapine was also 27
found not to significantly modify the intracellular concentrations of TFV-TP, CBV-TP, 28
and 3TC-TP. 29
Hoggard et al.,[108] investigated whether prior exposure to ZDV could subsequently 30
inhibit d4T phosphorylation. The rationale for this study came from the observation 31
that naïve patients receiving a d4T -3TC combination experienced a further one log10
32
decrease in viral DNA compared to patients previously treated by ZDV.[109] A 33
subsequent inhibition of d4T phosphorylation due to a down regulation of thymidine 34
kinase induced by ZDV was one of the hypotheses raised to explain this result. 1
However, the cellular concentration of d4T-TP measured in 7 ZDV-experienced 2
patients was not different to the concentration measured in 20 ZDV-naïve subjects. 3
Furthermore, the ability of PBMCs to phosphorylate d4T was not different between 4
ZDV-experienced and ZDV-naïve subjects.[108] Similarly, no influence of prior 5
exposure to ZDV on ZDV phosphorylation was observed during a 12 months period 6
on 23 HIV-infected patients. [83] It is therefore likely that the decrease in efficacy 7
observed in ZDV-experienced patients was due to the acquisition of resistance 8
mutations rather to a modification in intracellular metabolism. 9
By measuring the TP moieties of ZDV and 3TC in the PBMCs of 8 patients, Fletcher 10
et al.,[84] found a strong correlation between the intracellular concentrations of ZDV-11
TP and 3TC-TP. If this result suggested the existence of interplay among the cellular 12
anabolism and/or metabolism of these drugs, its precise mechanism and possible 13
consequences have still not been elucidated. 14
TDF is known to increase the plasma concentration of ddI, the most likely 15
mechanism for this interaction being the inhibition by TVF of the enzyme responsible 16
for the hydrolysis of guanosine and adenosine analogues, the purine nucleoside 17
phosphorylase.[16] This interaction is clinically relevant since it is responsible for 18
adverse effects[110-113] or treatment failure[114] which may be secondary to didanosine 19
overexposure. Because of this, this association is currently not recommended for the 20
initiation of HAART, but is nevertheless not countraindicated for ulterior lines of 21
treatment.[6] Pruvost et al.,[85] investigated the possible consequences of this 22
systemic interaction on the intracellular concentrations of the active moieties. 23
Intracellular concentrations of ddA-TP and TFV-DP were compared between 14 24
patients receiving the ddI/TDF (250 mg/300 mg) combination and 16 patients 25
receiving ddI (400 mg) without TDF or 14 patients receiving TDF (300 mg) without 26
ddI. The measured concentrations were found to be comparable between the groups 27
which validated the strategy consisting in decreasing ddI dose from 400 to 250 mg 28
when it is combined with TDF.[115] 29
Apricitabine, a novel deoxycitidine analog currently under investigation, shares its 30
initial phosphorylation pathway by deoxycytidine kinase with 3TC and FTC. The 31
potential interaction between apricitabine (600 mg bid) and 3TC (300 mg qd) was 32
evaluated in a crossover study performed on 21 healthy volunteers who received 33
sequentially each drug separately and the combination of both. No significant 34
modification in the plasma pharmacokinetics of 3TC, or in the cellular 1
pharmacokinetics of its active TP moiety was observed during the combination 2
compared to the monotherapy period. However, if co-administration with 3TC had no 3
influence on apricitabine plasma pharmacokinetics, cellular concentration of 4
apricitabine TP dropped by 85% during the same period.[116] These findings strongly 5
suggested that apricitabine should not be co-administered with deoxycitidine 6
analogues. 7
Hydroxyurea is an antiproliferative drug that was shown to provide a further 0.7 log10
8
reduction in plasma HIV RNA when combined with ddI compared to patients 9
receiving ddI alone.[117] By measuring intracellular deoxyadenosine triphosphate (dA-10
TP) in 69 HIV-infected sujects, it was evidenced that patients receiving the 11
hydroxyurea-ddI combination achieved significantly lower dA-TP concentrations than 12
patients under ddI or hydroxyurea monotherapy, whereas no modification in the 13
plasma pharmacokinetics of the two drugs was observed.[118] If the precise 14
mechanism of this interaction is still unknown, the likely explanation for the 15
enhancement of ddI’s efficacy is the decrease in the intracellular dA-TP/ddA-TP ratio, 16
which would facilitate the incorporation ddA-TP in the replicating viral DNA. 17
Similarly to hydroxyurea, mycophenolic acid, an immunosuppressive agent, is known 18
to decrease the intracellular concentration of an endogenous nucleotide, the 19
deoxyguanosine triphosphate (dG-TP), which could enhance the antiviral activity of 20
abacavir by decreasing the dG-TP/CBV-TP ratio.[119] Since this ratio could not be 21
measured to date in patients receiving the mycophenolate mofetil–ABC combination, 22
this hypothesis still needs to be confirmed. Nevertheless, the lack of influence of 23
mycophenolic acid on 3TC phosphorylation was sugested by the similar intracellular 24
concentration of 3TC-TP observed in patients receiving 3TC with or without 25
mycophenolate mofetil.[86] 26
Ribavirin is a nucleoside analogue used for the treatment of hepatitis C virus (HCV) 27
infection. Although its mechanism of action is still not fully understood, it involves at 28
least in part an intracellular transformation into a TP moiety.[120] Thus, because 29
ribavirin is used in HIV/HCV coinfected patients, its potential interactions with NRTIs 30
were investigated in several studies. 31
Rodriguez-Torres et al.,[121] evaluated the combination of ribavirin with 3TC, d4T, or 32
ZDV in HIV/HCV coinfected patients. Plasma concentrations of ZDV, d4T, 3TC and 33
intracellular concentrations of ZDV-TP, d4T-TP, 3TC-TP were measured in 31 34
patients receiving concomitant ribavirin and compared to the concentrations obtained 1
in 25 patients receiving a placebo instead of ribavirin. No significant difference in 2
plasma and cellular concentrations of the measured compounds was observed, 3
suggesting ribavirin does not modify the plasma pharmacokinetics and the 4
intracellular phosphorylation of ZDV, d4T, 3TC. The lack of interaction between 5
ribavirine and ZDV was confirmed in another study performed on 14 HIV-infected 6
subjects.[122] 7
It is noteworthy these results are discrepant with in vitro data which evidenced an 8
inhibition of the phosphorylation of ZDV[123, 124] and d4T[104] by ribavirin. However it is 9
still unexplained whether these discrepancies are due to a poor ability of in vitro 10
models to predict in vivo phenomenon or to some methodological drawbacks in the 11
ex-vivo quantification of intracellular TP moieties.
12
Oppositely, ribavirin was found to potentiate in vitro the phosphorylation of ddI via the 13
inhibition of inosine 5-monophosphate dehydrogenase.[125] However, despite its 14
potential virologic interest, this interaction is also characterized by a high risk of 15
mitochondrial toxicity[126, 127], so the ribavirin-ddI association is not recommended. 16
Concerning PIs, the influence of ATV on the plasma and intracellular 17
pharmacokinetics of SQV and RTV was investigated in 9 HIV-infected patients who 18
received the SQR/RTV (1600/100 mg qd) combination with and without ATV (200 mg 19
qd). ATV was found to significantly increase both plasma and intracellular 20
concentrations of SQV by a similar factor of approximately 4, but had no effect on 21
RTV concentrations.[128] Interestingly, the cellular half-life of SQV was unaffected by 22
ATV, which suggested the increase in the intracellular concentration was secondary 23
to the increase in plasma concentration rather to the inhibition of a cellular 24
transporter. 25
The possible modification of plasma and cellular concentrations of SQV by quercetin, 26
a bioflavonoid displaying inhibitory properties on CYP3A4 and P-gp, was investigated 27
on 10 healthy adults who received SQV alone (1200 mg bid) for 11 days followed by 28
the association SQV/quercetin (1200 mg bid/500 mg bid) during the next three 29
days.[129] If no change was observed for SQV plasma concentration, its intracellular 30
concentration surprisingly decreased by almost 50% when combined with quercetin. 31
However, the important intra and intersubject variability of the intracellular 32
concentrations prevented to draw conclusions from this result. 33
The accumulation ratio, equal to the cellular concentration divided by the plasma 1
concentration, of some PIs was found to be modified by low doses of RTV in HIV-2
infected subjects.[79] APV and IDV accumulation ratios in presence of 100 mg or 400 3
mg of RTV were indeed increased three-fold and five-fold respectively. However, 4
conflicting results were obtained in another study which found that RTV did not 5
increase the accumulation ratio of SQV and IDV.[130] 6
Despite these discrepencies, assessing the consequences of drug interactions at the 7
cellular level is of great concern in order to validate new combinations. Some recent 8
surprising results, like the possible decrease in the efficacy of HCV therapy due to 9
ABC[131], evidenced the need for a better understanding of drug interactions. 10
11
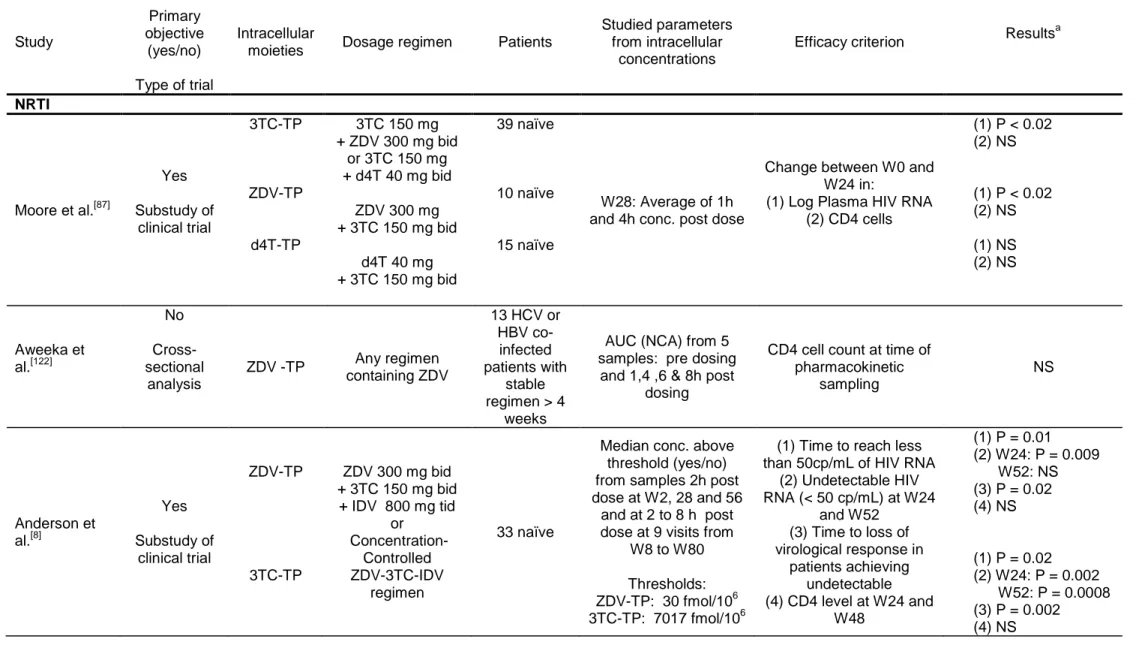
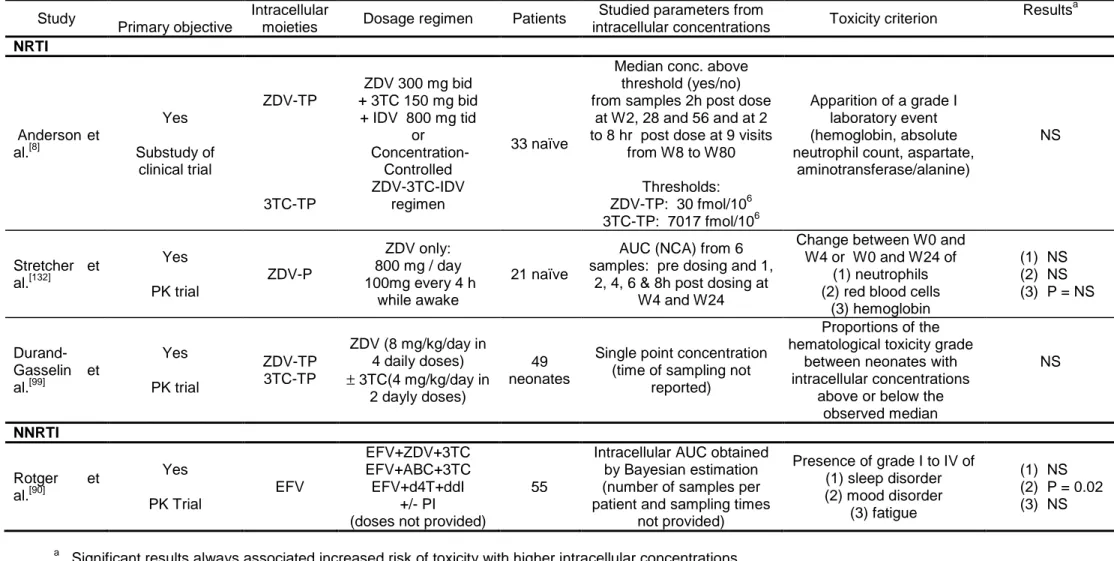
5.3 Relationship between intracellular concentrations and efficacy
12Only eight studies were published reporting an analysis of the relationships between 13
intracellular concentrations and virological or immunological efficacy of antiretroviral 14
drugs in HIV patients. Five studied intracellular NRTIs and three PIs. These articles 15
are summarized in table III by molecule from the most recent to the oldest one.[8, 79, 84, 16
87-89, 122, 132]
Of note, five were prospective study and interestingly found a significant 17
relationship between higher intracellular concentrations and virological response.[8, 84, 18
87, 88, 132]
The correlation with plasma concentration was not always studied but was 19
mainly not or less significant. The three studies with non significant results were 20
cross-sectional studies not designed for that purpose.[88, 89, 122] We start as in table II 21
by the results on NRTIs and then on PIs, there is no such study for NNRTIs. With 22
nucleoside analogues, it is important to notice that the relevant determinant of 23
pharmacodynamic response is the ratio between drug triphosphate and endogenous 24
nucleoside triphosphates rather than the absolute intracellular concentration.[133] 25
The study by Moore et al.,[87] was a substudy of the ACTG 862, a prospective trial 26
where naïve patients were starting a dual NRTI therapy. A significant correlation 27
between change in viral load between week 0 and week 28 and intracellular 28
concentrations was found for 3TC-TP (R2= 0.62) in the 39 patients receiving either 29
3TC-ZDV or 3TC-d4T, and for ZDV-TP (R2= 0.28) in the 10 patients receiving 3TC-30
ZDV. No significant correlation was found for d4T-TP in the 15 patients receiving 31
3TC-d4T and no significant relationship was found for any drug when studying 32
change in CD4 cells. The authors did not study the relationships between efficacy 33
and plasma concentration but showed a very large interpatient variability in the 1
intracellular to plasma concentration ratio. The authors also showed that there was 2
an important increase of intracellular concentration between first dose and week 28 3
only for 3TC-TP. 4
The study of Aweeka et al.,[122] was performed in HCV or HBV co-infected HIV 5
patients and its primary objective was to study the influence of ribavirin on ZDV 6
plasma and intracellular concentrations by measuring the AUC in patients before and 7
after introduction of ribavirin. Different regimens were allowed and all patients had to 8
receive ZDV for at least 4 weeks. In the cross-sectional analysis performed in 13 9
patients before receiving ribavirin, no significant relationships was found between 10
AUC of ZDV-TP and the CD4 cell count measured the same day. 11
The studies by Anderson et al.,[8] and Fletcher et al.,[84] are substudies of the well 12
known concentration-controlled randomised trial by Fletcher et al.,[134]. In this trial 13
patients received a tritherapy with ZDV, 3TC and IDV either with a fixed dose or with 14
a dose adapted to get trough concentrations in a define range. Intracellular 15
concentrations of ZDV-TP and 3TC-TP were measured 2 h after dose administration 16
at the three pharmacokinetics visits scheduled at weeks 2, 26 and 52 and at variable 17
time post dose at the nine bimontly visits. For each patient the median intracellular 18
concentration from all measurements was considered for the analysis of the link with 19
efficacy. Unfortunately the authors did not analyse intrapatient variability of these 20
concentrations. 21
In their first study[84], only 8 patients were studied and the efficacy criteria were the 22
change between baseline and week 24 HIV RNA or the percent change between 23
baseline and week 24 CD4 cell count. For ZDV-TP a significant correlation with 24
intracellular concentrations was found both for changes in HIV RNA (R2=0.54) and 25
CD4 cells (R2=0.84). For 3TC-TP a significant correlation with intracellular 26
concentrations was found for changes in HIV RNA (R2=0.79) but not for CD4 cells 27
(P=0.07, R2=0.44). There was no significant correlation between efficacy and steady-28
state plasma concentration of these drugs. 29
In the article by Anderson et al.,[8], 33 patients were studied; the analysis was very 30
thorough with various efficacy endpoints and with several multivariate analyses. After 31
a first simple correlation study, the authors defined thresholds for intracellular 32
concentrations as the first quartiles, which are of 30 fmol/106 cells for ZDV-TP and of 33
7017 fmol/106 cells for 3TC-TP. They then studied the impact on several efficacy 34
![Table I. Summary of pharmacokinetics parameters of available antiretroviral drugs adapted from [6, 8-13]](https://thumb-eu.123doks.com/thumbv2/123doknet/13344151.401852/46.1263.126.1137.117.777/table-summary-pharmacokinetics-parameters-available-antiretroviral-drugs-adapted.webp)