HAL Id: hal-02796841
https://hal.archives-ouvertes.fr/hal-02796841
Preprint submitted on 5 Jun 2020
HAL is a multi-disciplinary open access archive for the deposit and dissemination of sci-entific research documents, whether they are pub-lished or not. The documents may come from teaching and research institutions in France or abroad, or from public or private research centers.
L’archive ouverte pluridisciplinaire HAL, est destinée au dépôt et à la diffusion de documents scientifiques de niveau recherche, publiés ou non, émanant des établissements d’enseignement et de recherche français ou étrangers, des laboratoires publics ou privés.
Distributed under a Creative Commons Attribution - NonCommercial - ShareAlike| 4.0 International License
Decomposing Preference for Redistribution Beyond the
Trans-Atlantic Perspective
Ryo Kambayashi, Sébastien Lechevalier, Thanasak Jenmana
To cite this version:
Ryo Kambayashi, Sébastien Lechevalier, Thanasak Jenmana. Decomposing Preference for Redistri-bution Beyond the Trans-Atlantic Perspective. 2020. �hal-02796841�
Fondation France-Japon de l’EHESS (FFJ) 54, boulevard Raspail 75006 Paris - [email protected]
FONDATION FRANCE-JAPON DE L’EHESS
FFJ DISCUSSION PAPER #20-03
Decomposing Preference for Redistribution
Beyond the Trans-Atlantic Perspective
Ryo Kambayashi
(Hitotsubashi University)
Sebastien Lechevalier
(EHESS, CCJ-FFJ)
Thanasak Jenmana
(Paris School of Economics)
Decomposing Preference for Redistribution
Beyond the Trans-Atlantic Perspective
*
Ryo Kambayashi† Sebastien Lechevalier‡ Thanasak Jenmana§
June 1, 2020
Abstract
There are significant differences across countries in terms of redistribution by the government. This corresponds to underlying dissimilarities in preference for redistribution. Particularly, previous literature compared the US and Europe and proposed several
explanations of these differences, from aggregation of individual determinants (e.g. one’s
income) to more holistic ones such as shared values at the national level (i.e. social beliefs). This paper, therefore, aims to analyse the impact of socio-demographic factors and social
beliefs on preference for redistribution. First, we focused on two different dimensions of
preference —the government’s role in reducing the difference in income and the approach of
the tax system with high income. Secondly, we extended the comparison by including a
developed Asian country, Japan.
Based on the results, the following two attitudes are not fully compatible: many people support the governmental intervention, but not for more tax on the rich, especially in Japan. Furthermore, the difference in the attitude on the governmental intervention mainly comes from the variance in the role of social beliefs. On the other hand, the average income and wealth do not explain the difference in preference.
Countries are characterized by different social beliefs, which affects the differences in sub-preferences. However, not only the distribution of social beliefs, but also their statistical relation to the sub-preferences explains the country level disparity. In addition, the US and Europe comparison under/over-estimates these statistical associations in the world, since an Asian country, such as Japan, may have a different structure.
Keywords: government, inequality, redistribution, tax. JEL classification: D31, D63, H23
*We wish to acknowledge the financial support from The Toyota Foundation (Grant N°D16-R-0032). This work
was also supported by JSPS KAKENHI Grant Number 18KK0044 and 19H00592. We are grateful to Jonas Pontusson, Alberto Alesina, and Sabina Avdagic for their helpful comments. Usual caveats apply.
†Institute of Economic Research, Hitotsubashi University; 2-1, Naka, Kunitachi, Tokyo, 186-8603, Japan;
‡L’École des Haute Études en Sciences Sociales (EHESS); 54 Boulvard Raspail, 75006, Paris, France;
1
Introduction
The level of redistribution varies even among developed countries. According to the OECD, while the pre-tax Gini coefficient in the US, France and Japan was concentrated within the range of 0.03 point in the middle of 2000s, the reduction of inequalities through fiscal policies (including social transfer) differs; lowest in the US (-0.11), highest in France (-0.20), and Japan (-0.13). As a result, the range in post-tax Gini coefficients among these countries expands three times as large as the case of pre-tax, that is, 0.09. Furthermore, there is no sign of convergence. Even after the Great Financial Crisis in 2008-09 and political change within the countries, the heterogeneity of redistributional policy remains constant. In 2015, this policy reduced Gini coefficients by -0.12 (US), -0.22 (France), and -0.17 (Japan). The ranges of Gini coefficients remain within 0.02 point for pre-tax and 0.09 point for post-tax1.
Assuming that popular preferences democratically determine redistributional policy, previous literature explained the persistent heterogeneity of redistributional policy with the beliefs about the causes of wealth and poverty (Benabou, 2000; A. Alesina, Glaeser, & Sacerdote, 2005), specially the citizens’ views on the role of self-reliance versus societal factors (A. Alesina, Tella, & MacCulloch, 2001). Literature focuses on two mechanisms to form the social beliefs. On the one hand, individual voters’ perceptions of the extent to which people control their own fate are major determinants of the society’s attitudes toward inequality and redistribution —swamping in particular the effects of own income and education (e.g., Fong, 2001). On the other, it may also be that the nature of the social contract shapes people’s beliefs. The existence of a welfare system may affect the expectations and social values of citizens Bénabou and Tirole (2006). The conjunction of these two major mechanisms may explain the persistent differences in redistributional policy across countries, which is the focus of this paper2
The purpose of this paper is to empirically extend the literature on preference for redistribution by including two aspects of the comparison. First, we include an Asian country, Japan, in the analysis. Note that the rationale behind Asian patterns is not obvious from the trans-Atlantic viewpoint and providing some descriptions may help generalize the findings of previous literature on the topic
3. Second, we used two different questions about the preference for redistribution to capture the
multiple dimensions of preference (hereafter, we denote them as sub-preferences). More precisely, from the 2009 issue of the International Social Survey Programme (ISSP) on “Social Inequality”,
1 Income Distribution and Poverty Dataset from OECD Statistics (last access is on 04 Sep 2019 06:56 UTC). Actual
figures of pre-tax Gini coefficients are 0.49 in 2005 France, 0.49 in 2005 US and 0.46 in 2006 Japan. Actual figures for post-tax Gini coefficients are 0.38 (2005 US), 0.29 (2005 France) and 0.33 (2006 Japan). The definition of income in this database changed in 2012. The actual figures for pre-tax Gini coefficients in 2015 are 0.52 (US), 0.50 (France) and 0.51 (Japan). The post-tax Gini coefficients in the same year show 0.39 (US), 0.30 (France), and 0.34 (Japan).
2According to A. Alesina and Angeletos (2005): "Different beliefs about the fairness of social competition and what
determines income inequality influence the redistributive policy chosen in a society. But the composition of income in equilibrium depends on tax policies. We show how the interaction between social beliefs and welfare policies may lead to multiple equilibria or multiple steady states. (. . . ) These insights may help explain the cross-country variation in perceptions about income inequality and choices of redistributive policies."
3For example, Kluegel and Miyano (1995) compares the support for government intervention in five countries (the US,
the UK, West Germany, Netherlands, and Japan) by using the 1987 issue of ISSP and find that Japan is different from other countries in the sense that the citizens on average are simultaneously both more conservative (higher endorsement of success ideology) and more liberal (more egalitarian) than in Western countries. As a result, in all countries but Japan, adherence to success ideology lowers support for government intervention.
we used the replies to the following questions:
1. “Is it the responsibility of the government to reduce the difference in income between people with high incomes and those with low incomes?”;
2. “Generally, how would you describe taxes in <country> today for those with high incomes? Taxes are <answer>” with the answer ranging from much too low to much to high.
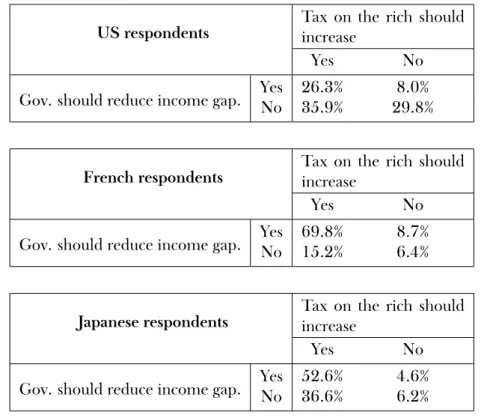
Although both questions are highly related to the redistributional policy, the answers to these are not fully coherent as shown in the Table 1. The discrepancies in the answers are captured by the percentage of respondents that answer “yes” to one question and “no” to the other, which represents one third of the total. This indicates that the preference for redistributional policy has multiple dimensions. We take seriously these discrepancies and try to interpret them in terms of ideology regarding government intervention and progressive tax systems (see also Barnes (2015) as well as Cavaillé and Trump (2015) in this spirit).
Table 1: The overall distribution of preferences in all countries (2009 ISSP)
Entire 2009 sample
Tax on the rich should increase
Yes No
Gov. should reduce income gap. YesNo 53.5%25.7% 13.1%7.6%
These two aspects of our contribution are related to each other, since the two sub-preferences are substantially different across the US, France and Japan, as shown in table 2. For example, while Japan has in-between percentage of respondents answering “yes” to both of questions, as compared to trans-Atlantic countries, the percentage of people answering “yes” and “no” (in favor of the increase of tax on the rich but opposed to government intervention, respectively) is higher than in the US. This paper aims to explain the differences in sub-preferences in redistributional policy across the three countries and to relate them to social beliefs.
Our findings can be summarized as follows. First, the correlation of relative position in income distribution/social beliefs to sub-preferences is different from country to country. Second, these correlations are also different between two sub-preferences. Therefore, the difference in redistributional policy among three countries are explained by the difference in the shape of income distribution, the difference in the average of social beliefs, and the difference in their relation to sub-preferences.
The next section reviews the related literature in emphasizing the gap between the analysis of individual determinants of preferences for redistribution and the international comparison between countries. In the third section, we introduce the ISSP database and some patterns of
Table 2: The distribution of preferences in US, France, and Japan in the 2009 ISSP
US respondents
Tax on the rich should increase
Yes No
Gov. should reduce income gap. YesNo 26.3%35.9% 29.8%8.0%
French respondents
Tax on the rich should increase
Yes No
Gov. should reduce income gap. YesNo 69.8%15.2% 8.7%6.4%
Japanese respondents
Tax on the rich should increase
Yes No
Gov. should reduce income gap. YesNo 52.6%36.6% 4.6%6.2%
sub-preferences for redistributional policy in the US, France and Japan. The fourth section is dedicated to the analysis of the impact of social beliefs on sub-preferences in the three countries. The fifth section discusses these results in looking more precisely at the four quadrants built by sub-preferences. We conclude in the sixth section.
2
Individual determinants of preference for redistribution and
cross-countries differences: a survey of the literature
The literature is influenced by the seminal article by Meltzer and Richard (1981) that models the preference for redistribution to be determined by two factors; (i) how voters’ perception about redistribution is going to affect their life-cycle income, and (ii) how individuals perceive the “incentive cost” of redistribution for their fellow citizens (as high taxation and benefits are assumed to reduce the agents’ incentive to make efforts). Piketty (1995) interprets the first point as individual determinants, while the second point as social beliefs/values. People do not necessarily differ in their distributive goals, but they do not assess the incentive cost of redistribution and/or the relative importance of effort/luck in success in the same way.
As for the individual determinants of preference for redistribution, current income has been a relatively good predictor. However, the literature has struggled with how to explain the seemingly
following contradictory situation: some poor people are opposed to redistribution, although they may in theory from it. This can be seen in the results of elections with the high support rate for conservative candidates from lower middle-class categories (Guillaud, 2013). his may be explained by adding an inter-temporal dimension of taking into account social mobility. For the analysis of prospective upward mobility – the so-called POUM hypothesis introduced by Benabou and Ok (2001): ome poor or lower class people oppose because they expect to climb the social ladder through their individual effort and, in the case they succeed, they do not want to support their fellow citizens, who have not made the same effort. A. Alesina and La Ferrara (2005) argues that distinguishing subjective and objective mobility helps analyze the gap between the actual social mobility and its perception. The approach contributes to explain a robust stylized fact that social mobility is over-estimated in the US while it is underestimated in an European country like France (A. Alesina et al., 2001)4
As for the analysis of the impact of social values/beliefs, literature has been struggling with a risk of tautology. One example is the reference to different political backgrounds to explain divergent support for redistribution. This problem is even more serious in the case of international comparisons as the definition of political preference is strongly affected by the political landscape (see the attempt by Piketty (2018)). Another example is the reference to cultural characteristics to explain such differences, which often sounds as a “last resort” explanation referring to exogenous factors. The most convincing arguments in this field have mobilized a variety of concepts that may capture social values such as fairness (A. Alesina & Angeletos, 2005; A. Alesina, Angeletos, & Cozzi, 2013) or meritocracy (through the role of education, like in Kariya (2009)). In addition, Lefranc, Pistolesi, and Trannoy (2009), who defined different social values based on one’s evaluation of the respective contribution of effort, luck and circumstances to the final outcome. Given the better understanding about the general mechanism of individual preferences on redistri-bution (self-interest, including prospective mobility; social values), unraveling empirical mechanism of lasting differences across countries is insufficient. There are three major reasons for this: the em-pirical strategy that is usually used, the limited nature of the trans-Atlantic perspective, and the risk of endogeneity.
To empirically deal with cross-country differences, one option is to proceed by aggregation of the individual preferences into some socio-economic groups, to explain the national level differences by the distribution of the groups. This strategy was followed by Guillaud (2013), who studied the impact of professional occupation and socio-structure to explain, respectively, individual preferences and inter-countries differences. However, it is difficult to properly analyse the social beliefs that may play an additional role even at the aggregated level. In this context, we chose to jointly estimate the effects of individualistic and holistic determinants, as done by Fong (2001, 2006) or Linos and West (2003).
Furthermore, the simplest way to overcome the limited nature of the trans-Atlantic comparison is to include other countries. The trans-Atlantic dichotomy is likely to lead to a binary categorization
4 t is also important to distinguish between intra-generational mobility (one’s social trajectory seems to influence one’s
opinion concerning redistribution) and inter-generational mobility (e.g. dynasty effect in the learning model of Piketty (1995)).
(e.g. European pessimism vs. American dream). Moreover, it fails to identify multi-dimensional international differences. Hence, Japan was included.
Finally, as for the endogenous nature of some explanations regarding long-lasting cross-country differences, we combined two strategies: (i) identifying exogenous factors (land, history, culture, family structure, welfare systems, etc.) that may constitute plausible initial conditions at the origin of lasting differences and (ii) explicitly including complementarities and self-reinforcement mechanisms. This was used by Bénabou and Tirole (2006) and A. Alesina and Angeletos (2005) to explain the existence of multiple equilibria that may correspond to different configurations of inequalities and preferences for redistribution. Numerous studies look for exogenous factors that may explain the origin of the differences across countries. A. Alesina and Giuliano (2009) urveyed these papers and proposed the family structure as one candidate. The organization of the family varies a lot worldwide and may affect preferences of the desired level of government intervention in redistributive policies.
Regarding self-reinforcement mechanisms, A. Alesina and Angeletos (2005); Bénabou and Tirole (2006) emphasize the complementarities between social belief and welfare policies. This mechanism allows stable diversity across countries without relying exclusively on a cultural explanation, and the insights of models may help explaining the cross-country variation in perceptions about income inequality and choices of redistributive policies. This model assumes two types of agents, who expect society to reward individual effort/hard work, and government to intervene and correct market outcomes. These assumptions are based on the trans-Atlantic contrast, and the interactions of agents characterize two equilibria: the “belief in a just world” equilibrium and the “realistic pessimism” equilibrium.
Based on the hypothesis that ideas about what is “fair” influences preferences, A. F. Alesina, Cozzi, and Mantovan (2009) studied the dynamic evolution of economies, in which redistributive policies, perception of fairness, inequality and growth are jointly determined. They show how different initial conditions can lead to two permanently different steady states, especially through endogenizing individual perceptions on fair and unfair. This allows them to conclude about the endogenous evolution of ideology and tax policy. In particular, they show how temporary shock to preferences/ideology may have long-lasting effects.
Given the existing literature, we extend it in two ways. Firstly, we introduce multiple sub-preferences and secondly we go beyond the trans-Atlantic comparison. As long as we focus on single preference, the differences between countries are always located in the middle of two extremes by definition, and we cannot identify a potential third way. Fortunately, we can use sub-preferences in the data that helps us to enrich our understanding diversity.
3
Data & Empirical Strategy
The International Social Survey Programme (ISSP) is a survey conducted every year on a representative sample of people each in multiple countries. Each yearly questionnaire includes
socio-demographic variables and a thematic set of questions. The 2009 edition, carried out in August 2008 for 43 countries, is centred on questions about social inequality. As the survey uses a lot of subjective questions, it is highly relevant to our approach that focuses on ‘social beliefs’. The 2009 edition is the latest wave that focuses on inequalities. Unfortunately, in the previous waves (1987, 1992, 1999), the Japanese data are incomplete. Moreover, since the ISSP does not have a panel structure, it is at most repeated cross-sectional data at the individual level. Therefore, we do not intend to identify the causality in the analysis, but we focus on the correlation between sub-preference and other factors descriptively. This is why we focus here on the 2009 edition5.
Among the 43 countries surveyed in the 2009 edition of the ISSP, we focus on data from France, Japan and the USA. By contrast to the trans-Atlantic view, the Japanese case is particularly interesting, because it has reached in the 1970s-1980s a low level of inequality, more or less equivalent to the one in Sweden but “without redistribution through fiscal policy”, rather through an egalitarian compromise on wage sharing (Dore, 1994). From the 1980s, Japan has experienced an increase of wage income inequalities and it has been shown that the key driver was the industrial and labor market dynamics rather than the reform of the tax system (Moriguchi & Saez, 2006; Kambayashi, Kawaguchi, & Yokoyama, 2008). Therefore, the Japanese case, along with the US /France case, leads us to ask whether an increase of inequalities may affect the preference for redistribution and leads to more demand for redistribution.
The French sample size is 2,817 individuals large, the US sample includes 1,581 respondents, and the Japanese one counts 1,296. With a probability weight variable to correct for the sampling, the sample becomes representative of the population of each country. It also includes a set of socio-demographic variables. Table 3 shows the summary of statistics for the main variables of interest in ISSP 2009.
3.1 Choice of variables and controls
We look at two dimensions of the preference for redistribution: (i) sub-preference for government’s role in reducing income gaps between the rich and the poor and (ii) sub-preference for progressive taxation. As mentioned, one’s support of redistribution through government intervention is captured in the survey by the question, "Is it the responsibility of the government to reduce the difference in income
between between people with high incomes and those with low incomes?"6. The response is coded from 1 to
5 (from strongly disagree, disagree, neutral, agree to strongly agree). Another variable that could capture the preference for a redistributional policy would be the response to "Generally, how would you describe
taxes in <country> today for those with high incomes? Taxes are <answer>.". The answer range across five
5 The survey process, especially the process of interpretation between languages, is summarized in Gendall (2011).
The microdata of ISSP 2009 is available at Leibniz-Institute for the Social Sciences (GESIS) with registration. We downloaded the latest version at the time of analysis (23.05.2017). The identifier of dataset is ZA5400 (v4.0.0) at doi:10.4232/1.12777.
6From this point on, we will refer to redistributional government interventions as "redistributional policies" — not to be
confused with progressive taxation policy.
Table 3: Summary statistics: ISSP 2009
France Japan US
Count Mean s.d. Count Mean s.d. Count Mean s.d.
Is it gov’s respo to reduce inc. gap? (1-5) 2631 4.15 1.06 1080 3.54 1.19 1501 2.69 1.26
Is tax on the rich too low? (1-5) 2503 3.70 0.94 850 3.57 1.03 1459 3.29 1.10
’Inequality is too large’ 2681 0.91 0.28 1165 0.79 0.41 1573 0.68 0.47
’Better job status than father’ 2681 0.50 0.50 1165 0.19 0.39 1573 0.42 0.49
’Society is type A’ 2681 0.16 0.36 1165 0.10 0.30 1573 0.13 0.33
’Society is type B’ 2681 0.52 0.50 1165 0.35 0.48 1573 0.29 0.45 ’Luck is important’ 2681 0.36 0.48 1165 0.40 0.49 1573 0.56 0.50 ’Hardwork is important’ 2681 0.90 0.30 1165 0.95 0.21 1573 0.99 0.08 Age 2681 54.73 15.63 1165 48.69 17.47 1553 49.42 16.98 Gender 2681 0.51 0.50 1165 0.53 0.50 1573 0.55 0.50 9-12 years of education 2681 0.36 0.48 1165 0.57 0.50 1573 0.41 0.49 12-16 years of education 2681 0.32 0.47 1165 0.37 0.48 1573 0.42 0.49 >16 years of education 2681 0.20 0.40 1165 0.04 0.19 1573 0.13 0.34 Bottom quintile 2681 0.08 0.27 1165 0.22 0.41 1573 0.10 0.30 Second quintile 2681 0.10 0.30 1165 0.24 0.43 1573 0.14 0.35 Third quintile 2681 0.19 0.39 1165 0.16 0.36 1573 0.15 0.36 Fourth quintile 2681 0.34 0.47 1165 0.13 0.34 1573 0.25 0.44 Part-time employment 2674 0.09 0.29 1114 0.12 0.33 1572 0.11 0.32 Unemployed 2674 0.03 0.18 1114 0.02 0.15 1572 0.05 0.23 Student 2674 0.02 0.14 1114 0.08 0.28 1572 0.03 0.18 Retired 2674 0.40 0.49 1114 0.10 0.30 1572 0.17 0.38 House-person 2674 0.02 0.13 1114 0.18 0.38 1572 0.12 0.32 Disabled 2674 0.01 0.08 1114 0.02 0.14 1572 0.00 0.00
wrkst==Other,not in labour force 2674 0.02 0.13 1114 0.01 0.07 1572 0.04 0.19
Observations 2681 1165 1573
categories from much too low to much too high.
These two questions tackle the preference for redistiributional policy from different view point. While the first question focuses on the role of the government without specifying it concretely, the second one focuses on the progressivity of the tax system. The main benefits of comparing the determinants of these two dimensions are discussed below in section 3.3.
In addition, the survey includes interesting variables that should be related to sub-preferences. First, we proxy dissatisfaction with inequality with responses to the question "Are the differences in income in
your country too large?". If the respondent answers agree or strongly agree, the dummy takes the value of
one. Indeed we should expect that being unhappy with income gaps should lead to higher demand for redistributional policies. The correlation between dissatisfaction and the dependent variables can be perceived as the level of people’s confidence that the government or a more progressive tax rate can actually impact inequality and reduce income gaps.
Second, ISSP includes questions that specify beliefs about the drivers of social mobility. For example, the questions "How important is coming from a wealthy family? How important is having well-educated
parents?" capture one’s belief whether social mobility is determined by luck. As for the question "How important is hard work?", it captures people’s beliefs about the role of their own effort in social
success7.
7Almost 99% and 95% of American and Japanese respondents report that hard work is important for success respectively,
For control as to socio-demographic variables, we used age, gender, years of education, and marital status. As to economic variable, we included income (divided into four intra-countries quartile), employer dummies for the workers (self-employed, private sector, publicly owned firm, government, others), and indicators of owned capital and debt (not owning home, not owning stock, and "in the case the respondent sold all his capital", home debt and stock debts)8.
Through the ISSP dataset, specific variables related to social beliefs may be used. It provides multiple options, but we included dummies for those who believe that the shape is type A, an extreme inequality type with most people at the bottom of the ladder, type B, still a highly unequal one but at a lesser degree, and other, more equal types. Majority of people believe that the society is either one of these two types, A and B (27.3% and 33.9%, respectively). This is an important variable to be controlled, since those that think that society is unequal do not necessarily have to be dissatisfied with the level of inequality. Objective mobility of individuals should also be controlled. However, we cannot directly capture this across a certain period of time since the data set is cross-sectional. The measure of the actual mobility is therefore drawn from the studies of WID.world9. We match the level of income to the distributional placement estimated by the WID,
and the 20-year average decile income growth is attributed to each observation. As in the case of correcting income variables, here we calculated income growth of each deciles between 1990 to 2009 for the US, France and Japan. The choice to calculate the growth rate of the past twenty years is due to the fact that individuals do not expect policy change to happen more than 20 years from now10.
Rather than using imputed variables, the ISSP allows us to capture some self-evaluated notions of one’s mobility. For example, the survey asked each respondent to put themselves on a social ladder running from one to ten, based on their situation now and when they were growing up. Note, however, that this ranking and the difference between self-reported ladder position for today and the past can only be thought of as an ordinal indicator, which cannot be used to directly compare with other individuals. Interestingly, it allows us to capture the effect of self- perceived mobility.
3.2 Graphical Overview of Sub-preferences
Before going to the regression analysis, we show a graphical overview of the dependent variables. Figure 1a shows that the distribution of sub-preferences by income deciles differs from country to country. The sub-preference for government role in reducing income gap is generally the highest in France and the lowest in the US. The average response for France is 4.15, 3.54 for Japan, and 2.69 for the US. The US is the only country that is against redistribution policies at the aggregate level. A similar country-by-country difference can be found in the sub-preference for progressive tax as in
8See appendix A.1.1 on our correction of the income variable. For these parameters the owners of capital are our reference
group, as the housing values and stock values are subject to measurement error because of uncertainty of the respondents about the value of their assets "if they sold them"; what they give is a rough estimation. This is also why we use dummies for the non-owners of capital: the value of the debt declared by respondents is too imprecise to be used as a quantitative variable. However, we consider that dividing respondents in terms of capital into those who own, don’t own or are indebted is precise enough, as they should at least know to what category they belong.
9The World Inequality Database aims to provide open and convenient access to the most extensive available database on
the historical evolution of the world distribution of income and wealth, both within countries and between countries. See https://wid.world/.
10Intragenerational measure of social mobility is therefore more relevant.
Figure 1b, but the international difference here is smaller. More importantly, the relative position of two sub-preferences looks different between countries. In France, the support for redistributional policy locates above the support for progressive tax in general (average response is 3.70). In the US, the support for redistributional policy locates below the support for progressive tax (the average response is 3.29). In Japan, the location of two sub-preferences looks similar (the average response is 3.57). These relations indicate that the joint distribution of two sub-preferences may be different from each other, as shown in table 2.
Figure 1a also shows that the support for redistributional policy tends to deteriorate as income increases. Rich households tend to generally dislike redistributional policy from a pure income perspective, which is expected, given the impact of economic self-interest.
However, the slopes look differently across countries in figure 1b. In Japan, the support for progressive tax declines monotonically, as income increases. Meanwhile, the curves for France and for the US look rather like "inverse-U-shape": the lower decile income groups do not support the progressive tax as enthusiastically as middle income groups do. This may suggest that the POUM (Prospect Of Upward Mobility) hypothesis as discussed in Benabou and Ok (2001) is more present in the attitudes of the American and French citizens, by comparison to what is observed in Japan. We will discuss further this important point in the empirical results of the section 4.
The cross-country differences in the preference for redistribution that we observed in figure 1a and figure 1b, may have to do with the general attitudes and beliefs regarding the nature of inequality. Figure 1c shows the relation between the attitude towards inequality and income deciles and it confirms that the actual level of inequality does not seem to play as big a role as the voters’ belief on the inequality: regardless of income deciles, about 90% of the French believe that inequality is too large, while it is only about 70% in the US, with Japan being in between with about 80% agreeing so. This result is particularly interesting because that the actual pre-tax Gini coefficients are almost at the same level among the three countries, as noted above. Therefore, the data is consistent with the fact that Americans tends to underestimate the degree of inequality (whether wealth or income), while their European counterparts - especially the French - are more likely to overestimate it. The data also captures the general beliefs about how mobile one’s society and its structure in terms of inequalities is. Almost every American respondents (99%) believe that hard work is important; this number is also high in France, but 10% of the French thinks otherwise. When asked about the the shape of the society, only 42% of Americans say it is shape A or B, which represent the two most unequal distribution along the ladder (see figure 2). This number is much higher in France, with almost 70% percent of people thinking that the society is of type A or B.
Given that the European welfare states are generally more generous than that of the US, above figures confirm that the distribution of sub-preferences should be a candidate to explain the cross-country disparity. Dissatisfaction towards inequality naturally leads to demand for redistributional interventions
11, and the distribution of subjective beliefs about social mobility is consistent with this disparity.
Figure 1: Income and Preferences for Redistribution: Size and Structure (a) Preference for Government Role and Income
Deciles by Country 2.5 3 3.5 4 4.5 Pre fe re n ce f o r R e d ist ri b u ti o n (0 -5 sca le ) 1 2 3 4 5 6 7 8 9 10 Income Deciles France US Japan
(b) Preference for Tax on High Income and Income Deciles by Country 2.5 3 3.5 4 4.5 T a x to o l o w ? (1 -5 sca le ) 1 2 3 4 5 6 7 8 9 10 Income Deciles France US Japan
(c) Attitudes towards Inequality and Income Deciles by Country 2.5 3 3.5 4 4.5 Is th e i n co me g a p t o o l a rg e ? (1 -5 sca le ) 1 2 3 4 5 6 7 8 9 10 Income Deciles France US Japan 11
Figure 2: ISSP 2009: What does the society look like?
3.3 Two Sides of the Same Coin? — Similarities and Contradictions
Based on figures 1a and 1b , there are differences across countries regarding the two sub-preferences. In the US, the support for higher tax on the rich is systematically above the support for more government interventions. French respondents, meanwhile, report lower support for a more progressive taxation in comparison to the support on size of government intervention. In Japan, the average responses for the two questions are similar and are increasing at a very similar rate. The differences may explain the construction of the preferences for redistribution in each country.
Our two dependent variables —attitudes towards government role in reducing income gap, and towards
higher tax on the rich — capture demand for lower inequality and higher redistribution (i.e. the
preference for redistributional policy) in ways that can be considered similar. However, detailed analysis may lead to the identification of different aspects among them. The latter relates directly to a more progressive taxation, whether wealth or income, in comparison to the status quo scheme. The former relates not only to such demand, but also to the effects of economic and social policy that would reduce the income gap between those at the top and the bottom. Therefore, the distinction between the two questions must be carefully drawn, when one interprets the marginal effects of potential determinants of the preference. 12.
The attitude on progressive taxation could be thought of as the variable that captures the respondents’ perceived links between taxation and the supply of redistributional policy and welfare state. It may be expected that the translation of dissatisfaction in inequality to the demand for more progressive tax
12Note that one needs to consider how the questions are posed to the survey respondents since the level of concreteness
can significantly change the level of support for the topic asked. For attitude on progressive taxation, the question is asked directly in relation to the rich — which generally have been found to garner higher support than questions that ask vaguely whether one supports progressive taxation. Roberts, Hite, and Bradley (1994) conducted experiments on different question designs and concluded that this feature of tax-attitude questions stems from the conflict between one’s general fairness position and economic self-interests. As a result, we should expect that the question posed in the ISSP survey would draw higher level of agreement than – for instance – questions on progressive taxation, a more generic term. Another important point to note about this variable is that, generally, we can expect this answer to vary if different specific taxes are mentioned. Lewis and White (2006) found, for example, that response changes when respondents are asked about taxation as a whole or on inheritance tax specifically.
scheme is lower for societies, in which there are not a lot of visible links between amount of tax paid and the welfare benefits. This depends on political and social caveats at play, such as beliefs about social mobility (and more specifically, the POUM hypothesis), family structures, industrial relations, union participation rate, level of employee-employer co-determination, so on and so forth.
Meanwhile, the attitude towards government role in reducing inequality is more complex. First it relates directly to the trust in government and society13. Skepticism on the government’s ability—
whether it be from beliefs on the level of nepotism, representation issue, or corruption — is also important in determining answers to this question. Additionally, if the distance between the political preference of the respondents and the narratives of the government in power is large, then it is likely that the translation of this variable as the dissatisfaction with inequality will be valid (for example if the voter is left and the government is extreme right). Then, the important question is what the variable captures — the direct attitudes to the government in power, or the attitudes to the state in general. We believe that it is quite safe to assume that the variable captures the latter.
4
Evaluating the Determinants of Preferences for Redistribution:
Cross-Country Comparison
There is no particular difficulty to conceptualise the direct link between dissatisfaction with inequality and support for redistribution. If one believes that the allocation of economic resources should be more equally distributed, one will favour certain forms of redistribution to a certain extent. Our goal here is to assess and compare the degree to which discontent and other factors can impact political preferences in different contexts.
This section aims at statistically establishing some rough ideas on the degree of heterogeneity between countries. Therefore, we test the main hypotheses on the two aforementioned dependent variables: (i) response to whether government should reduce the income gap, and (ii) whether the tax rate for high income is too low.
We first consider the simplest model with only income quintiles and social beliefs. The dependent variables take the value of one if the respondent agrees or strongly agrees with the statements posted. Therefore, under our hypothesis, we should expect the coefficient on variables that capture the belief that society is mobile to be negative. The model is
Yi = α + Biγ + Iiδ1+ Wiδ2+ εi
Where Ii are dummies for the income quintile that the respondent i belongs in, Wi are some information on wealth and debts, and Bi captures beliefs and attitudes — if inequality is too large, if society is unequal, and if luck or hard work determines success in the society. We estimate the coefficients by OLS. To capture the heterogeneity between countries, the econometric models are estimated country by country. The summary of estimated results is shown in table 4.
13Trust in society could be captured by questions that pertain to self-reported level of others’ trustworthiness.
Table 4: Government Role and Higher Top Tax Rate
Gov. should reduce income gap Tax on the rich should increase
FR US JP FR US JP
Beliefs about society
’Society is type A’ 0.4616∗∗∗ 0.1520∗∗ 0.1296 0.3847∗∗∗ 0.2907∗∗∗ -0.0657
(7.19) (2.49) (1.27) (4.85) (3.75) (-0.48)
’Society is type B’ 0.2023∗∗∗ 0.0059 -0.0378 0.2658∗∗∗ 0.1469∗∗ -0.1153
(3.86) (0.10) (-0.68) (5.42) (2.40) (-1.85)
’Inequality is too large’ 1.2849∗∗∗ 0.8573∗∗∗ 1.1082∗∗∗ 0.7171∗∗∗ 0.6119∗∗∗ 0.5973∗∗∗
(11.76) (12.79) (13.99) (8.93) (12.24) (4.87)
’Luck is important’ 0.0953∗∗ 0.1788∗∗∗ 0.1039 -0.0078 -0.1137 -0.0185
(2.46) (4.80) (1.30) (-0.17) (-1.31) (-0.30)
’Hardwork is important’ -0.2950∗∗∗ -0.2459 -0.4270∗∗ -0.3202∗∗∗ -0.4200∗∗ -0.2158
(-4.73) (-0.78) (-2.85) (-3.33) (-3.16) (-1.53)
Income & Wealth (ref. = top quintile)
Bottom quintile 0.3885∗∗∗ 0.4712∗∗ 0.3949∗∗∗ 0.0191 -0.3248∗∗ 0.4806∗∗ (3.90) (3.12) (4.60) (0.15) (-2.44) (2.86) Second quintile 0.2862∗∗∗ 0.4836∗∗∗ 0.1783∗ 0.2311∗∗∗ 0.0080 0.4499∗∗∗ (3.63) (4.34) (1.92) (2.89) (0.08) (8.68) Third quintile 0.3986∗∗∗ 0.4134∗∗ 0.1859∗ 0.1994∗∗∗ 0.0486 0.3754∗∗∗ (6.09) (3.16) (2.12) (2.84) (0.44) (3.95) Fourth quintile 0.2951∗∗∗ 0.0921 0.1941∗ 0.1493∗∗∗ 0.1355 0.3632∗∗ (5.35) (1.09) (1.88) (2.87) (1.24) (2.97)
Has net financial debt -0.0307 0.2457 0.2100∗∗ -0.1606 -0.1214 -0.0081
(-0.19) (1.77) (2.98) (-1.22) (-0.73) (-0.04)
No financial assets nor debt 0.0916 0.0697 0.2301 0.0846 0.1162 -0.1420
(1.55) (0.62) (1.63) (1.06) (0.72) (-0.88)
Has net mortgage debt -0.0433 0.2330 -0.0116 -0.2619 0.0077 -0.1010
(-0.21) (1.30) (-0.11) (-0.67) (0.05) (-0.44) Has no mortgage 0.0156 -0.0312 -0.0385 -0.0492 0.0777 0.1218 (0.25) (-0.57) (-0.32) (-0.78) (0.75) (0.76) Constant 2.8000∗∗∗ 2.0069∗∗∗ 2.8215∗∗∗ 2.9862∗∗∗ 3.1928∗∗∗ 3.0448∗∗∗ (22.73) (6.73) (17.65) (26.38) (15.69) (18.27) Observations 2626 1501 1080 2499 1459 850 Adjusted R2 0.211 0.162 0.173 0.110 0.091 0.092 t statistics in parentheses ∗p < .10,∗∗p < .05,∗∗∗p < .01
We can see that not being in the top 20% generally means higher preference for redistribution. In the case of the demand for government role, French and Japanese respondents in the bottom 80% have relatively higher demand for redistribution, while it is only the bottom 60% in the US. Moreover, the model seems to suggest that a more progressive tax scheme is always less attractive than other forms of government intervention. In France, being in the bottom 20% does not lead to significant difference in sub-preference in comparison to the top 20%. For the US, it is the extreme —the bottom 20% are significantly less supportive of a higher tax rate on the rich than the top 20%, and there is no difference if one is in the middle 60% or in the top 20%. Notably, the effect of the relative position in
income distribution is generally high for the entire bottom 80% in the France and Japan —with that effect on the preference for higher tax on the rich to be the biggest in Japan.
The dissatisfaction with inequality translates into sub-preference for government intervention the most in France, and the least in the US. Yet, when we look at the model on sub-preference for higher top tax rate, dissatisfaction in inequality has the lowest impact on the dependent variable in Japan, even by comparison to the US, where progressive income tax rate is constantly debated. The Japanese case in table 4 confirms the interest of going beyond the trans-Atlantic view.
Generally we find that believing that success can be attributed to luck leads to higher sub-preference for increased government role in reducing income gaps in the case of France and the US. By contrast, believing that hard work is important carries a negative coefficient on sub-preference for redistribution. More concretely, as expected, relying on one’s own hard work reduces the response on government role by 0.30 for France, and 0.43 for Japan, but it is not statistically significant for the US, while for the question on tax rate, believing in hard work reduces the response by around 30 decimal points on average for France and the US, and not for Japan. Considering the society to be extremely unequal (type A), and unequal (type B) leads to a significantly higher sub-preference in both dimensions in the case of France. In the US, both beliefs have significant effects on the sub-preference for higher tax on the rich, but in case of sub-preference for government intervention, only "believing that the society is extremely unequal" leads to a significantly higher preference. Both carry no effect in Japan for either dependent variables.
However, surely there are omitted confounders since it is highly plausible that sub-preferences are not only determined by income, or beliefs, but also by some socio-economic variables such as occupation, level of education, employment status, and so on. We introduce here other demographic controls in the model below.
Yi = α + Biγ + Iiδ1+ Wiδ2+ Xiβ + εi
Xi captures the individual specific characteristics; age, gender, marital status, years of education, employment status, and types of employment. The summary of estimated results are in table 5.
Table 5: Government Role and Higher Top Tax Rate – adding controls
Gov. should reduce income gap Tax on the rich should increase
FR US JP FR US JP
Beliefs about society
’Society is type A’ 0.4748∗∗∗ 0.1473∗ 0.1751 0.4007∗∗∗ 0.3170∗∗∗ -0.0586
(7.73) (2.13) (1.83) (5.33) (4.69) (-0.42)
’Society is type B’ 0.2130∗∗∗ 0.0182 -0.0289 0.2608∗∗∗ 0.1408∗ -0.1040∗
(4.15) (0.27) (-0.64) (5.55) (2.10) (-1.90)
’Inequality is too large’ 1.3019∗∗∗ 0.8583∗∗∗ 1.0903∗∗∗ 0.7157∗∗∗ 0.6000∗∗∗ 0.5806∗∗∗
(12.12) (13.04) (12.32) (8.97) (13.02) (4.34)
’Luck is important’ 0.1211∗∗∗ 0.1921∗∗∗ 0.1028 -0.0155 -0.1467 0.0193
(3.05) (5.41) (1.08) (-0.34) (-1.72) (0.47)
’Hardwork is important’ -0.2945∗∗∗ -0.3358 -0.3726∗∗ -0.3035∗∗∗ -0.4133∗∗ -0.2411
(-4.73) (-0.96) (-2.42) (-3.17) (-3.09) (-1.81)
Income & Wealth (ref. = top quintile)
Bottom quintile 0.2220∗ 0.3635∗ 0.3353∗∗∗ -0.0812 -0.3104∗ 0.3856∗ (1.92) (1.89) (5.82) (-0.57) (-2.08) (2.24) Second quintile 0.1842∗∗ 0.4313∗∗ 0.1562∗ 0.1630∗ 0.0016 0.3850∗∗∗ (2.06) (3.19) (1.88) (1.91) (0.02) (4.86) Third quintile 0.3153∗∗∗ 0.3357∗∗ 0.1884∗∗ 0.1563∗∗ 0.0389 0.3422∗∗ (4.48) (2.74) (2.85) (2.11) (0.32) (2.55) Fourth quintile 0.2563∗∗∗ 0.0787 0.1492 0.1245∗∗ 0.1265 0.3488∗∗ (4.45) (1.02) (1.19) (2.53) (1.27) (2.85)
Has net financial debt 0.0086 0.1426 0.2169∗∗∗ -0.0999 -0.0847 -0.0399
(0.06) (1.01) (3.60) (-0.74) (-0.47) (-0.17)
No financial assets nor debt 0.0994∗ -0.0008 0.1356 0.0881 0.1270 -0.2154
(1.66) (-0.01) (0.83) (1.17) (0.74) (-1.26)
Has net mortgage debt 0.0037 0.2673 -0.0041 -0.2845 0.0359 -0.0617
(0.02) (1.53) (-0.05) (-0.79) (0.20) (-0.26)
Has no mortgage 0.0140 -0.0788 -0.0543 -0.0134 0.1664 0.1300
(0.21) (-1.54) (-0.45) (-0.20) (1.48) (0.83)
Observations 2565 1481 1027 2441 1439 802
Adjusted R2 0.230 0.195 0.171 0.133 0.107 0.098
t statistics in parentheses. Other control variables include age, age squared, gender, marital status (4 dummies; never
married, married, widowed, divorced), year of education (4 dummies; under 9 years, 9-12 years, 12-16 years, over 16 years), employment status (8 dummies; fulltime, parttime, unemployed, student, retired, house-person, disability, not in labor force.), type of employment (9 dummies; elementary occupation, managers, professional, technician, clerical, service, agriculture, craft, machine operator. See appendix A.3 for the full model
∗p < .10,∗∗p < .05,∗∗∗p < .01
Despite adding many controls, the coefficients on dissatisfaction with inequality and most beliefs about society do not change dramatically. With controls, believing that luck determines success translate to a 0.12 and 0.19 increase in the preference for government’s role in France and the US, while it is not significant for Japan. There is also no significant impact in the case of the preference for more progressive taxation for the three countries. Beliefs about the type of society do not have a significant impact in Japan, apart from the model on preference for higher tax on the rich, but it
is significant at 10 % level. The coefficient is not significant for those believing in the most extreme case of inequality (type A), and the coefficient for believing in type B is negative, contrary to what we expect — leading us to believe that it is not useful to interpret this result for Japan.
Moreover, we observe that the estimated impact of belonging to each income decile drops for every country and model, but the level of significance generally remains the same. Having higher levels of education translate to lower preference for government’s role apart from the case of the US, in which only those with 12-16 years of education exhibits on average significant decrease in comparison to those with lower than nine years of education.
The findings about France and the US are almost consistent to what are found the previous literature, while the comparison between sub-preferences and the inclusion of the Japanese case provide different insights to determine the distributive preferences. How much this statistical association explains the cross-country disparity can be shown by using the following Blinder-Oaxaca decomposition technique. Table 6 shows the decomposition of the baseline model summarized in table 5, to decompose the difference in the mean of sub-preference into the difference in the mean of explanatory variable and the difference in the coefficients.
Table 6: Oaxaca Decomposition of Table 5
Gov. should reduce income gap Tax on the rich should increase
FR-US FR-JP JP-US FR-US FR-JP JP-US
Observations 4051 3597 2508 3884 3247 2241 overall difference Group 1 4.15∗∗∗ 4.15∗∗∗ 3.54∗∗∗ 3.71∗∗∗ 3.71∗∗∗ 3.58∗∗∗ Group 2 2.68∗∗∗ 3.54∗∗∗ 2.68∗∗∗ 3.29∗∗∗ 3.58∗∗∗ 3.29∗∗∗ Difference(=Group 1- Group 2) 1.47∗∗∗ 0.61∗∗∗ 0.85∗∗∗ 0.42∗∗∗ 0.13∗∗∗ 0.29∗∗∗ contribution Endowments 0.12∗ 0.18∗ 0.17∗∗∗ 0.35∗∗∗ 0.03 0.05 Coefficients 1.01∗∗∗ 0.34∗∗∗ 0.79∗∗∗ 0.03 −0.14∗∗ 0.08 Interaction 0.34∗∗∗ 0.09 −0.11 0.03 0.24∗∗ 0.16 share Endowments Beliefs 16% 26% 10% 65% 51% 41%
Income & Wealth -2% -6% 13% -1% -23% -21%
Other controls -6% 10% -4% 22% -4% -2%
Coefficients
Beliefs 47% 82% 25% 103% 167% 87%
Income & Wealth -1% -5% -4% -6% -203% 47%
Other controls 23% -22% 72% -89% -70% -107%
Interaction
Beliefs 12% 15% 3% 0% 80% -19%
Income & Wealth 2% 10% -9% 2% 57% 43%
Other controls 9% -10% -7% 5% 46% 31%
* p<.10, ** p<.05, *** p<.01
The differences in the mean of sub-preference are shown in the third row of the first block for each of pair of countries. For both sub-preferences, the largest difference in the mean is found in the combination of France and the US — the combination of France and Japan having the least difference.
The second block summarizes the decomposition by distinguishing the sum of contributions of 17
coefficients and the sum of contributions of average of explanatory variables. For any pair of countries, the differences in sub-preference about governmental intervention can be explained by the difference in coefficients, especially those on social beliefs. This means that in each country, the statistical association from social beliefs to the sub-preference differs substantially; therefore, even if the countries had the same distribution of social beliefs, the national level preference would be different. On the contrary, in the case of the differences in the sub-preference on the progressive tax, we cannot find any common factor. The differences in each pair of countries can be explained differently. For example, in the pair of France and the US, the endowments matter, which means the trans-Atlantic contrast may come from the fact that people in the two countries have different social beliefs, different income/wealth, and different human capital. However, this is not true for the other pair of countries. While the coefficients of social beliefs can affect the sub-preference on taxation, this effect is totally cancelled by the coefficients of human capital. At least income and wealth do not explain the differences in sub-preferences.
To see a more detailed decomposition, we semi-aggregated the variables into three groups: social beliefs, income/wealth, and other controls. We reported the share of the difference in each group in the third, fourth, and fifth block of table 6. Firstly, it appears that one of the key differences between countries lie in the average level of different beliefs about society and attitudes towards inequality, and its explanatory power is generally stronger for the sub-preference for progressive tax rather than the sub-preference for governmental intervention. Since the endowments of income/wealth contributes oppositely, the total contribution of endowments looks smaller than coefficients. For example, in the case of France-US pair, the endowments of social beliefs already explain around 65% of the difference in the support for progressive tax, while they explain only 16% for the difference in sub-preference for governmental intervention. The contrasts are 51% versus 26% in the case of France-Japan, and 41% versus 10% in the case of Japan-US pair. It means that already existing differences in the average beliefs explains the national level differences in sub-preferences, especially in the case of the support to progressive taxation. The disparity between countries partially comes from the difference in endowments. Without Japan, we may underestimate the role of endowments in the disparity. Table 9 in the appendix shows a more detailed Blinder-Oaxaca decomposition. We see that the key driver of cross-country differences in the endowments for beliefs is the average level of dissatisfaction with inequality. France has the highest endowments of people who are dissatisfied with the level of inequality, while the US – as we suspected – has the least.
The second observation from table 6 is that the state of average income and wealth does not explain the difference in sub-preferences in general. As shown, the variation in ex-post income is massively larger in the US than in France. However, the larger discrepancy in the US does not always explain its deviation from the Continental European countries.
5
Further Discussion
5.1 Objective Social MobilityAccording to A. Alesina and La Ferrara (2005), the objective measures of social mobility are crucial to explain preference for redistribution. Here we construct the variable for the objective social mobility, and include it into the regression model simultaneously with the subjective social mobility measure. Unfortunately, since the data for the Japanese figures is incomplete, we give up to apply the Blinder-Oaxaca decomposition to this model. The estimated model is:
Yi = α + Mioζ + Misη + Biγ + Iiδ1+ Wiδ2+ Xiβ + εi
Misand Mio are subjective and objective measures of social mobility respectively.
Table 7: Government Role and Higher Top Tax Rate – full model
Gov. should reduce income gap Tax on the rich should increase
FR US JP FR US JP
Objective and subjective social mobility
1990-2009 Decile income growth 0.8418 -0.4117 4.9570 -0.2606
(0.23) (-0.62) (1.46) (-0.86)
Better ladder position 0.0169 -0.0435 -0.0840 -0.0354 -0.1421∗∗ -0.1510∗
(0.30) (-0.56) (-1.06) (-0.68) (-2.31) (-2.12)
’Better job status than father’ 0.0843∗ 0.0838 -0.0647 0.1128∗∗ -0.0981 0.1009
(1.70) (1.42) (-0.68) (2.06) (-0.93) (1.04)
Beliefs about society
’Society is type A’ 0.4586∗∗∗ 0.2088∗∗ 0.1700 0.4081∗∗∗ 0.3104∗∗∗ -0.0596
(7.33) (2.66) (1.79) (5.19) (3.83) (-0.43)
’Society is type B’ 0.1906∗∗∗ 0.0288 -0.0276 0.2555∗∗∗ 0.1207 -0.1017
(3.74) (0.40) (-0.64) (4.95) (1.82) (-1.79)
’Inequality is too large’ 1.3258∗∗∗ 0.8786∗∗∗ 1.0885∗∗∗ 0.7088∗∗∗ 0.6257∗∗∗ 0.5735∗∗∗
(12.15) (14.60) (12.54) (8.73) (12.91) (4.44)
’Luck is important’ 0.1210∗∗∗ 0.2205∗∗∗ 0.1045 -0.0088 -0.1271 0.0132
(2.82) (4.57) (1.13) (-0.18) (-1.56) (0.30)
’Hardwork is important’ -0.2757∗∗∗ -0.7803∗ -0.3656∗ -0.3126∗∗∗ -0.4726∗ -0.2502∗
(-4.17) (-2.26) (-2.25) (-3.13) (-1.88) (-1.90)
Income & Wealth (ref. = top quintile)
Bottom quintile 0.3709∗∗∗ 0.1984 0.3230∗∗∗ 0.0783 -0.5251∗ 0.3636∗ (2.80) (0.81) (4.55) (0.54) (-2.28) (2.04) Second quintile 0.3004∗∗ 0.3100∗ 0.1496∗ 0.1762 -0.1667 0.3630∗∗∗ (2.55) (1.88) (1.91) (1.60) (-1.05) (4.28) Third quintile 0.4144∗∗∗ 0.2384 0.1864∗∗ 0.1883∗∗ -0.0972 0.3307∗∗ (4.51) (1.37) (2.94) (2.22) (-0.75) (2.41) Fourth quintile 0.3388∗∗∗ 0.0264 0.1556 0.1861∗∗∗ 0.0381 0.3485∗∗ (5.19) (0.16) (1.27) (3.39) (0.34) (2.89)
Has net financial debt 0.0202 0.1738 0.2172∗∗∗ -0.0802 -0.0629 -0.0471
(0.14) (1.40) (3.80) (-0.60) (-0.37) (-0.20)
No financial assets nor debt 0.1073∗ 0.0009 0.1464 0.0891 0.1278 -0.2151
(1.75) (0.01) (0.92) (1.19) (0.82) (-1.27)
Has net mortgage debt 0.0054 0.2890 -0.0066 -0.2949 0.0751 -0.0570
(0.02) (1.85) (-0.08) (-0.80) (0.40) (-0.24) Has no mortgage 0.0153 -0.0720 -0.0617 -0.0285 0.1956 0.1168 (0.23) (-1.41) (-0.50) (-0.41) (1.73) (0.77) Demographics Age 0.0141 -0.0256∗∗ 0.0133 0.0393∗∗∗ 0.0034 0.0163 (1.37) (-2.64) (1.50) (3.80) (0.28) (0.94) Age2 -0.0002∗ 0.0002∗ -0.0002 -0.0003∗∗∗ 0.0001 -0.0002 (-1.67) (1.94) (-1.70) (-3.53) (0.44) (-0.95) Gender 0.1653∗∗∗ 0.2136∗∗∗ -0.0423 -0.0795∗ -0.0331 -0.1367∗ (3.12) (3.39) (-0.42) (-1.67) (-0.29) (-1.89) 9-12 years of education -0.2155∗∗∗ -0.3860 -0.9119∗∗∗ -0.0148 0.1969 -0.6114∗ (-3.25) (-1.38) (-4.40) (-0.19) (1.14) (-2.12) 12-16 years of education -0.3018∗∗∗ -0.6194∗∗ -1.0504∗∗∗ -0.0737 0.2434 -0.6849∗ (-3.47) (-2.36) (-4.41) (-0.79) (1.47) (-2.18) >16 years of education -0.2258∗∗ -0.3560 -0.9339∗∗∗ -0.0654 0.3015 -0.5930∗ (-2.42) (-1.02) (-3.46) (-0.62) (1.66) (-1.97)
Employment Status (ref. = full-time)
Part-time employment -0.0124 0.0968 -0.0322 -0.0792 0.2236∗ -0.0132 (-0.17) (0.91) (-0.32) (-0.98) (1.91) (-0.09) Unemployed -0.0140 0.1003 0.2910 0.0149 0.0211 -0.1930 (-0.13) (0.70) (1.84) (0.09) (0.23) (-0.57) Student 0.2196 -0.2942∗ 0.2254 0.2201 0.0810 -0.1467 (1.19) (-2.30) (1.83) (1.22) (0.50) (-1.02) Retired 0.0128 -0.1277 -0.0646 -0.0140 0.0484 -0.0562 (0.17) (-0.57) (-0.43) (-0.20) (0.30) (-0.43) House-person -0.2565 -0.3729∗∗∗ 0.1608 -0.2004 0.0379 0.0567 (-1.49) (-3.42) (1.04) (-1.43) (0.28) (0.34) Disabled 0.2207 0.0000 -0.1017 0.4848∗∗ 0.0000 -0.0053 (1.09) (.) (-0.32) (2.19) (.) (-0.01)
Other,not in labour force -0.1778 0.1152 0.2957 -0.0056 0.1524 -0.4092
(-0.72) (0.77) (1.58) (-0.03) (0.81) (-1.04)
Observations 2395 1374 1027 2280 1337 802
Adjusted R2 0.235 0.215 0.171 0.140 0.118 0.100
t statistics in parentheses
∗p < .10,∗∗p < .05,∗∗∗p < .01
This table excludes many controls. See appendix A.3 for the full model
In this model, the objective social mobility does not have any significant effect on preference for redistribution in all cases. For both dependent variables, believing that one’s job status has improved in comparison to one’s father leads to a significantly higher preference on average for the French respondents, but the effect is not significant in the cases of Japan and the US. At the same time, believing that one has moved up the social ladder leads to a significantly lower preference for higher tax on the rich for both the US and Japan: in both case, it corresponds to a 0.15 decrease.
5.2 Time Series Variation and mutual dependency of sub-preferences
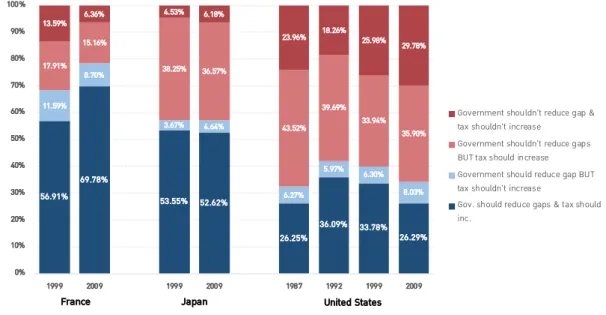
Up to the previous section, we have considered the two sub-preferences separately. Alternatively, it is possible to look at particular combinations of the two sub-preferences. In addition, the distribution of sub-preferences evolve over time even within one country. Figure 3 shows how the respondents in each survey respond differently over time to the two questions on government’s role in reducing income gap and the appropriateness of the tax level on the rich.
The majority of the French respondents are supportive of both higher government role in reducing income gaps, and for higher tax on the rich. Moreover, their proportions have increased overtime, between 1999 and 2009. In the case of Japan, it is a little less so, but still a majority supports both. Another large share of the Japanese respondents of around 40% think that the tax on the rich should increase, but the government should not try to reduce the income gap. Interestingly, the proportions of sub-preferences in Japan has been stable for 10 years. Lastly, in the case of the US, only 26-36% of the respondents say they support both. Around 40% says they think tax should increase, but does not support higher government role. In 2009, 30% of the US respondents disagree to both. The proportion of sub-preferences shifted toward anti-redistribution after the beginning of 1990s. However, in taking into account the distribution in 1987, it appears that the shift is not monotonic and it can be reversed.
Figure 3: Groups of respondents by variation in responds
56.91% 69.78% 53.55% 52.62% 26.25% 36.09% 33.78% 26.29% 11.59% 8.70% 3.67% 4.64% 6.27% 5.97% 6.30% 8.03% 17.91% 15.16% 38.25% 36.57% 43.52% 39.69% 33.94% 35.90% 13.59% 6.36% 4.53% 6.18% 23.96% 18.26% 25.98% 29.78% 0% 10% 20% 30% 40% 50% 60% 70% 80% 90% 100% 1999 2009 1999 2009 1987 1992 1999 2009
Government shouldn't reduce gap & tax shouldn't increase
Government shouldn't reduce gaps BUT tax should increase Government should reduce gap BUT tax shouldn't increase
Gov. should reduce gaps & tax should inc.
France Japan United States
Figure 4 shows the decomposition by income quintiles into each combination of responses14. In France, the increase in support for redistribution surprisingly comes from the top, fourth, and third quintiles. On the contrary in the US, the deterioration of support for redistribution since early 1990s is based on the decline of support and the increase in opposition to redistribution in the bottom and second quintiles. Compared to trans-Atlantic countries, the Japanese has experienced relatively stable situation in every quintile.
14We also try the decomposition by education level, dissatisfaction with inequality, and perceived type of society. See
other decompositions in appendix A.4.
Figure 4: Decomposition by Income Quintiles 65% 69% 62% 64% 45% 45% 39% 31% 7% 8% 3% 3% 22% 19% 21% 30% 15% 12% 3% 4% 6% 11% 13% 16% 13% 10% 32% 29% 27% 25% 27% 23% 0% 10% 20% 30% 40% 50% 60% 70% 80% 90% 100% 1999 2009 1999 2009 1987 1992 1999 2009 Bottom Quintile
Support Both Support Neither Sup. Only Gov. Sup. Only Tax
France Japan United States
68% 75% 58% 53% 36% 43% 39% 34% 9% 4% 3% 4% 14% 10% 17% 23% 9% 5% 4% 5% 11% 7% 7% 13% 13% 16% 34% 38% 38% 39% 37% 30% 0% 10% 20% 30% 40% 50% 60% 70% 80% 90% 100% 1999 2009 1999 2009 1987 1992 1999 2009 Second Quintile
Support Both Support Neither Sup. Only Gov. Sup. Only Tax
France Japan United States
56% 78% 47% 54% 26% 41% 42% 35% 12% 2% 4% 5% 22% 15% 25% 22% 11% 7% 4% 4% 8% 9% 5% 9% 21% 13% 45% 36% 44% 35% 28% 34% 0% 10% 20% 30% 40% 50% 60% 70% 80% 90% 100% 1999 2009 1999 2009 1987 1992 1999 2009 Third Quintile
Support Both Support Neither Sup. Only Gov. Sup. Only Tax
France Japan United States
37% 71% 48% 45% 27% 38% 30% 24% 28% 5% 4% 9% 19% 20% 27% 29% 10% 11% 1% 7% 7% 4% 7% 6% 25% 13% 46% 39% 46% 38% 36% 42% 0% 10% 20% 30% 40% 50% 60% 70% 80% 90% 100% 1999 2009 1999 2009 1987 1992 1999 2009 Fourth Quintile
Support Both Support Neither Sup. Only Gov. Sup. Only Tax
France Japan United States
17% 55% 40% 43% 16% 21% 26% 20% 41% 14% 9% 13% 31% 26% 33% 36% 27% 8% 8% 3% 3% 4% 5% 4% 14% 23% 43% 41% 49% 50% 37% 39% 0% 10% 20% 30% 40% 50% 60% 70% 80% 90% 100% 1999 2009 1999 2009 1987 1992 1999 2009 Top Quintile
Support Both Support Neither Sup. Only Gov. Sup. Only Tax
France Japan United States
These changes within each country may show the dynamics of preferences on redistribution, especially the heterogeneity of dynamics between countries. Since we can only see the distribution of two sub-preferences in time-series due to the data constraints, and since the regression results in the previous section are the outcomes of a static analysis, it is difficult to extend our discussion into the dynamic aspect of preferences. Given the political turbulence in France and the US, the figures above suggest that the changes in distribution of preferences are strongly related to the actual changes in political arena. The dynamic aspects of preference shall be considered in further studies.
6
Conclusive Remarks
As the redistribution policy works differently from country to country, we pursue the statistical decomposition of the preference on redistribution by focusing on potential explanatory variables such as social beliefs, income/wealth, and socio-economic characteristics. Our contribution is twofold: (1) we added a third term into the previous trans-Atlantic comparison: namely, Japan in addition to France and the US; (2) we investigated the multiple dimensions of preference for redistribution, namely, the preference on governmental intervention to reduce the income gap and the preference on more tax on the rich. Based on the ISSP 2009 Survey, the results are as follows: Rich people tend to be unsupportive of the redistribution in the three countries, but poor people are not always supportive of this policy, as previously explained by the POUM hypothesis, among others. The data shows that it is true for both sides of the Atlantic, but not for Japan. The data also shows that subjective/perceived inequality is strongly correlated to preference for redistribution, but it may be inconsistent to the actual/objective situation of inequality: while the US people underestimate the inequality and tend to oppose to redistribution, French people overestimate it and are generally favorable to its correction through policy. Moreover, by distinguishing sub-preferences, in all three countries, we identify a significant group of people supporting the governmental intervention to reduce the income gap but not supporting the idea of more tax on the rich shares substantially. This group is particularly visible in Japan.
This observation suggests that the preference on redistribution consists of multiple dimensions. Given the fact that ISSP 2009 explicitly asks respondents about the responsibility of government and about the evaluation of state of taxation, we propose the following interpretation: the sub-preference for the governmental intervention implies how much the respondents rely on the role of a third party entity, while the sub-preference for tax on the rich implies how much the respondents perceive the horizontal relationship between people 15. Therefore, the introduction of multiple dimensions and the non-trans-Atlantic case in this research is beneficial to examine the preference for redistribution from the viewpoint of how people differently perceive their society and its structure.
To reveal a more detailed composition of sub-preferences statistically, we examined the country-by-country OLS regressions. We found that the dissatisfaction with inequality translates to sub-preference for government intervention the most in France, and the least in the US. Yet, when we look at the model on sub-preference for higher top tax rate, dissatisfaction in inequality has the lowest impact on the dependent variable in Japan even in comparison to the US, where progressive income tax rate is constantly debated.
To examine the difference in the sub-preferences between countries, we relied on the Blinder-Oaxaca decomposition technique, rather than directly comparing the estimated coefficients. The difference in the sub-preference on the governmental intervention between countries mainly comes from the difference in coefficients, especially those for social beliefs. However, we were unable to identify the
15Another potential explanation is that the sub-preference for the governmental intervention is the proxy of the desired
size of fiscal policy and the sub-preference for the tax on the rich is the proxy of the favorite direction of resource reallocation (see also Barnes (2015) in this spirit).
dominant factor common among countries as regards the difference in the sub-preference on more tax on rich.
The difference in average social beliefs matters, while the average income and wealth does not explain the differences in preference. In general, countries have different distribution of social beliefs, and this is one of the factors that produce the difference in sub-preferences. This paper found that this is only one side of coin, because not only the distribution of social beliefs, but also their statistical relation to the sub-preferences explains the country level disparity. Especially, when we add Japan into sample, we find a larger role of social beliefs than what the usual conclusion based on a trans-Atlantic comparison. This implies that the effect of social beliefs on the preference for redistribution does not follow a universal model, and we need more (diverse) countries in our international comparison perspective.