HAL Id: hal-03129642
https://hal.archives-ouvertes.fr/hal-03129642
Submitted on 8 Feb 2021
HAL is a multi-disciplinary open access
archive for the deposit and dissemination of
sci-entific research documents, whether they are
pub-lished or not. The documents may come from
teaching and research institutions in France or
abroad, or from public or private research centers.
L’archive ouverte pluridisciplinaire HAL, est
destinée au dépôt et à la diffusion de documents
scientifiques de niveau recherche, publiés ou non,
émanant des établissements d’enseignement et de
recherche français ou étrangers, des laboratoires
publics ou privés.
Coarse woody debris are buffering mortality-induced
carbon losses to the atmosphere in tropical forests
Hui Yang, Philippe Ciais, Jérôme Chave, Yuanyuan Huang, Ashley
Ballantyne, Kailiang Yu, Fabio Berzaghi, Jean-Pierre Wigneron
To cite this version:
Hui Yang, Philippe Ciais, Jérôme Chave, Yuanyuan Huang, Ashley Ballantyne, et al.. Coarse woody
debris are buffering mortality-induced carbon losses to the atmosphere in tropical forests.
Envi-ronmental Research Letters, IOP Publishing, 2021, 16 (1), pp.011006. �10.1088/1748-9326/abd58a�.
�hal-03129642�
PERSPECTIVE • OPEN ACCESS
Coarse woody debris are buffering mortality-induced carbon losses to
the atmosphere in tropical forests
To cite this article: Hui Yang et al 2021 Environ. Res. Lett. 16 011006
View the article online for updates and enhancements.
Environ. Res. Lett. 16 (2021) 011006 https://doi.org/10.1088/1748-9326/abd58a OPEN ACCESS RECEIVED 4 September 2020 REVISED 13 December 2020
ACCEPTED FOR PUBLICATION
21 December 2020
PUBLISHED
13 January 2021
Original content from this work may be used under the terms of the
Creative Commons Attribution 4.0 licence. Any further distribution of this work must maintain attribution to the author(s) and the title of the work, journal citation and DOI.
PERSPECTIVE
Coarse woody debris are buffering mortality-induced carbon
losses to the atmosphere in tropical forests
Hui Yang1
, Philippe Ciais1
, J´erˆome Chave2
, Yuanyuan Huang3
, Ashley P Ballantyne1,4
, Kailiang Yu1
, Fabio Berzaghi1
and Jean-Pierre Wigneron5
1 Laboratoire des Sciences du Climat et de l’Environnement, LSCE/IPSL, CEA-CNRS-UVSQ, Universite´Paris-Saclay,
Gif-sur-Yvette 91191, France
2 Laboratoire Evolution et Diversite´Biologique, Universite´Paul Sabatier, Toulouse, France 3 CSIRO Oceans and Atmosphere, Aspendale 3195, Australia
4 Department of Ecosystem and Conservation Sciences, W.A. Franke College of Forestry and Conservation,
University of Montana, Missoula, MT 59812, United States of America
5 ISPA, UMR 1391, INRAE Nouvelle-Aquitaine, Universit´e de Bordeaux, Villenave d’Ornon, France
E-mail:huiyang@lsce.ipsl.fr
Keywords: tropical forests, coarse woody debris, mortality, carbon budget Supplementary material for this article is availableonline
1. Introduction
Across tropical forests, inventory plots provide key evidence of pervasive changes in forest biomass. The data from different networks of forest invent-ory plots have been used to estimate the mean car-bon sink in tropical forest biomass, and its changes due to disturbances and other environmental drivers (Phillips et al2002, Gloor et al2009, Lewis et al2009, Pan et al2011, Mitchard2018). For example, previ-ous studies showed emerging relationships between biomass losses, gains, and cumulative water deficits during drought years in the Amazon (Phillips et al 2009, Lewis et al2011) and a decreased trend of the carbon sink in biomass across the Amazon as a res-ult of increased tree mortality (Brienen et al2015), whereas no detectable trend was found for Africa (Hubau et al2020).
In the above-mentioned and inventory-based studies (Brienen et al2015, Hubau et al2020), the car-bon balance of forest aboveground biomass (AGB) is calculated as a difference between carbon gains (tree recruitment and growth) and losses (tree mortality and decomposition) across successive sampling cam-paigns. Such changes in forest aboveground biomass (∆AGB) has been interpreted as being equivalent to the net land–atmosphere carbon exchange. We argue here that this interpretation is inaccurate because tree mortality does not cause an instantaneous CO2 emis-sion to the atmosphere, rather a lagged CO2 emis-sion from decaying coarse woody debris (∆CWD), litter, and soil pools. Ignoring soil, branch, and fine litter changes, net biome productivity in bio-mass (NBPB) accounts for the net change of live and dead biomass in terrestrial ecosystems at large
temporal and spatial scales, and can be calculated as NBPB= ∆AGB + ∆CWD.
In this study, we adopt a simple first-order kinetics model to simulate carbon emissions from the decomposition of CWD from dead trees at the scale of continental African and Amazonian wet trop-ical forests. This is achieved by using observations of stocks and turnover rates of the CWD carbon pool. Our objective is to provide insight into the difference between NBPB and ∆AGB. To do so, we simulate the decay of CWD lagging tree mortality from a previous forest inventory synthesis. The key application is to contrast the reported saturation of the increase of ∆AGB (Hubau et al2020) with the trend of NBPB. We hypothesize that NBPBshould sat-urate less rapidly than ∆AGB due to the fact that a large fraction of the carbon in dead trees con-verted to CWD has not yet been released to the atmosphere.
2. Modeling the lag in the
mortality-related carbon release
Mortality of whole trees or branches forms CWD that can be decomposed by microbial processes in the soil. In this study, for the Amazonian forests, we use field-measured and estimated CWD decompos-ition rates from Palace et al (2012) and Brienen et al (2015) (see supplementary material which is avail-able here stacks.iop.org/ERL/16/011006/mmedia). Assuming that influx and outflux are in approximate equilibrium, the decomposition rates values reported by Brienen et al (2015) and Palace et al (2012) were calculated using observed CWD production divided
Environ. Res. Lett. 16 (2021) 011006 H Yang et al
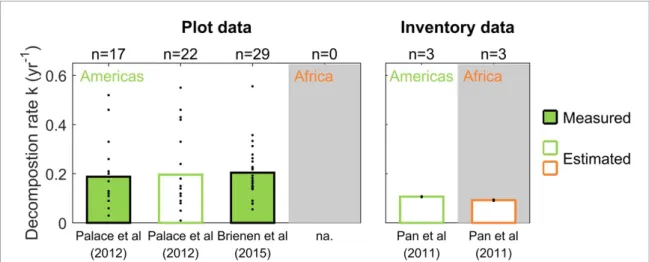
Figure 1. Measured and estimated first-order exponential CWD decomposition rates k (yr−1) in American (green) and African (orange) intact tropical forests. The k-values in American intact tropical forests were calculated using plot measurements (Palace
et al2012, Brienen et al2015) and mean inventory data (Pan et al2011). The values in Africa were only derived from mean inventory data. Histogram bars are mean values and dots present individual plot data.
by observed CWD stock (labeled as ‘Measured’ in figure 1). Besides, Palace et al (2012) also estim-ated the decomposition rates values at various sites without observed CWD production, using a simple estimate of CWD production, i.e. the product of biomass and a constant mortality rate of 0.02 yr−1 (labeled ‘Estimated’ in figure 1). Here we use the same method to estimate decomposition rates using aggregated forest inventory data from Pan et al (2011). That is, we calculate CWD production using the mean forest total living biomass and a mortal-ity rate of 0.02 yr−1; and inferred the mean CWD decomposition rate as the ratio of production to their reported mean CWD stock.
For Amazonian forests, based on field measure-ments (Palace et al 2012, Brienen et al 2015), we find CWD decomposition rates ranging from 0.01 to 0.56 yr−1, with a mean value of 0.20 yr−1; This is equivalent to a turnover time of ∼5 year. The large spread comes from inter-plot differences. Using mean inventory data around the years 1990, 2000 and 2007 (Pan et al2011), we find CWD decom-position rates ranging from 0.10 to 0.11 yr−1, with a mean value of 0.11 yr−1; This is equivalent to a turnover time of∼9 years. For African forests, no field data were available and the mean inventory data from Pan et al (2011) provide a mean value of 0.09 yr−1 (turnover time∼ 11 years). The decomposition rates of CWD appear to be slightly lower in African forests compared to Amazon forests potentially resulting in longer carbon turnover times, although this differ-ence needs to be confirmed by field measurements of CWD production and stock.
Through decomposition, carbon from CWD is partly released to the atmosphere via heterotrophic respiration, partly transformed to fine litter and soil carbon pools via fragmenting litter, and partly leached to dissolved organic carbon. Respiration comprises the majority of carbon lost during CWD
decay (Harmon et al 2020), so we assumed here that the decay loss of CWD goes directly into the atmosphere as CO2. The change in carbon stocks of CWD over time on a yearly time step dCWD/dt is calculated by the difference between incoming and outgoing fluxes, given by:
dCWD/dt = I(t)− k′CWD (t) . (1) The incoming flux, I(t) is the mortality of trees and other components (e.g. branches) forms at time t. Here we make the approximation that I(t) can be estimated from above- and below-ground tree bio-mass mortality, thus ignoring branches and woody debris intercepted by the canopy. AGB in living stems from inventory plots is calculated by using an allo-metric equation with tree diameter, tree height and wood mass density (Chave et al2014). Below-ground tree biomass mortality is estimated using regionally specific root–shoot ratios from FRA 2020 report (i.e. Africa: 0.30; Amazon: 0.24; FAO2020). We acknow-ledge that this approach can underestimate the total CWD inputs, by not considering the branches and other woody debris. The outgoing flux is assumed to follow the first-order decay equation (1) with a con-stant decomposition rate k deduced by the different methods as explained above. The non-decomposed CWD fraction during year t, i.e. (1− k) × CWD(t), remains in the CWD pool to be decomposed in subsequent years.
Dead trees decay slowly (Palace et al 2012) and thus delay CO2emissions to the atmosphere after big mortality events. As shown in figures2(a) and (b), when we apply equation (1) to AGB data from long-term monitoring plots (Hubau et al 2020), the net CO2losses including CWD buffering in both Amazo-nian and African forests during the 1980s are smal-ler than when assuming yearly I(t) is returned imme-diately as CO2 to the atmosphere, for instance as 2
Environ. Res. Lett. 16 (2021) 011006 H Yang et al
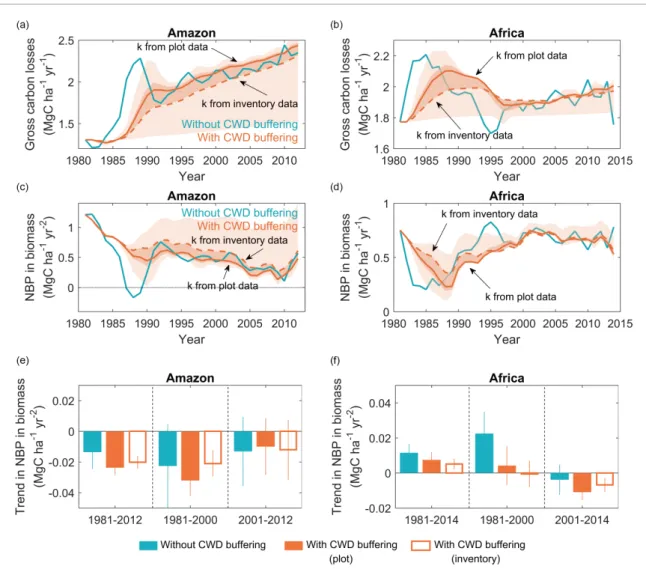
Figure 2. (a), (b) Gross carbon losses of intact tropical forests with CWD buffering (orange) and ignoring CWD, i.e. assuming tree mortality is carbon immediately lost to the atmosphere (blue) in Amazon (a) and Africa (b). (c), (d) Net biome productivity in biomass with and without CWD buffering. Solid curves present the gross carbon losses and NBPBusing estimates of
decomposition rate k from plot measurement and inventory data. Colored shadings in (a)–(d) represent the uncertainty in gross carbon losses and NBPBresulting from the use of different decomposition rates k. The darker color shading represents the
inter-quantile range, while the light shadings represent the minimum and maximum of an available range. The uncertainty for African forests in (b) and (d) was estimated using plot-scale k estimates from Amazonian forests. (e), (f) Trends in NBPBof intact
tropical forests with and without CWD buffering during three periods (i.e. 1981–2012/14, 1981–2000, 2001–2012/14). Slope and its standard deviation of the solid and dashed curves in (a)–(d) are calculated using least-squares linear regressions.
reasoned by e.g. Mitchard (2018). Conversely, high tree mortality during the 1980s resulted in continuous CO2losses in subsequent decades, causing net CO2 losses to be higher than that without CWD buffering.
3. The buffering effects on carbon balance
and its decadal trends
The gross carbon losses from AGB of intact tropical forests are shown in figures 2(a) and (b), using data from Hubau et al (2020). These gross carbon losses from biomass are not gross CO2 emissions to the atmosphere, since carbon from dead wood is transformed to CWD before it gets oxidized into CO2. Considering the decay rate of CWD fed by tree mortality (see details in section2), we find that the interannual variability in the gross carbon loss flux to the atmosphere is greatly reduced due to carbon remaining in CWD after mortality, in both
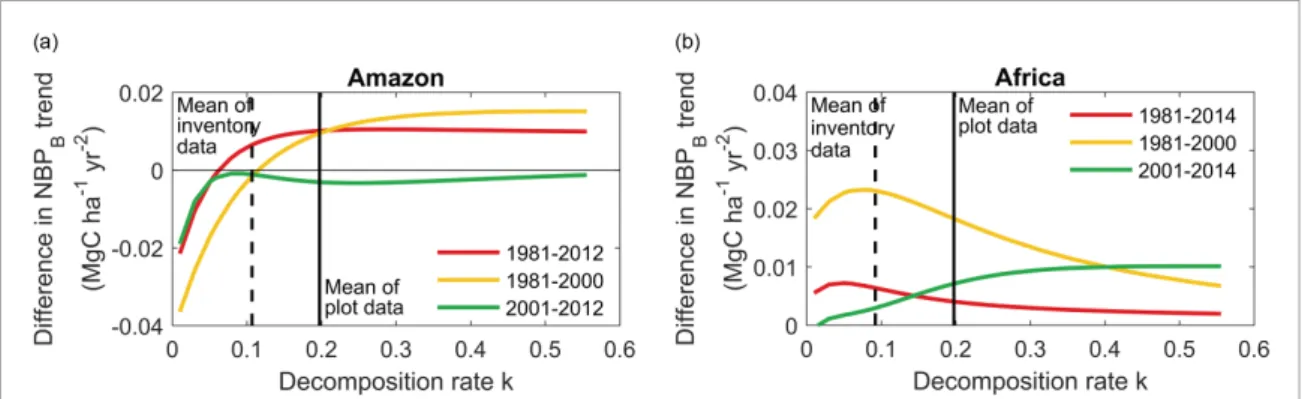
Amazon and African forests (figures 2(a) and (b)). The reconstructed NBPBincluding the mass balance of CWD is shown in figures2(c) and (d). It shows a dampening of quasi-annual NBPBfluctuations com-pared to those of ∆AGB. In figure2(e), comparing decadal trends of NBPBversus ∆AGB, we observe a faster and significant decrease of the NBPB carbon sink in the Amazon during 1981–2000 but a slower decrease during 2001–2012. A smaller decadal trend of NBPBversus ∆AGB typically occurs if the decom-position rate k is greater than 0.1 (figure3(a)). For Africa, we find no trend of NBPB compared to the positive trend of ∆AGB reported by Hubau et al (2020) during 1981–2000, and a slight, significant and negative trend of NBPB after 2001, regardless of decomposition rates k (figure3(b)). Compared to ∆AGB trends, our estimates of NBPB trends give a more nuanced picture of the ‘divergence’ of carbon sinks highlighted by Hubau et al (2020). Namely, 3
Environ. Res. Lett. 16 (2021) 011006 H Yang et al
Figure 3. The relation between decomposition rate k and differences in trends of net carbon sink with and without CWD buffering (‘with CWD buffering’− ‘without CWD buffering’) in Amazon and Africa during three periods, i.e. 1981–2012/14 (red), 1981–2000 (yellow), 2001–2012/14 (green). The solid and dashed vertical lines indicate the mean of decomposition rate k from plot data and from inventory data. Note that all the plot-scale k estimates come from Amazonian forests.
the African and Amazonia sinks from AGB diverge since the early 1990s, whereas the NBPBsinks diverge only after the late 1990s. Accounting for the buf-fering effect of CWD, regional NBPB estimates are expected to be more directly comparable to net land– atmosphere CO2 exchange estimates independently obtained by atmospheric inversions. Nonetheless, the definition of net CO2fluxes estimated by atmospheric inversions is different from regional NBPB in our study. The component fluxes of soil and litter decom-position, leaching from soil and subsequent river out-gassing (Lauerwald et al2015, Hastie et al2018) are included in inversions, but not in our definition of NBPB. The role of soil and litter respiration coupled to AGB and CWD dynamics is not modeled in this study, due to the lack of long-term respiration data across sites. Specific site studies showed that the frac-tion of CWD entering into soil organic carbon (SOC) pools and being respired has a significant effect on the net land–atmosphere CO2 flux at the ecosystem scale (Chambers et al2004, Sierra et al2007). With litter and SOC turnover rates from tropical sites, our approach could be extended to include subsequent carbon loss pathways due to respiration as a result of tree mortality.
The effects of including CWD on NBPB trends and inter-annual variability depend on the values of CWD decomposition rates: a high decomposition rate induces less buffering of carbon emissions from CWD. The value of k is determined by tree spe-cies, diameter, position (i.e. standing versus downed), canopy openness, as well as microclimate (Harmon et al2020). However, due to a lack of relevant obser-vations, we coarsely simplify the analysis and use regionally averaged constant decomposition rates for Amazonian and African forests. In addition, disturb-ance events such as fire, extreme drought, insect out-breaks, storms, and land management can also alter decomposition rates, influencing the terrestrial car-bon dynamics (Luo et al2017, Pugh et al2019), but the box model of equation (1) does not explicitly incorporate the impact of disturbances on decay rates.
These points suggest that higher decomposition rates could be associated with forests with higher mortality rates, which tend to have large size, low wood density, and experience higher disturbance rates (Phillips et al 2010), resulting in covariance between CWD decay and aboveground turnover that is not accounted for in this study. Future work is needed to quantify the effects of CWD decomposition on trends and inter-annual variability in carbon sink for different tree sizes, species, traits, disturbance history, and not just for tropical forests, but for semi-arid, temperate and boreal ecosystems. This buffering capacity of CWD may have even longer legacy effects when the value of the decomposition rate is even smaller resulting in longer carbon turnover times in semi-arid and cooler temperate forests.
In summary, our analysis helps carbon cycle sci-entists and policy-makers to appreciate that results from Hubau et al (2020) and similar studies do not represent carbon fluxes exchanged with the atmo-sphere contributing to annual variations of the CO2 growth rate. We propose a simple attempt to translate AGB carbon changes observed on the ground into the CO2flux to the atmosphere. We estimate the lagged CO2release via CWD decomposition after tree mor-tality in Amazonian and African forests. When con-sidering CO2released by CWD decay, net CO2losses to the atmosphere in both Amazonian and African forests during the 1980s are smaller than observed biomass drops. The high tree mortality during the 1980s legates a continuous CO2 loss in subsequent decades. Such persistent carbon losses after mortal-ity can alter the trends of atmospheric CO2: more pronounced decreases of the NBPB carbon sink in the Amazon during 1981–2000 but a weaker increase of carbon sink in Africa during the past three dec-ades, once the lagged CWD decay are accounted for. Local evidence that CWD emissions partly or entirely offset biomass gains (recovery) has also been doc-umented at old-growth Amazonian forest sites. For instance, Rice et al (2004) found that losses from CWD turned their study site into a source, whereas 4
Environ. Res. Lett. 16 (2021) 011006 H Yang et al
tree gains were a sink. A consistent result was reported by Saleska et al (2003) at the Santarem forest sites recovering from disturbance that occurred 30 years ago. These site-level results show a net AGB gain but a new CO2 source, supporting our perspective that the incomplete characteristics of carbon balance could lead to a biased estimate of carbon flux in the tropics. This highlights the importance of under-standing how tree mortality and subsequent decom-position affect the carbon balance of tropical eco-systems. The missing component fluxes, such as soil and litter respiration should be taken into account in the future, further improving our predictions of regional carbon dynamics under future climate scenarios.
Data availability statement
The inventory data from Hubau et al (2020) are openly available at the following URL/DOI: https://doi.org/10.1038/s41586-020-2035-0. The plot-scale CWD decomposition rate k estimates from Amazonian forests from Brienen et al (2015) and Palace et al (2012) were listed in the supporting information.
Acknowledgments
HY and PC acknowledges support from the CCI Biomass project funded by the European Space Agency. PC acknowledges support from the European Research Council Synergy project SyG-2013-610028 IMBALANCE-P and the ANR CLAND Convergence Institute. FB was funded by the European Union’s Marie Skłodowska-Curie Grant No 845265.
ORCID iDs
Hui Yanghttps://orcid.org/0000-0001-6454-8954 Philippe Ciais https://orcid.org/0000-0001-8560-4943
Fabio Berzaghi https://orcid.org/0000-0002-9139-8274
Jean-Pierre Wigneron https://orcid.org/0000-0001-5345-3618
References
Brienen R J et al 2015 Long-term decline of the Amazon carbon sink Nature519 344–8
Chambers J Q, Tribuzy E S, Toledo L C, Crispim B F, Higuchi N, Santos J D, Ara´ujo A C, Kruijt B, Nobre A D and Trumbore S E 2004 Respiration from a tropical forest ecosystem: partitioning of sources and low carbon use efficiency Ecol. Appl.14 72–88
Chave J et al 2014 Improved allometric models to estimate the aboveground biomass of tropical trees Glob. Change Biol.
20 3177–90
FAO 2020 Global Forest Resources Assessment 2020: main report Rome
Gloor M et al 2009 Does the disturbance hypothesis explain the biomass increase in basin-wide Amazon forest plot data?
Glob. Change Biol.15 2418–30
Harmon M E, Fasth B G, Yatskov M, Kastendick D, Rock J and Woodall C W 2020 Release of coarse woody detritus-related carbon: a synthesis across forest biomes Carbon Balance
Manage.15 1–21
Hastie A, Lauerwald R, Weyhenmeyer G, Sobek S, Verpoorter C and Regnier P 2018 CO2evasion from boreal lakes: revised
estimate, drivers of spatial variability, and future projections
Glob. Change Biol.24 711–28
Hubau W et al 2020 Asynchronous carbon sink saturation in African and Amazonian tropical forests Nature579 80–87
Lauerwald R, Laruelle G G, Hartmann J, Ciais P and Regnier P A 2015 Spatial patterns in CO2evasion from the global river
network Glob. Biogeochem. Cycles29 534–54
Lewis S L et al 2009 Increasing carbon storage in intact African tropical forests Nature457 1003–6
Lewis S L, Brando P M, Phillips O L, van der Heijden G M and Nepstad D 2011 The 2010 Amazon drought Science
331 554
Luo Y et al 2017 Transient dynamics of terrestrial carbon storage: mathematical foundation and its applications Biogeosciences
14 145–61
Mitchard E T 2018 The tropical forest carbon cycle and climate change Nature559 527–34
Palace M, Keller M, Hurtt G and Frolking S 2012 A review of above ground necromass in tropical forests Tropical Forests Sudarshana P Ed (Rijeka: Intech) pp 215–52
Pan Y et al 2011 A large and persistent carbon sink in the world’s forests Science333 988–93
Phillips O L et al 2002 Changes in growth of tropical forests: evaluating potential biases Ecol. Appl.12 576–87
Phillips O L et al 2009 Drought sensitivity of the Amazon rainforest Science323 1344–7
Phillips O L et al 2010 Drought–mortality relationships for tropical forests New Phytol.187 631–46
Pugh T A, Arneth A, Kautz M, Poulter B and Smith B 2019 Important role of forest disturbances in the global biomass turnover and carbon sinks Nat. Geosci.12 730–5
Rice A H, Pyle E H, Saleska S R, Hutyra L, Palace M, Keller M, De Camargo P B, Portilho K, Marques D F and Wofsy S C 2004 Carbon balance and vegetation dynamics in an old-growth Amazonian forest Ecol. Appl.14 55–71
Saleska S R et al 2003 Carbon in Amazon forests: unexpected seasonal fluxes and disturbance-induced losses Science
302 1554–7
Sierra C A, Harmon M E, Moreno F H, Orrego S A and Del Valle J I 2007 Spatial and temporal variability of net ecosystem production in a tropical forest: testing the hypothesis of a significant carbon sink Glob. Change Biol.
13 838–53