HAL Id: hal-00707461
https://hal.archives-ouvertes.fr/hal-00707461
Submitted on 12 Jun 2012
HAL is a multi-disciplinary open access
archive for the deposit and dissemination of
sci-entific research documents, whether they are
pub-lished or not. The documents may come from
teaching and research institutions in France or
abroad, or from public or private research centers.
L’archive ouverte pluridisciplinaire HAL, est
destinée au dépôt et à la diffusion de documents
scientifiques de niveau recherche, publiés ou non,
émanant des établissements d’enseignement et de
recherche français ou étrangers, des laboratoires
publics ou privés.
them
Camille Salinesi, Raúl Mazo
To cite this version:
Camille Salinesi, Raúl Mazo. Defects in Product Line Models and how to Identify them. Abdelrahman
Elfaki. Software Product Line - Advanced Topic, InTech editions, pp.50, 2012, 978-953-51-0436-0.
�hal-00707461�
Defects in Product Line Models
2
and How to Identify Them
3
Camille Salinesi and Raúl Mazo
4
CRI, Panthéon Sorbonne University
5
France
6
1. Introduction
7
The history of software and system development shows that abstraction plays a major role
8
in making complexity manageable (Bosch 2000). Thus, abstracting the common and variable
9
artefacts of an undefined collection of products and organising them into a model may be a
10
good option to manage the complexity of a product line. Product line models improve
11
decision-making processes. In addition, the representation of PLMs in different views
12
improves communication of the actors participating in the product line management
13
(Finkelstein et al. 1992). Nuseibeh et al. (1994) describe views as partial representations of a
14
system and its domain.
15
Several approaches have been found in literature to represent commonality and variability
16
of a product line. Most of the approaches use features (Kang et al. 1990) as the central
17
concept of product line models. However, other modelling approaches exist like Orthogonal
18
Variability Models (OVM, cf. Pohl et al. 2005), Dopler variability models (Dhungana et al.
19
2010), Textual Variability Language (TVL, cf. Boucher et al. 2010 and Classen et al. 2010),
20
and constraint-based product line language (Djebbi et al. 2007, Mazo et al. 2011e; Salinesi et
21
al. 2010b; 2011).
22
Quality assurance of PLMs has recently been a prominent topic for researchers and
23
practitioners in the context of product lines. Identification and correction of PLMs defects, is
24
vital for efficient management and exploitation of the product line. Defects that are not
25
identified or not corrected will inevitably spread to the products created from the product
26
line, which can drastically diminish the benefits of the product line approach (Von der
27
Maßen and Lichter 2004, Benavides 2007). Besides, product line modeling is an error-prone
28
activity. Indeed, a product line specification represents not one, but an undefined collection
29
of products that may even fulfil contradictory requirements (Lauenroth et al. 2010). The
30
aforementioned problems enforce the urgent need of early identification and correction of
31
defects in the context of product lines.
32
Product line models quality has been an intensive research topic over the last ten years (Von
33
der Maßen & Lichter 2004; Zhang et al. 2004; Batory 2005; Czarnecki & Pietroszek 2006;
34
Benavides 2007; Janota & Kiniry 2007; Lauenroth & Pohl 2007; Trinidad et al. 2008; Van den
35
Broek & Galvão 2009; Elfaki et al. 2009; Kim et al. 2011; Liu et al. 2011). Usually, to guaranty a
36
certain level of quality of a model, this one must be verified against a collection of criteria
and then, these defects must be corrected. Verifying PLMs entails finding undesirable
1
properties, such as redundancies, anomalies or inconsistencies (Von der Maßen et al. 2004).
2
It is widely accepted that manual verification is already tedious and error-prone (Benavides
3
et al. 2005). This is even worst when several (often millions) of products are represented
4
altogether in a single specification. Several approaches to automate verification of PLMs
5
have been proposed in order to overcome this limitation. However, despite the relative
6
success of these approaches, there is still a number of pending issues that have motivated
7
the proposal developed in this chapter:
8
1. Quality assurance techniques from the development of single systems cannot be
9
directly applied to product line specifications because these specifications contain
10
variability. As shows the example presented by Lauenroth et al. (2010), a product line
11
may contain requirements R and ¬R at the same time. When a traditional technique is
12
used for verifying this specification, even though those requirements are not included
13
for the same product, a contradiction would be identified since the requirements R and
14
¬R cannot be fulfilled together. Therefore, it is necessary to take into account the
15
variability of the product line to check whether contradictory requirements can really
16
be part of the same product.
17
2. The current state of the art on verification is mainly focused on feature models (Kang et
18
al. 1990). Only properties that can be evaluated over feature models represented as
19
boolean expressions are considered in these works. This brushes aside the non-boolean
20
elements of the more sophisticated product line specification formalisms (e.g., integer
21
cardinalities, attributes and complex constraints; cf. Mazo et al. 2011d, Salinesi et al.
22
2010b, 2011). Current approaches restrict the verification operations to those that can be
23
solved by boolean solvers. The verification is guided by the pre-selected technology and
24
not by the verification requirements themselves. As a result, verification techniques are
25
designed for a limited number of formalisms. These verification techniques are
26
inadequate for many of the existing formalisms, included some used in an industrial
27
context (Djebbi et al. 2007; Dhungana et al. 2010).
28
3. Inadequate support for multi-model specification. The size and complexity of industrial
29
product line models motivates the development of this one by heterogeneous teams
30
(Dhungana et al. 2006; Segura 2008). Nevertheless, existing tools provide only little
31
support for integrating the models developed by different teams and the subsequent
32
verification of the global model and configurations of products from that model. For
33
instance, a global model that integrates two models must itself have no defects resulting
34
from the integration.
35
Also in the context of PLs specified with several models, we have identified in our literature
36
review a weak support for verifying the global view of the product line. A product line
37
model has to change over time and in multi-model PLs a change on one of the models can
38
make the global view inconsistent. To the best of our knowledge, existing tools do not
39
provide automated mechanisms for detecting errors on the global PLM as a result of the
40
changes in the different models of the PLM.
41
This chapter addresses the fourth problem situations aforementioned. To tackle these
42
situations, we present in Section 2 the most relevant concepts used in this chapter, a
43
literature review of related works and the running example to be used in the rest of the
44
chapter. Section 3 presents our typology of verification criteria, which is developed in
Section 4 for the case of single-view product line models, and Section 5 for the case of
multi-1
view product line models. Section 6 presents the evaluation of the approach presented in
2
this chapter.
3
2. Background and running example
4
This section presents a literature review on verification of product line models and the
5
corresponding analysis regarding the gaps and challenges identified in each approach. This
6
section also presents a UNIX product line and the corresponding model of the whole or a
7
part of the PL in three different PL modeling languages. The UNIX PL will be used in the
8
rest of this chapter as our running example.
9
2.1 Verification of product line models
10
Verifying PLMs entails several aspects. On the one hand, a product line model,
11
independently of the language used to express it, must respect certain properties associated
12
with the domain of product lines. On the other hand, certain properties are associated with
13
the concepts used in the language in which it is expressed. Therefore, some properties of
14
PLMs are independent of the language while other ones are particular to each language.
15
Thus, product line models can be verified from two different points of view. This chapter
16
proposes an approach for PLM verification (Von der Maßen & Lichter 2004; Lauenroth &
17
Pohl 2007; Mendonça et al. 2009) in with the engineer selects the verification operations that
18
he/she want to use according to the language in which the model(s) to be verified are
19
specified. In this approach, verification consists in “finding undesirable properties, such as
20
redundant or contradictory information” (Trinidad et al. 2008). For instance, PLMs should
21
not be void (i.e., they should allow to configure more than one product) and for the
22
languages with the concept of optionality, elements modeled as optional must be really
23
optional (i.e., they should not appear in all the products configured from the PLM).
24
2.2 Related work
25
Von der Maßen & Lichter (2004) present an approach to identify redundancies, anomalies
26
and inconsistencies. According to the authors, a feature model contains redundancy, “if at
27
least one semantic information is modeled in a multiple way”; anomalies, “if potential
28
configurations are being lost, though these configurations should be possible”; and
29
inconsistencies, “if the model includes contradictory information”. Several cases of
30
redundancies, anomalies and inconsistencies on FMs are identified. In order to validate the
31
approach, the authors use RequiLine, a tool that allows detecting inconsistencies on the
32
domain and on the product configuration level (Von der Maßen & Lichter 2003). The
33
approach was evaluated in “a small local software company” and “in a global player of the
34
automotive industry”. However no information about the automating detection of
35
redundancies and anomalies, no details about the sizes of the models or about the
36
technology used to automate the approach or about the results obtained were provided.
37
Whereas Batory (2005) used grammar and propositional formulas to represent basic FMs
38
and enable truth maintenance systems and SAT solvers to identify contradictory (or
39
inconsistency) predicates to verify that a given combination of features effectively defines a
40
product. In the same line as Batory, Hemakumar (2008) proposed a dynamic solution to find
contradictions, “where errors can be detected during usage and silently reported to model
1
designers”. The author proposes an incremental consistency algorithm that incrementally
2
verifies some contradiction properties. The approach consists in verify that a model is
3
contradiction-free if it is k-contradiction free for all k where 0<k≤n (A feature model is
k-4
contradiction free if every selection of k features does not expose a contradiction, for
5
example: “unconditionally” dead features are exposed when k=1). When k=n, where n is the
6
number of user selectable features, the model has been proven to be contradiction free.
7
However, the incremental consistency algorithm has important practical limits because it is
8
limited to “verify contradiction freedom of models with about 20 or fewer features”.
9
In (Benavides et al. 2005a; 2005b; 2006; 2007; Trinidad et al. 2008), authors transform FODA
10
models with and without attributes into Boolean expressions. These expressions are
11
executed on Constraint Satisfaction Problem (CSP), Satisfiability (SAT) and Binary Decision
12
Diagrams (BDD) solvers in order to execute analysis and verification operations over feature
13
models. In (Benavides et al. 2006) the relationships of the FM are represented as ifThenElse
14
constrains on CPS. Despite the originality of this proposal, the constraint representing a
15
feature cardinality (m,n) between the father feature A and its child B (according to their
16
notation: ifThenElse(A=0;B=0;B in {n,m})) does not consider that the feature A can itself have
17
a feature cardinality, and in this case the semantic of feature cardinalities is not well
18
represented in the constraint. Authors performed a comparative test between two off–the–
19
shelf CSP Java solvers (JaCoP and Choco). The experiment was executed on five FMs with
20
up to 52 features and in both solvers. The time to get one solution seemed to be linear and
21
the time to get all solutions seemed to be exponential.
22
Janota & Kiniry (2007) have formalized in higher-order logic (HOL) a “feature model
meta-23
model” that integrates properties of several feature modeling approaches such as attributes
24
and cardinalities. Once the model represented in HOL, author have formulated HOL
25
expressions for root selectivity, existence of a path of selected features from the root to a
26
feature that has been selected, and cardinality satisfaction of a selected feature that each
27
feature model must respect. The approach has been implemented in Mobius program
28
verification environment, an Eclipse-based platform for designing, testing, performing various
29
kinds of verification of Java programs and bytecode. Nevertheless, the paper does not
30
provide evidence about the evaluation of the approach, its scalability and its applicability to
31
real cases.
32
Trinidad et al. (2008) mapped FMs into CSP in order to find and diagnose three types of
33
errors: (i) “dead features” are non-selectable features (features that do not appear in any
34
product); (ii) “false optional features”, which are features that in spite of being modeled as
35
optional, are always chosen whenever their parents are chosen; and (iii) “void models”;a
36
feature model is said to be void if no product can be defined from it. The goal of Trinidad et
37
al. is to detect the above three errors and provide explanations for the cause of these errors.
38
In order to achieve the first goal, authors transform the FM into a CSP expression and then,
39
to query the Choco solver (by means of the FaMa tool) to find the errors. The approach has
40
been evaluated on five FMs up to 86 features. Unfortunately, no details about the scalability
41
and the efficiency of the approach and tool are provided.
42
Van der Storm (2007) transformed feature diagrams into BDDs in order to check
43
configurations, obtain valid configurations and check consistency of the feature diagram.
Checking the consistency of the feature diagram consists in checking the satisfiability for the
1
BDD logical formulas. Unfortunately, neither details about implementation nor performance
2
nor scalability of the approach are provided in the paper.
3
Yan et al. (2009) proposed an approach that consists in eliminating verification-irrelevant
4
features and constraints from FMs in order to reduce the problem size of verification, and
5
alleviate the state-space explosion problem. The authors carried out an experiment in which
6
they generated FMs with up to 1900 features. The authors verified the consistency of models
7
and showed that verification is faster when the redundant features had been eliminated. The
8
problem with this approach is that it only considers as redundant, the constraints that
9
contain redundant features, whereas it does not consider typical redundancies such as
10
domain overlapping or cyclic relationships (Salinesi et al. 2010; Mazo et al. 2011). Besides, (i)
11
the validation of the approach was done with in-house and random build features models,
12
which does not guaranty that the approach works with real world feature models; and (ii)
13
the details about the formalisation and implementation of the approach are not revealed.
14
Van den Broek & Galvão (2009) analyze FODA product line models using generalized
15
feature trees. In their approach they translate FMs into feature trees plus additional
16
constraints. Once FMs represented in the functional programming language Miranda, they
17
detect the existence of products (void models), dead features and minimal set of conflicting
18
constraints. In FMs with cross-tree constraints, the function to find the number of products
19
belongs to O(N*2M), where N is the number of features and M is the number of cross-tree
20
constraints. Unfortunatelly, no evaluation of the theoretical calculations of efficiency is
21
reported in the paper. The approach was validated with a feature tree of 13 features and two
22
cross-tree constraints, which is not enough to evaluate the scalability and the usability of the
23
approach on industrial models.
24
Elfaki et al. (2009) propose to use FOL to detect dead features and inconsistencies due to
25
contradictions between include-type and exclude-type relationships in FMs. The innovative
26
point of their work is the suggestion of expressions dealing with both individuals and sets of
27
features.
28
SPLOT (Mendonca et al. 2009b) is a Web-based reasoning and configuration system for
29
feature models supporting group-cardinalities instead of alternative and or-relations. The
30
system maps feature models into propositional logic formulas and uses boolean-based
31
techniques such as BDD and SAT solvers to verify the validity of models (not void) and find
32
dead features.
33
2.3 Running example
34
The example taken in this chapter is that of the UNIX operating system, initially presented
35
in (Mazo et al. 2011d). UNIX was first developed in the 1960s, and has been under constant
36
development ever since. As other operating systems, it is a suite of programs that makes
37
computers work. In particular, UNIX is a stable, multi-user and multi-tasking system for
38
many different types of computing devices such as servers, desktops, laptops, down to
39
embedded calculators, routers, or even mobile phones. There are many different versions of
40
UNIX, although they share common similarities. The most popular varieties of UNIX are
41
Sun Solaris, Berkeley (BSD), GNU/Linux, and MacOS X.
The UNIX operating system is made up of three parts: the kernel, the shell and the
1
programs; and two constituent elements: files and processes. Thus, these three parts consist
2
in a collection of files and processes allowing interaction among the parts. The kernel of
3
UNIX is the hub of the operating system: it allocates time and memory to programs and
4
handles the file-store and communications in response to system calls. The shell acts as an
5
interface between the user and the kernel, interprets the commands (programs) typed in by
6
users and arranges for them to be carried out. As an illustration of the way the shell, the
7
programs and the kernel work together, suppose a user types rm myfile (which has the effect
8
of removing the file myfile). The shell searches the file-store for the file containing the
9
program rm, and then requests the kernel, through system calls, to execute the program rm
10
on myfile. The process rm removes myfile using a specific system-call. When the process rm
11
myfile has finished running, the shell gives the user the possibility to execute further
12
commands.
13
As for any product line, our example emphasizes the common and variable elements of the
14
UNIX family and the constraints among these elements. This example is built from our
15
experience with UNIX operating systems and it does not pretend to be exhaustive, neither
16
on the constituent elements nor on the constraints among these elements. The idea with this
17
PL is, for instance, to look at what utility programs or what kinds of interfaces are available
18
for a particular user. This PL is composed of the following six constraints:
19
Constraint 1. UNIX can be installed or not and the installation can be from a CDROM, a
20
USB device or from the NET.
21
Constraint 2. UNIX provides several hundred UTILITY PROGRAMS for each user. The
22
collection of UTILITY PROGRAMS varies even when the UNIX product is
full-23
configured.
24
Constraint 3. The SHELL is a kind of UTILITY PROGRAM. Different USERS may use
25
different SHELLS. Initially, each USER has a default shell, which can be overridden or
26
changed by users. Some common SHELLS are:
27
Bourne shell (SH)
28
TC Shell (TCSH)
29
Bourne Again Shell (BASH)
30
For the sake of simplicity will consider only two users in this running example:
31
ROOT_USER and GUEST_USER.
32
Constraint 4. Some functions accomplished by the UTILITY PROGRAMS are:
33
EDITING (mandatory and requires USER INTERFACE)
34
FILE MAINTENANCE (mandatory and requires USER INTERFACE)
35
PROGRAMMING SUPPORT (optional and requires USER INTERFACE)
36
ONLINE INFO (optional and requires USER INTERFACE)
37
Constraint 5. The USER INTERFACE can be GRAPHICAL and/or TEXTUAL.
38
Constraint 6. The GRAPHICAL interface is characterized by a WIDTH RESOLUTION
39
and a HEIGHT RESOLUTION that can have the following couples of values [800,600],
40
[1024,768] and [1366,768].
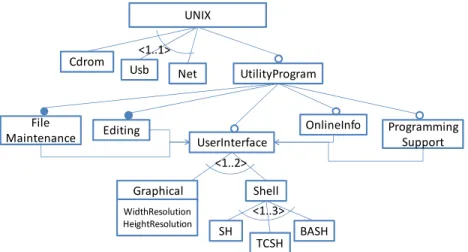
2.3.1 Representation of the UNIX product line as a feature model
1
Feature Models (FMs) were first introduced in 1990 as a part of the Feature-Oriented Domain
2
Analysis (FODA) method (Kang et al. 2002) as a means to represent the commonalities and
3
variabilities of PLs. Since then, feature modeling has become a de facto standard adopted by
4
the software product line community and several extensions have been proposed to
5
improve and enrich their expressiveness. A FM defines the valid combinations of features in
6
a PL, and is depicted as a graph-like structure in which nodes represent features, and edges
7
the relationships between them (Kang et al. 2002). Two of these extensions are cardinalities
8
(Riebisch et al. 2002; Czarnecki et al. 2005) and attributes (Streitferdt et al. 2003; White et al.
9
2009). Although there is no consensus on a notation to define attributes, most proposals
10
agree that an attribute is a variable with a name, a domain and a value. Attributes are
11
integers, enumerations, and boolean values representing important properties of a feature;
12
as for instance the price, the cost, the width, the height or the time spent to build the
13
corresponding feature. In this chapter we use the group cardinalities grouping bundles of
14
features (cf. Cdrom, Usb and Net in Figure 1). We use the semantic of feature models
15
proposed by (Schobbens et al. 2007).
16
The elements of the FM notation used in this chapter are presented and exemplified as
17
follows:
18
Feature: A feature is a prominent or distinctive user-visible aspect, quality, or
19
characteristic of a software system (Kang et al. 1990). For the sake of simplicity FMs
20
usually comport only the name of the feature; for instance Editing in Figure 1. Every
21
FM must have one root, which is called root feature and identifies the product line; for
22
example UNIX in Figure 1.
23
Attribute: Although there is no consensus on a notation to define attributes, most
24
proposals agree that an attribute is a variable with a name (Name), a domain (Domain),
25
and a value (consistent with the domain) at a given configuration time. From a technical
26
point of view an attribute must to be differentiated from the other ones by an identifier
27
(IdAttribute). For instance in Figure 1, WidthResolution and HeightResolution are two
28
attributes with a domain determined by the constraint at the bottom of the model.
29
Mandatory: Given two features F1 and F2, F1 father of F2, a mandatory relationship
30
between F1 and F2 means that if the F1 is selected, then F2 must be selected too and vice
31
versa. For instance in Figure 1, features UtilityProgram and Editing are related by a
32
mandatory relationship.
33
Optional: Given two features F1 and F2, F1 father of F2, an optional relationship
34
between F1 and F2 means that if F1 is selected then F2 can be selected or not. However,
35
if F2 is selected, then F1 must also be selected. For instance in Figure 1, features UNIX
36
and UtilityProgram are related by an optional relationship.
37
Requires: Given two features F1 and F2, F1 requires F2 means that if F1 is selected in
38
product, then F2 has to be selected too. Additionally, it means that F2 can be selected
39
even when F1 is not. For instance, Editing requires UserInterface (cf. Figure 1).
40
Exclusion: Given two features F1 and F2, F1 excludes F2 means that if F1 is selected then
41
F2 cannot to be selected in the same product. This relationship is bi-directional: if F2 is
42
selected, then F1 cannot to be selected in the same product.
43
Group cardinality: A group cardinality is an interval denoted <n..m>, with n as lower
44
bound and m as upper bound limiting the number of child features that can be part of a
product when its parent feature is selected. If one of the child features is selected, then
1
the father feature must be selected too. For instance in Figure 1, Cdrom, Usb and Net are
2
related in a <1..1> group cardinality.
3
Cdrom UserInterface Editing UNIX Shell SHUsb Net UtilityProgram
<1..1> BASH TCSH File Maintenance Programming Support OnlineInfo <1..3> <1..2> Graphical
Graphical→ relation([WidthResolution, HeightResolution], {[800, 600], [1024,768], [1366,768]})
WidthResolution HeightResolution
4
Fig. 1. User model of the UNIX operating system family of our running example
5
Figure 1 corresponds to the feature representation of the user model of our running
6
example. In this model, a user has the possibility to install a UNIX system using one of the
7
following options: a CD ROM, an USB devise or a network. In addition, users have the
8
possibility to install or not utility programs for file maintenance, edition, online access, and
9
user interface. The user interface may be graphical or command-line (Shell) based; there are
10
three options of command-line interface: SH, TCSH and BASH. The utility programs for
11
user interface, online information and programming support are optional features.
12
2.3.2 Representation of the UNIX product line as a dopler variability model
13
The Decision-oriented (Dopler) variability modeling language focuses on product derivation
14
and aims at supporting users configuring products. In Dopler variability models (Dhungana
15
et al. 2010a; 2010b), the product line’s problem space is defined using decision models whereas
16
the solution space is specified using asset models. An example of Dopler model is presented
17
in Figure 2. This figure depicts the installation of a UNIX operating system (decision model)
18
and the associated packages (asset model) that can be selected if the UNIX system is
19
installed with a graphical interface. The decision model is composed of four decisions. The
20
first one proposes one of three ways to install a UNIX operating system (with a CD ROM,
21
with a USB or with the Net). The solution of this decision implies the solution of a second
22
decision in which the user must select the utility programs to be installed in the particular
23
UNIX system; in that regard, five utility programs are proposed: one tool for editing, one for
24
file maintenance, one for programming, one for online information access and one shell. If
25
the choice contains the utility program for online information, the user must decide what
26
kind of graphical resolution will be configured and several choices are proposed: 800x600,
1024x768, 1366x768. Depending of each selection, the values of the variables corresponding
1
to the width and height resolution will be assigned automatically by means of several
2
decision effects; for instance in Figure 2: if(GraphicalResolution==800x600) then Width=800. To
3
finish, the assignation of the width and height resolution must respect a certain number of
4
validity conditions like for instance: Width ≥ 800 and Width ≤ 1366. The asset model is
5
composed of seven graphical user interfaces and libraries that can be used in a UNIX
6
graphical interface. The Tab Window Manager asset is available for all UNIX implementations
7
with a graphical interface and requires the asset Motif; the others assets are optional. The
8
IRIS 4d window manager is based on Mwm and Motif and therefore requires all of them in
9
order to work in the same way as the KDE asset requires the Qt widget toolkit to work.
10
11
Fig. 2. Example of Dopler Model: Installation of a UNIX System
12
A decision model consists of a set of decisions (e.g., Which utility programs? with two
13
attributes: name and expected values) and dependencies among them (i.e., the Visibility
14
condition isTaken(Means of installation) forcing the answer of the decision Utility program if
15
the decision Means of installation is taken). Assets allow defining an abstract view of the
16
solution space to the degree of details needed for subsequent product derivation. In a
17
domain-specific metamodel attributes and dependencies can be defined for the different
18
types of assets. Decisions and assets are linked with inclusion conditions defining
19
traceability from the solution space to the problem space (e.g., the asset Tab Window Manager
20
must be included in the solution space if the option OnlineInfo of the decision Utility program
21
is selected in a particular configuration). In our integration approach, these inclusion
22
conditions are constraints that will be added to the collection of constraints representing the
23
decision and asset model. Once these constraints are added, both viewpoints of the PL are
24
integrated, and the model is ready to be verified against the typology of verification criteria
25
presented in this chapter.
2.3.3 Representation of the UNIX product line as a constraint program
1
Constraint Programming (CP) emerged in the 1990’s as a successful paradigm to tackle
2
complex combinatorial problems in a declarative manner (Van Hentenryck 1989). CP
3
extends programming languages with the ability to deal with logical variables of different
4
domains (e.g. integers, reals or booleans) and specific declarative relations between these
5
variables called constraints. These constraints are solved by specialized algorithms, adapted
6
to their specific domains and therefore much more efficient than generic logic-based
7
engines. A constraint is a logical relationship among several variables, each one taking a
8
value in a given domain of possible values. A constraint thus restricts the possible values
9
that variables can take.
10
In modern Constraint Programming languages (Diaz & Codognet 2001; Schulte & Stuckey
11
2008), many different types of constraints exist and are used to represent real-life problems:
12
arithmetic constraints such as X + Y < Z, symbolic constraints like atmost(N,[X1,X2,X3],V)
13
which means that at most N variables among [X1,X2,X3] can take the value V, global
14
constraints like alldifferent(X1,X2,…,Xn)meaning that all variables should have different
15
values, and reified constraints that allow the user to reason about the truth-value of a
16
constraint. Solving constraints consists in first reducing the variable domains by
17
propagation techniques that will eliminate inconsistent value within domains and then
18
finding values for each constrained variable in a labeling phase, that is, iteratively
19
grounding variables (fixing a value for a variable) and propagating its effect onto other
20
variable domains (by applying again the same propagation-based techniques). The labeling
21
phase can be improved by using heuristics concerning the order in which variables are
22
considered as well as the order in which values are tried in the variable domains. Consult
23
(Schulte & Stuckey 2008) for more details. Mazo et al. (2011e) present a constraint system to
24
represent product line models by means of abstract constraints where the domain is an
25
argument of the system.
26
Our running example can also be represented as a constraint program according to the
27
method proposed by Salinesi et al. (2010; 2011) and Mazo et al. (2011d). The resulting model
28
is presented in the following table, where the first column corresponds to each constraint of
29
our example and the second column its representation as a constraint program.
30
31
Constraint CP Representation
C. 1 UNIX ≤ Cdrom + Usb + Net ≤ UNIX C. 2 UtilityProgram ≤ UNIX
C. 3 Shell = UtilityProgram ˄
Shell ((1 * ROOT_USER ≤ ROOT_USERSH + ROOT_USERTCSH + ROOT_USERBASH ≤ 3 * ROOT_USER) ˄ (1 * GUEST_USER ≤ GUEST_USERSH + GUEST_USERTCSH + GUEST_USERBASH ≤ 3 * GUEST_USER)) C. 4 Editing = UtilityProgram ˄ Editing UserInterface ˄ FileMaintenance = UtilityProgram ˄ FileMaintenance UserInterface ˄ ProgrammingSupport ≤ UtilityProgram ˄ ProgrammingSupport UserInterface ˄
Constraint CP Representation
OnlineInfo ≤ UtilityProgram ˄ OnlineInfo UserInterface ˄ UserInterface ≤ UtilityProgram
C. 5 1 * UserInterface ≤ Graphical + Textual ≤ 2 * UserInterface
C. 6 Graphical = 1 (WidthResolution = W1 ˄ HeightResolution = H1) ˄ Graphical = 0 (WidthResolution = 0 ˄ HeightResolution = 0) ˄ relation([W1, H1], [[800, 600], [1024, 768], [1366, 768]])
Table 1. UNIX PL represented as a constraint program
1
3. Typology of verification criteria
2
Verifying PLMs entails several aspects. On the one hand, a product line model,
3
independently of the language used to express it, must respect certain properties associated
4
with the domain of product lines. On the other hand, certain properties are associated with
5
the fact that each PLM respects the syntactic rules of the language in which it is expressed.
6
Therefore, some properties of PLMs are independent of the language while other ones are
7
particular to each language. In light of this observation, this chapter proposes a typology of
8
PLM verification criteria adapted from the initial version presented in (Salinesi et al. 2010a).
9
The typology presented in Figure 1 is structure in two levels; the top level represents the
10
three categories of verification criteria and the bottom level represents the corresponding
11
operations of the two criteria with more than one operation. This figure indicates that not all
12
PLM verification criteria are equivalent: some are a result of the specification of the PL with
13
a metamodel, whereas others can be used to verify PL specifications independent of the
14
formalism used when they were specified. Besides, some criteria help verifying the ability of
15
PLM to generate all the desired products and only them, whereas others are interested in the
16
quality of PLMs, independently of their semantics (i.e., the collection of all possible products
17
that can be generated from it). This is for example the case with the respect of certain rules
18
providing formality (i.e., absence of ambiguity) at the PLM.
19
20
Fig. 3. Typology of verification criteria on PLMs
21
The outcomes of the typology are multiple:
22
2. Error-free criteria Verification criteria
1. Expressiveness
criteria 3. Redundancy-free criteria
Non-void Non-false Non-attainable domains Dead reusable elements False optional reusable elements
a. the typology classify the criteria semantic, allowing the identification of similarities and
1
differences among the criteria;
2
b. the typology makes easier to identify some defects for which no verification criterion is
3
available in the literature. Redundancy of relationships among reusable elements is an
4
example of defect for which no verification criterion has been defined in the literature
5
(at least to our knowledge).
6
c. the classification behind the typology makes it easier the proposition of a standard and
7
reusable approach to verify the domain-specific criteria of PLMs; and
8
d. the typology can be used to select the criteria that one wants to use to verify a PLM
9
according to the impact that these criteria have or the expected level of quality of a
10
particular PLM.
11
The following sections use the typology of verification criteria presented in Figure 3 to
12
develop the verification approach proposed in this chapter.
13
4. Single-model verification
14
In order to verify models against the verification criteria identified and calcified in the
15
former section, it is necessary to represent PLMs in a way that is (a) expressiveness-enough
16
to represent the semantics (i.e. the collection of products that can be configured from the
17
PLM) of PLMs, (b) consistent with the formalization of the criteria, and (c) easy to parse
18
with analysis tools. Experience shows that the semantic of every PLM can be represented as
19
a collection of variables over different domains and constrains among these variables. While
20
the variables specify what can vary from a configuration to another one, constraints express
21
under the form of restrictions what combinations of values are allowed in the products.
22
This section will show how to represent the semantic of PLMs with a constraint based
23
approach, and to verify each and every criterion shown in the typology of the former section
24
on a PLM. The approach will be applied to our feature model example to show how to
25
navigate between the generic specifications of the criteria. The genericity of the approach
26
will be shown by providing examples with other formalisms (cf. Section 5).
27
Verifying PLMs is about looking for undesirable properties such as redundant or
28
contradictory information. This chapter proposes three domain-specific verification criteria:
29
expressiveness, error-free and redundancy-free. Each domain-specific verification criterion
30
is defined, formalized and exemplified with our running example (cf. Figure 1 and Table 1)
31
as follows.
32
2.1. Expressiveness: every PLM must allow configuring more than one product, i.e., the
33
model must be not void and the model must be expressive enough to allow configure
34
more than one product (Benavides et al. 2005). In case the PLM allows configuring only
35
one product, the PLM, even if it is not considered as a void model, is not expressive
36
enough to be a PLM. Indeed, the purpose of PLMs is to represent at least two products
37
–or there is not reuse. Two verification operations can be used to implement this
38
criterion:
39
a. Non-void PLMs. This operation takes a PLM as input and returns “Void PLM” if the
40
PLM does not define any products. Two alternative techniques have been proposed so
41
far to implement this operation: calculate the number of products (Van den Broek &
Galvão 2009) or ask for a product configuration that meets the constraints of a FM
1
(Benavides et al. 2005; Trinidad et al. 2008). Our proposal follows along the lines of the
2
latter alternative and is formalized in the following algorithm. It consists in determining
3
if there is at least one product that can be generated by means of a query to an
off-the-4
shelf solver. If the PLM is not void, the solver will return one valid product or false
5
otherwise.6
Non-void _PLM(PLM M, Solver S) {7
S.charge(M);8
Answer = S.getOneSolution();9
If (Answer ≠ “false”) {10
Write (Answer);11
}12
Else {13
Write (“Void PLM”);14
}15
}16
The execution of this algorithm over the running example gives as result that our UNIX
17
PL is non-void.
18
b. Non-false PLMs. This operation takes a PLM as input and returns “False PLM” if at
19
most one valid product can be configured with it. Although this operation could also
20
help detect when PLMs are void (our precedent operation), the converse is not true. The
21
two operations have then a separate implementation. Our approach consists in asking
22
the solver to generate two products in order to decide if the PLM is false. The algorithm
23
proposed to automate this operation is as follows:
24
Non-false_PLM(PLM M, Solver S) {25
S.charge(M);26
Answer1 = S.getOneSolution();27
If (Answer1 ≠ “false”) {28
Answer2 = S.getNextSolution();29
If (Answer2 ≠ “false”) {30
Write (Answer1, Answer2);
31
}32
Else {33
Write (“False PLM”);34
}35
}36
Else {37
Write (“False PLM”);38
}39
}40
The execution of this algorithm over the running example gives as result that our UNIX
41
PL is a non-false PLM.
42
2.2. Error-free. The Dictionary of Computing defines an error as “A discrepancy between
43
a computed, observed, or measured value or condition, and the true, specified, or
44
theoretically correct value or condition” (Howe 2010). In PLMs, an error represents a
discrepancy between what the engineer want to represent and the result obtained
1
from the model. For instance, this is the case when the engineer includes a new
2
reusable element (in a given domain) in a PLM, but this element never appears in a
3
product. The error-free criterion can be verified by means of three operations: the first
4
one allows identifying the non-attainable domain values of PLM’s reusable elements;
5
the second one allows identifying the dead elements, i.e. elements of the PL that are
6
never used in a product; the third one allows identifying the reusable elements
7
modeled as optional but that appear in all the products of the PL. These operations
8
are presented as follows:
9
c. Non-attainable domains: This operation takes a PLM and a collection of reusable
10
elements as input (all of them by default) and returns the reusable elements that cannot
11
attain one of the values of their domain. Reusable elements can have domains
12
represented as particular values (e.g., 800), intervals of values (e.g., [0..5]), or collections
13
of values (e.g., {0, 800, 1024, 1280}). A non-attainable value of a domain is the value of
14
an element that never appears in any product of the product line. For example, if a
15
reusable element R has the domain [0..1], value 1 is non-attainable if R can never be
16
integrated in a product line it never take the value of 1. Non-attainable values are
17
clearly undesired since they give the user a wrong idea about domain of reusable
18
elements. The approach presented in this chapter can assess the attainability of any
19
reusable elements for all (or parts of) their domain values. This operation was also
20
implemented by Trinidad et al. (2008), but only for boolean domains on FMs. Our
21
proposal goes a step further by offering an algorithm for any domain as e.g. needed
22
when using attributes or features whit individual cardinality.
23
Our algorithm to automate this operation evaluates the domain of each variables of the
24
PLM. For each vale of the domain, the algorithm requests the solver at hand for a
25
solution. If the solver gives a solution for all the values of the variable’s domain, the
26
variable is erased from the list of reusable elements with non-attainable domains.
27
Otherwise, the variable, representing a reusable element, is affected with the
non-28
attainable value(s) and kept in the list of reusable elements with non-attainable
29
domains. In each product obtained from the solver, all the variables of the PLM are
30
affected with a particular value of the corresponding domain. Thus, this algorithm takes
31
advantage of that fact and records the answers given by the solver in order to avoid
32
achieving useless requests testing the attainability of domain values that have already
33
been obtained in precedent tests. The corresponding algorithm is as follows:
34
NonAttainableDomains(PLM M, Solver S) {
35
S.charge(M);
36
For (each variable V ∈ M) {
37
For(each Di ∈ domain of V AND not in {PrecedentProducts}){
38
Product = S.getOneSolution(“V = Di”);
39
If (Product = “false”) {
40
Write (“The domain ” + Di + “ of ” + V + “ is
non-41
attainable”);42
}43
Else {44
PrecedentProducts += Product;45
}46
}
1
}2
}3
For instance in our running example, if when asking for a product with
4
WidthResolution=800 we get a product
5
P1 = [UNIX=1, Cdrom=1, Usb=0, Net=0, UtilityProgram=1, FileMaintenance=1, Editing=1,
6
UserInterface=1, Graphical=1, WidthResolution=800, HeightResolution=600, Shell=1, SH=1,
7
TCSH=1, BASH=0, OnlineInfor=0, ProgrammingSupport=0].
8
This means both that WidthResolution can attain the value of 800, and that the rest of
9
variables can attain the values assigned by the solver. Thus, for instance, it is not
10
necessary to ask if the variable UNIX can attain the value of 1 or if HeightResolution can
11
attain the value of 600.
12
d. Dead-free reusable elements: A reusable element is dead if it cannot appear in any
13
product of the product line. This operation takes as input a PLM and a collection of
14
reusable elements, and it returns the set of dead reusable elements, or false if there is
15
none in the input list. Reusable elements can be dead because: (i) they are excluded by
16
an element that appears in all products (also known as full-mandatory or core reusable
17
elements, c.f. Von der Maßen & Lichter 2004; Benavides et al. 2005; Trinidad et al. 2008;
18
Van den Broek & Galvão 2009); and (ii) they are wrongly constrained (e.g., an attribute
19
of the feature is > 5 and < 3 at the same time, or a group cardinality is wrong defined).
20
Elfaki et al. (2009) detect dead features by searching only for predefined cases, i.e.
21
defined dead features in the domain-engineering process. Trinidad et al. (2006, 2008)
22
detect dead features by finding all products and then searching for unused features.
23
Van den Broek and Galvão (2009) detect dead features by transforming the FM into a
24
generalized feature tree, and then searching the feature occurrences that cannot be true.
25
To the better of our knowledge there is not details in literature about the way in which
26
the other references have implemented this operation. Our approach evaluates each
27
non-zero value of each reusable element’s domain, and reuses each solution obtained
28
from the solver in order to avoid useless computations. If a reusable element cannot
29
attain any of its non-zero values, then the reusable element is dead. The reuse of the
30
solutions previously obtained makes our dead artefacts detection technique scalable as
31
showed below, by contrasts to the state of the art. The corresponding algorithm is
32
presented as follows:33
DeadReusableElements(PLM M, Solver S) {34
S.charge(M);35
DeadElementsList = all variables of M;
36
For (each variable V ∈ DeadElementsList) {
37
Product = S.getOneSolution(“V > 0”);
38
If (Product = “false”) {
39
Write (“The variable ” + V + “ is dead”);
40
}
41
Else {
42
Erase V and all the other non-zero variables obtained in Product from
43
DeadElementsList;44
}45
}46
}47
Our algorithm first creates a list of the reusable elements whose dead or non-dead
1
condition is yet to be assessed. For example:
2
deadElements=[UNIX, Cdrom, Usb, Net, UtilityProgram, FileMaintenance, Editing,
3
UserInterface, Graphical, WidthResolution, HeightResolution, Shell, SH, TCSH, BASH,
4
OnlineInfor, ProgrammingSupport].
5
Then, our algorithm queries for a configuration based on reusable elements for which
6
we still ignore if they are dead or not, and sieves the selected (and thus alive) elements
7
from this list. For example, to know if UtilityProgram is dead or not, it is sufficient to
8
query the solver for a product with UtilityProgram=1, which provides a product
9
P1 = [UNIX=1, Cdrom=1, Usb=0, Net=0, UtilityProgram=1, FileMaintenance=1, Editing=1,
10
UserInterface=1, Graphical=1, WidthResolution=800, HeightResolution=600, Shell=1, SH=1,
11
TCSH=1, BASH=0, OnlineInfor=0, ProgrammingSupport=0].
12
This means not only that the reusable element UtilityProgram is not dead, but also that
13
the other elements with values different from 0 are not dead. Therefore these elements
14
can be sieved from the list of dead elements. The test can be repeated until all elements
15
are sieved. For example querying for products with Usb =1, the solver provides another
16
product which means that this reusable element is not dead either. According to our
17
algorithm, the variable Usb, and all the other non-zero variables, must be erased from
18
the list of dead elements. At this point the list of dead elements is empty, which means
19
that there are no dead elements in the product line model.
20
The purpose of the aforementioned list is to reduce the number of queries. For instance
21
in this example, only two queries were necessary to evaluate all reusable elements. In
22
contrast, 17 queries would have been required in the current state of the art algorithm.
23
However, it is not possible to calculate in advance how many queries would be needed,
24
or even, to guaranty that the minimal number of queries will be executed, as this
25
depends on the configuration generated by the solver.
26
e. False optional reusable elements: a reusable element is false optional if it is included in
27
all the products of the product line despite being declared optional (Von der Maßen &
28
Lichter 2004; Benavides et al. 2005; Trinidad et al. 2008). This operation takes a PLM and
29
a collection of reusable elements modeled as optional as input, and returns the set of
30
false optional reusable elements, or false if no one exists. Trinidad et al. (2006, 2009)
31
detect false optional features based on finding all products and then searching for
32
common features among those which are not assigned as common. To verify if an
33
optional reusable element is false optional, we query for a product that does not contain
34
the reusable element at hand (setting the feature’s value to 0). If there is no such
35
product, then the reusable element we are evaluating is indeed false optional.
36
FalseOptionalReusableElements(PLM M, Solver S) {
37
S.charge(M);
38
FalseOptionalElementsList = all optional elements of M;
39
For (each variable V ∈ FalseOptionalElementsList) {
40
Product = S.getOneSolution(“V = 0”);
41
If (Product = “false”) {
42
Write (V + “ is false optional”);
43
}
44
Else {
45
Erase V and all the other variables with a Zero affectation into
46
Product, from DeadElementsList;
}
1
}2
}3
For example if we want to know whether the optional reusable component Usb is false
4
optional of not, it is sufficient to request for a product without this component
5
(Support_usb=0). The solver, in this case, returns the product P1 = [UNIX=1, Cdrom=1,
6
Usb=0, Net=0, UtilityProgram=1, FileMaintenance=1, Editing=1, UserInterface=1,
7
Graphical=1, WidthResolution=800, HeightResolution=600, Shell=1, SH=1, TCSH=1,
8
BASH=0, OnlineInfor=0, ProgrammingSupport=0], which means that this optional
9
reusable element can take the value of 0, it is, be effectively optional.
10
2.3. Redundancy-free: according to the Oxford dictionary something redundant is
11
something “able to be omitted without loss of meaning or function” (Oxford University
12
2008). Therefore, redundancy in a PLM is about the presence of reusable elements and
13
variability constraints among them that can be omitted from the PLM without loss of
14
semantic on the PLM. Redundant constraints in FMs are undesired because, although
15
they do not alter the space of solutions, they may consume extra computational effort in
16
derivation and analysis operations (Yan et al. 2009), and they are likely to generate
17
inconsistencies when the PL evolves. For the sake of evolution, it is certainly better
18
detect and correct these redundancies. In order to detect them in a PLM this chapter
19
proposes an operation that takes a PLM and a constraint as input and returns true if
20
removing the constraint does not change the space of solutions.
21
Three alternatives can be implemented to check if a relationship is redundant or not.
22
The naïve algorithm consists in calculating all the products of the PLM with the
23
constraint to check; then, remove the constraint; and calculate all the solutions of the
24
new model. If both results are equal (i.e. exact the same products can be configured
25
with and without the constraint), then the constraint is redundant. This approach is
26
computationally very expensive as it requires (a) to compute all configurations twice
27
and (b) to perform an intersection operation between two potentially very large sets
28
(e.g. 1021 configurations for the Renault PLM according to Dauron & Astesana (2010)).
29
Not only this algorithm is not scalable, it is typically unfeasible. The second algorithm,
30
proposed by Yan et al. (2009) defines a redundant constraint of a PLM as a constraint in
31
which a redundant reusable element takes part. This approach consists in calculating
32
the redundant reusable elements on feature models — features disconnected from the
33
FM — and then the redundant constraint in this approach are those in which the
34
redundant features take part. Though it yields a solution, this algorithm is not
35
sufficiently general: indeed, only these trivial cases of redundancy are considered. The
36
approach proposed in this chapter is based on the fact that if a system is consistent, then
37
the system plus a redundant constraint is consistent too. Therefore, negating the
38
allegedly redundant relation implies contradicting the consistency of the system and
39
thus rendering it inconsistent (Mazo et al. 2011a). This approach is more efficient, and
40
thus more scalable, when applied on large models. Our algorithm is in two steps: first,
41
it tries to obtain a solution with the set of constraints. Then, if a solution exists, we
42
negate the constraint we want to check. In the case where no solution is found, the
43
inspected constraint turns out to be redundant. This alternative to find redundant
44
constraints can be formalized as follows:
If (at least 1 product can be configured from PLM M under a collection of constraints C
1
= {C1,...,Ci}) {2
Write (C |= M);3
Let take Cr ∈ C a constraint to be evaluated;
4
If (C without Cr |= M AND C ∪ ¬Cr |≠ M) {5
Write (Cr is redundant);6
}7
Else{8
Write (Cr is not redundant);
9
}
10
}
11
For example, to check if the constraint UNIX ≥ UtilityProgram (cf. Table 1) is redundant
12
or not, it is sufficient to query the solver for a product. Then, if a product is found, the
13
algorithm proceeds to replace the constraint by its negation (UNIX < UtilityProgram)
14
and ask again for a product. If the solver does not give a solution (as is the case for our
15
running example), one can infer that the constraint (UNIX ≥ UtilityProgram) is not
16
redundant.
17
5. Multi-model verification
18
Multi-model modeling allows tackling various models and aspects of a system, in particular
19
in the presence of stakeholders with multiple viewpoints (executives, developers,
20
distributors, marketing, architects, testers, etc.; cf. Nuseibeh et al. 1994). For example, a
21
UNIX product line can be composed of several models, each one developed by a different
22
team or developing a particular view of the PL. Thus, while the team responsible of the
23
kernel develops a model, the team responsible of the user interface develops another model.
24
Motivated by the fact that (a) this practice is current in industry (Dhungana et al. 2010); (b)
25
even if each individual model is consistent, once the models are integrated, they can easily
26
be inconsistent; and (c) the lacks in current state of the art in multi-model PL verification,
27
this chapter proposes a method to verify multi-model PLs. This method is composed of
28
fourth steps: (i) the base models’ semantic should be transformed into constraint programs;
29
(ii) once these base models transformed into CP, they may be integrate using the integration
30
strategies and rules appropriates for each language (cf. Mazo et al. 2011a for further details
31
about integration of Dopler models, and Mazo et al. 2011d for further details about
32
integration of constraint-based PLMs; and (iii) once the base models integrated, the
33
collection of verification criteria, proposed in Section 4 for single models, can be applied on
34
the integrated model in the same manner as for single models.
35
The application of these verification criteria over the Dopler model depicted in Figure 2 and
36
the explanation regarding the minor variants are presented as follows:
37
1. Non-void model. This model is not a void because it allows configure at least one
38
product; for instance C1 = {USB, Editing, ProgrammingSupport, Shell}
39
2. Non-false model. This model is not a false because it allows configure more than two
40
products; for instance: C2 = {Cdrom, Editing, OnlineInfo, Shell, Twm, KDE, Qt,
41
GraphicalResolution = “800x600”, Width = 800} and C3 = {USB, Editing}.
42
3. Non-attainable validity conditions’ and domains’ values. This operation either (i)
43
takes a collection of decisions as input and returns the decisions that cannot attain