HAL Id: hal-01965611
https://hal.archives-ouvertes.fr/hal-01965611
Submitted on 26 Dec 2018HAL is a multi-disciplinary open access
archive for the deposit and dissemination of sci-entific research documents, whether they are pub-lished or not. The documents may come from teaching and research institutions in France or abroad, or from public or private research centers.
L’archive ouverte pluridisciplinaire HAL, est destinée au dépôt et à la diffusion de documents scientifiques de niveau recherche, publiés ou non, émanant des établissements d’enseignement et de recherche français ou étrangers, des laboratoires publics ou privés.
Probabilistic Risk Assessment
Michael Thomas, Jace Carter, Lloyd Matson, Tarun Goswami
To cite this version:
Michael Thomas, Jace Carter, Lloyd Matson, Tarun Goswami. Feature-Based Discretization of a Turbine Disk for Probabilistic Risk Assessment. Mechanics, Materials Science & Engineering Journal, Magnolithe, 2018, 14, �10.2412/mmse.21.86.70�. �hal-01965611�
Feature-Based Discretization of a Turbine Disk for Probabilistic Risk
Assessment
Michael A. Thomas1, Jace Carter1, Lloyd Matson1, Tarun Goswami1
1 – Damage Tolerance and Probabilistic Lifing of Materials Center, Wright State University, Dayton, USA
DOI 10.2412/mmse.21.86.70 provided by Seo4U.link
Keywords: discretization, turbine disk, probabilistic risk assessment, principal stress, mathematical model.
ABSTRACT. There is an economic need to extend the useful life of jet engine rotors. Retirement-for-Cause (RFC) is a
lifing method that allows for the continued operation of components passed traditional life limits. Under RFC, an extension of damage tolerance, components are deemed safe for a further service interval using non-destructive inspections (NDI) for crack like defe cts. As components are kept in-service beyond their designed service life it is essential that the probability of failure (POF), or risk, of continued service is known. Under current FAA rotor design certification practices the component POF is analyzed using a probabilistic framework focused on only the life limiting crack location. This method generates conservative approximations of the operational risk, also known as a relative risk. The proposed method for a feature-based discretization allows for a transition from the relative risk towards an absolute risk. The general guidelines, for the discretization, have been established through performance of probabilistic assessments of a representative turbine disk. The discretization is performed by initially separating the representative turbine disk into various features. These features are then discretized through the introduction of defect locations in response to the stress gradient topology. Once the discretization of the disk is completed, a fracture mechanics-based probabilistic assessment is performed utilizing DARWIN®. DARWIN® is a fracture mechanics based probabilistic assessment software package developed by Southwest Research Institute, SwRI®. The POF of the features are obtained through the statistical combination of the defect location POFs. The representative turbine disk POF is likewise obtained by the statistical combination of the feature POFs. The probabilistic assessment results for the two methods, the life limiting and discretization, are compared for the representative turbine disk.
Introduction. With an aging aircraft fleet there is an economic benefit to safely extending the useful life of aircraft engine components beyond the low-cycle-fatigue limit. However, the extension of component life causes an increase in the component probability-of-failure (POF) hence the risk of continued service must be quantified [1]. Historically, safe life methods are utilized to establish the operating limits for turbine engine components. Safe life methods establish a low cycle fatigue, LCF, operating life which certifies that only 1 in 1,000 disks develop a life-limiting crack [2, 14]. However, this method came into question after the uncontained engine failure which led to the deadly crash in Sioux City, Iowa of 1989 [4]. After the accident the Federal Aviation Administration, FAA, urged OEM’s to investigate the possibility of incorporating a damage tolerance life method to account for inherent flaws, which could lead to failure of an engine, for certification of new rotor designs [3-6]. The damage tolerance lifing method assumes that all components and materials have inherent flaws and conservatively determines the inspection interval required to prevent these flaws from growing to a critical size which may lead to failures, like that in Sioux City [1, 2, and 4]. For the purpose of quantifying the operating risk utilizing damage tolerance methods South West Research Institute, SWRI, developed the Design Assessment of Reliability With Inspection (DARWIN®) software pack-age. DARWIN® is a probabilistic fracture mechanics program which utilizes damage tolerance con-cepts to determine the POF of a component with inherent defects subjected to cyclic loading condi-tions [7]. DARWIN® is recognized and approved for use by the FAA for new rotor design certifica-tion [1]. However, the current lifing methods employed in DARWIN® and outlined by the FAA for the risk assessment of high energy rotors provide conservative risk values which ensure that the cu-mulative POF is less than 1 in a 1,000 components over the operational safe life [13].
Safe life and damage tolerance conservatively predetermines the operating life of components, retir-ing them regardless whether there is a cause [1, 10]. Therefore, to safely extend the operational life of components a method of retirement-for-cause (RFC) is being investigated by the U.S. Air Force. Under RFC, components are only removed from service if a crack like defect is detected by a non-destructive inspection (NDI) [10]. RFC allows for the utilization of a greater percentage of the com-ponent life while reducing the life cycle cost [9]. RFC utilizes damage tolerance concepts to allow for safe extension of component life beyond the accepted LCF limit. Safe life is utilized to establish the LCF limit, which specifies the safe life of components at three standard deviations below the mean fatigue limit [13]. The LCF limit must be established for RFC such that LCF induced damage can be accounted for. Meanwhile, damage tolerance concepts establish the necessary safe inspection intervals [1]. The safe inspection interval (SII) must be determined to ensure that the LCF induced defects, also called flaws, do not have time to grow to a critical length. However, as components are kept in-service beyond the LCF limit of the material the risk of failure increases [1, 9]. Therefore, before RFC can be implemented the increased risk must be quantified and the conservatism of the probabilistic risk assessment must be minimized. A DARWIN® fracture mechanics based probabil-istic risk assessment is performed to quantify the risk of component usage.
To move forward with RFC a more accurate risk value must be attained. DARWIN® produces a relative risk [7, 8], thus one way to reduce the conservatism of the probabilistic risk assessment is by moving towards an absolute risk. One method for accomplishing this is through the discretization of the turbine disk for use in the probabilistic risk assessment. The current lifing methods utilize the life-limiting location of the life-life-limiting feature to assess the risk for the component [7, 8]. The life-lim-iting location is based on the maximum stress location of the component, in which the max principal stress is extended through and applied to the entire surface area of the life-limiting feature [7, 8]. Conversely, the discretization method utilizes the stress gradient topology to capture the effects of the stress gradient, of the feature, on the POF of the component. As the stress gradient of a feature increases, the discretization produces a lower risk, thus removing conservatism from the risk deter-mination. This produces a more accurate risk value, called an absolute risk, for each feature of the component. This report will cover the methodology for establishing the discretization of the turbine disk, for use in the retirement for cause approach. Thus establishing the method for quantifying the risk associated with the safe life extension of turbine engine components. Next the creation and es-tablishment of the finite element model for use in the discretization and probabilistic risk assessment will be discussed.
Finite Element Model. This section covers the generation and establishment of the representative turbine disk finite element model. The three dimensional finite element model and stress analysis of the representative turbine disk, for use in DARWIN®, can be created using Abaqus® or Ansys® [7, 8]. The stress results were then compared to expected results to validate the solutions of the finite element analysis (FEA) simulation. The model output database file, .odb, was then converted, to a DARWIN® compatible version, utilizing the conversion software of the DARWIN® software pack-age [7, 8].
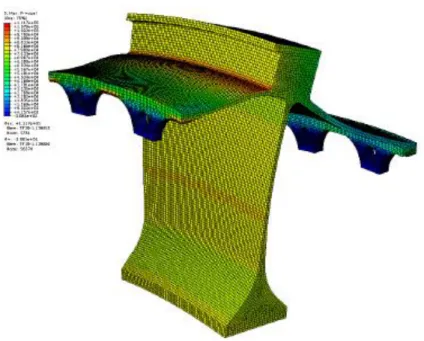
For the purpose of the proposed method the 3-D finite element model was created via Abaqus/CAE®. The geometry and loading conditions of the turbine disk were provided by the U.S. Air Force. The Abaqus/CAE® generated visualization of the 3-D representative turbine disk model has been provided in Fig. 1. Due to the high operating temperatures of turbine disks Inconel 718 was selected to be utilized as the material of the representative turbine disk. The material properties of Inconel 718 were obtained from the High Temp Metals Inc. [11] and Military Handbook, MIL-HDBK-5H [12]. Once the finite element model, material properties, and loading/boundary conditions were established, the finite element analysis was performed. A standard mesh convergence study was performed to ensure convergence of the analysis results.
Fig. 1. Abaqus®/CAE generated visualization of the representative turbine disk.
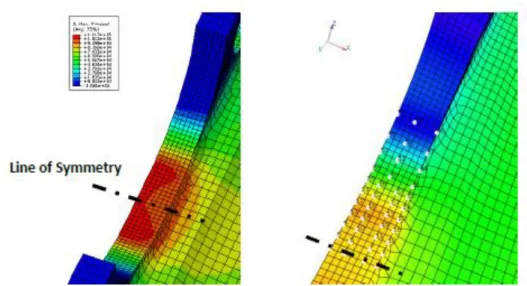
The maximum principal stress results were obtained, as shown in Fig. 2, from the finite element analysis for comparison to the expected values. To validate the finite element analysis results for the representative turbine disk the max principal stresses at key locations were compared to expected stress values provided by the U.S. Air Force. The highest max principal stress was determined to be in the inlet air slot, shown in Fig. 3, which was where the max value was expected to be. The lowest max principal stress was expected and found in the inlet bolt hole.
Fig. 3. Abaqus®/Implicit stress results for max principal stresses at the inlet air slot.
The converged and validated representative turbine disk finite element model was then converted for utilization by DARWIN® for the discretization and probabilistic risk assessment. The DARWIN® software package contains a conversion code which upgrades the output database, .odb, file into a DARWIN® compatible file, *.upgraded.odb [7, 8], to perform the fracture mechanics based probabilistic risk assessment of the representative turbine disk. Next, the proposed methodology and general guidelines for the establishment of the feature-based discretization of a representative turbine disk for the determination of an absolute risk value will be developed.
Feature-based Discretization of a Turbine Disk. This section will cover the method for discretizing the representative turbine disk for the probabilistic risk assessment. A feature-based discretization of the representative turbine disk is necessary to move from the relative risk, of the life-limiting approach developed by the FAA, to an absolute risk, resulting from the stress gradient topology based discretization approach developed in this report. To establish the feature-based discretization of the representative turbine disk the finite element model was characterized by the eight major features as shown in Fig. 4. The defect locations were introduced in response to the stress gradient topology of each feature to establish the feature-based discretization of the component. A 2-D slice is generated for each defect location to establish a corresponding zone for the definition of the fracture mechanics plate and the associated variable analysis parameters [7]. The defect occurrence rate of the feature is established by the geometry of the feature and the anomaly distribution. The defect occurrence rate is utilized to move from the conditional POF to the unconditional POF [7, 8], thus accounting for the inherent flaws in the materials and components [2, 4].
The eight major features, as shown in Fig. 4, were established based on geometry to allow for the consistent discretization of the representative turbine disk model. The features of the model include: the inlet and outlet bolt holes, air slots, and webs, along with the hub and hub web. The general guidelines for the establishment of the defect locations for these features are provided in further detail in the next section.
Defect locations. The representative turbine disk features were discretized thru introduction of defect locations, which were constructed on the stress gradient topology. General guidelines for the discreti-zation of features based on the stress gradient topology have been established. These recommenda-tions are meant as a general starting point, further refinement may be necessary to attain convergence, which is discussed in further detail in section 5.
The defect locations, also called zones [7, 8], are the points of interest, in a particular component feature, in which defects (cracks) are permitted to grow in the fracture mechanics plate for the prob-abilistic risk assessment of the feature [7, 8]. The defect locations are established for the model and are assumed to be of equal risk [4, 8]. Thus, each defect location should have similar POF risk con-tribution factors (RCF) for a given component feature [8]. The defect locations of the component features were established such that the associate area encompasses an approximately univariant stress
gradient. Through performance of the probabilistic risk assessment and experience some general guidelines were established for the introduction of the defect locations.
Fig. 4. Turbine disk model feature nomenclature.
As a general guideline for the turbine disk features it was established that in the high stress gradient regions, where the stresses produce stress intensities above the stress intensity threshold, for every 1 ksi in the transverse direction of the circular feature a defect location set was necessary. Meanwhile, in low stress gradient regions, where the stresses produce intensity factors below the stress intensity threshold, a defect location set is necessary only every 15 ksi in the transverse direction of the circular feature. The defect location sets should contain corner crack type defect locations at the edges of the circular feature and any number of surface crack type defect locations on the surface between the edges. As a general guideline it was determined that for a variation of 1.5 ksi thru the circular feature one surface defect was required for the defect location set.
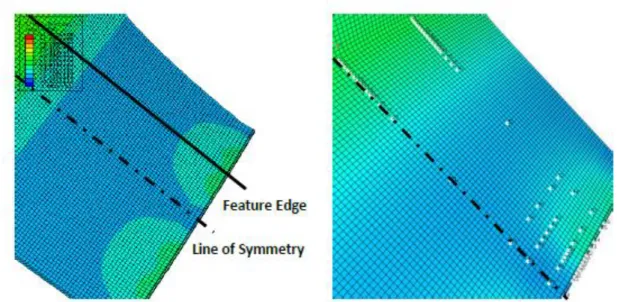
The same approach was determined to be appropriate for the establishment of the defect locations, or zones, within the “web” features, which are not fully treated as circular features. For these features the stress gradient and geometry line of symmetry was utilized as the transverse direction for the general guidelines. This allows for the same guidelines, which have been established for the circular features, to be utilized for the “web” features as well. The max principal stresses and the correspond-ing defect locations for each of the turbine disk features have been provided in Figs. 5-12 for the converged risk assessment model.
The creation of the defect locations are both feature and stress gradient dependent. The hub and hub web were found to have truly univariant stress gradients, which results in a single defect location set required through these features, as seen in Figs. 5 and 6.
respectively. These were the only two features which were found to have a truly univariant stress gradient. The remaining features were found to have bivariant stress gradients. Thus, dictating the development of an extensive method for establishing the feature-based discretization of the remaining features; to ensure that the defect location surface areas meet the assumption of univariant stress gradient at each defect location.
Fig. 5. Max principal stresses and the defect locations of the hub.
Fig. 6. Max principal stresses and the defect locations in hub web.
The inlet air slots and bolt holes were found to have bivariant stress gradients. This produces the need for multiple defect location sets for the circular features, shown in Figs. 7 and 8 respectively, to meet the assumption that the stress gradient of each defect location should be univariant. These features were also found to be symmetric about the transverse direction centerline of the feature with respect to the max principal stresses, which can also be seen in the stress Fig. of Figs. 7 and 8. The symmetry of the feature stress gradients allows for the establishment of fewer defect locations to fully define the total surface of the feature. This leads to an increase in the computational efficiency of the feature probabilistic risk assessment.
Fig. 7. Max principal stresses and the defect locations in inlet air slot.
Fig. 8. Max principal stresses and the defect locations in inlet bolt hole.
The symmetry of the max principal stresses and the stress gradients were also identified in the inlet web. As was found with the inlet air slots and bolt holes this decreases the number of defect locations needed to define the feature, thus increasing the computational efficiency of the model. The bivariant stress gradients of the inlet web lead to the necessity of multiple defect location sets to generate the discretization such that the surface area associated with each defect location could be treated as having a univariant stress gradient. The max principal stresses and defect locations established for the inlet web have been provided in Fig. 9.
Fig. 9. Max principal stresses and the defect locations in inlet web.
The bivariant stress gradients of the max principal stresses were also identified in the outlet air slot, bolt hole, and web features. The defect locations were established in the same manner as was done for the corresponding inlet features. The stress gradients and resulting defect location have been provided in Figs. 10-12.
Fig. 10. Max principal stresses and the defect locations in outlet air slot.
Fig. 12. Max principal stresses and the defect locations in outlet web.
Zone definitions. Once the defect locations of each of the features have been established 2-D slices were generated at each of the defect locations [7]. These 2-D slices are then utilized to establish the zone definitions. The zone definitions are comprised of the crack type selection, plate definition, and determination of the variable analysis parameters [7, 8]. For the purposes of the proposed discretiza-tion method the crack types were selected such that the fracture mechanics plates are defined in terms of the defect location’s surface area. The fracture mechanics plate definition consists of the establish-ment of the fracture mechanics plate and the associated surface area of the defect location [7]. The variable analysis parameters include the inspection schedules and zone properties, which consist of the material fatigue crack growth (FCG), and anomaly distribution to be utilized for each defect lo-cation.
Crack type. There are several crack types available in DARWIN® to describe the crack associated with each defect location of the feature. The crack type was utilized to establish the fracture mechan-ics plate for the POF determination of each defect location. For the turbine disk model two crack types were utilized. The crack types were selected as univariant cracks, utilizing the assumption that after the discretization, each of the defect locations and associated surface areas have univariant stress gradients. Therefore, the univariant surface crack type SC17 and the univariant corner crack type CC11 were chosen for use in the probabilistic risk assessment of the representative turbine disk. These crack types have the capability to be defined in part by the surface area associated with the defect location as part of the fracture mechanic plate definition in DARWIN® [7, 8]. Now that the crack type has been selected the variable analysis parameters and the fracture mechanics plate definitions can be established.
Variable analysis parameters. The variable analysis parameters consist of the necessary input pa-rameters required for the determination of the turbine disk POF. These variable input papa-rameters can be provided such that variability in the inspection schedules and properties can be captured to ascer-tain the effect on the POF. The variable analysis parameters provide the definitions for the inspec-tions, the material FCG data, and the anomaly distribution.
The inspection input parameter consists of assigning an inspection schedule and POD curve, which simulates the capabilities of the NDI techniques, to the defect location’s zone definition. There are several predefined POD curves available within DARWIN®. For the assessment performed under the proposed discretization methodology the default 400 MV 50% confidence level Eddy Current inspection POD curve, Fig. 13, was utilized [6, 7]. The inspection intervals and standard deviations can also be varied to established standards for the inspection schedules. The inspection schedule was employed as outlined in the FAA AC 33.70-2 [6]. The inspection schedule was established assuming
100% of fleet components are inspected at the 4,000 and 8,000 flight cycles with an end life of 20,000 flight cycles. This inspection schedule was chosen for the ability to later compare the results with those obtained by performing the life-limiting approach as outline by the FAA AC 33.70-2 [6].
Fig. 13. Default AIA 400 MV 50% confidence level Eddy Current POD curve [6, 7].
The material FCG analysis parameter was utilized in the fracture mechanics formulation for the determination of the POF of the individual defect locations. Experimental FCG data for Inconel 718 was collected from literature and compiled to establish a database of the material FCG [1, 15, and 16]. A statistical analysis was performed on the experimental data, utilizing the JMP® statistical software package, to establish the mean and ±3σ of the material FCG data. A plot of the experimental material FCG data and the results from the JMP® statistical analysis have been provided in Fig. 14. The upper dotted line represents the -3σ of the data; while the lower dotted line represents the +3σ of the data. The solid line thru the middle of the experimental data is the mean FCG data. The Paris equations for the material FCG mean and ±3σ lines, equations 1-3, were determined from the JMP® statistical analysis shown in Fig. 14. For the probabilistic assessment of the representative turbine disk the Inconel 718 FCG data and resulting mean Paris equation, equation 2, were utilized.
𝑃𝑐𝑜𝑚𝑝𝑜𝑛𝑒𝑛𝑡 = 1 − ∏8 (1 − 𝑃𝑖)
𝑖=1 (1)
𝑀𝑒𝑎𝑛: 𝑑𝑁𝑑𝑎 = 1.034𝐸(−9)(∆𝐾)2.95 (2)
Fig. 14. Inconel 718 FCG data with mean and ±3σ lines.
The anomaly distribution analysis parameter is utilized to establish the manufacturing induced anomaly distribution curve for the occurrence of alpha particles in Inconel 718. For the surface damage probabilistic risk assessment the default anomaly distribution for circular features was established and is available in DARWIN® [7, 8]. The default anomaly distribution has been provided in Fig. 15. This anomaly distribution was utilized as the base curve for the assessment of the representative turbine disk. For the feature-based discretization method a frequency reduction factor was utilized to adjust the default anomaly distribution based on the L/D ratio [7], which is discussed in section 3.3.1 in further detail.
Fig. 15. Default circular feature anomaly distribution curve [7, 8].
Plate definition. The plate definition tab of the zone definition allows for the generation of the frac-ture mechanics plate for utilization in the fracfrac-ture mechanics based probabilistic risk assessment be-ing performed by DARWIN® [7, 8]. The plate should be created such that it closely approximates the feature geometry [7]. It may be necessary to adjust the plate gradient angle such that the plate crack propagation direction is perpendicular to both the surface and the surface stress gradients [8].
Once the fracture mechanics plate has been generated it is necessary to determine the surface area associated with the defect location.
The formulations necessary for the determination of the surface areas are geometry specific. The surface area associated with each defect location is necessary in the establishment of the unconditional POF [8], which is discussed in further detail in section 3.3.2. The surface area formulations were derived and established for the various geometries found in the representative turbine disk model. For a different turbine disk model it may be necessary to establish additional surface area formulations.
For the surface area of a circular feature, such as the hub, in which there is only one defect location set thru the feature the surface area formulation is a result of the lateral surface area of a cylinder with the equation,
𝑆𝐴 = 2𝜋𝑟𝑡 (4)
where r – is the radius of the circular feature;
t – is the thru thickness associated with that defect location.
Given a circular feature, such as the air slots or bolt holes, in which multiple defect location sets thru the feature are present, the surface area formulation results from the equations for arc length and law of cosine. These equations are combined and result in the following equation for the surface area,
𝑆𝐴2 = 2 [360𝜋𝑟 𝑐𝑜𝑠−1(2𝑟 2−(∆𝑦 122 +∆𝑧122 ) 2𝑟2 ) + 𝑐𝑜𝑠−1( 2𝑟2−(∆𝑦232 +∆𝑧232 ) 2𝑟2 )] 𝑡 (5)
where r – is the radius of the circular feature;
t – is the thru feature thickness associated with the defect;
∆𝑦 – is the feature transient global coordinate; ∆𝑧 – is the feature radial global coordinate.
The subscripts 1, 2, and 3 refer to the defect locations. This surface area formulation was also utilized for the determination of the associated surface areas of the inlet web defect locations.
Given a disk like feature, such as the hub web or outlet web, the surface area formulation can be expressed by the equation for a truncated cone. This surface area formulation can be expressed as,
𝑆𝐴2 = 𝜋 [(𝑟1+ 𝑟2)√∆𝑥12 2 +∆𝑦 122 2 + (𝑟2+ 𝑟3) √∆𝑥232 +∆𝑦232 2 ] (6)
where r – is the feature radius;
∆𝑥 and ∆𝑦 – are the global coordinates.
The subscript values 1, 2, and 3 refer to the defect locations of interest.
These surface area formulations were utilized to approximate the surface areas associated with each of the defect locations in the various features of the representative turbine disk model. The surface
areas are then utilized to establish the area effect [7], as discussed in section 3.3, for the determination of the unconditional POF from the conditional POF [7, 8], as discussed in greater detail in section 4. Defect occurrence rate. The final aspect of the DARWIN® probabilistic analysis is the establish-ment of the defect occurrence rate, also known as the volume or area effect. To move from the con-ditional POF to the unconcon-ditional POF the defect occurrence rate must be established. The defect occurrence rate utilizes the anomaly distribution, frequency reduction factor, and the surface area associated with the defect location [6, 7, and 8]. The frequency reduction factor, ν, is utilized to alter the anomaly distribution to account for the effect of the slenderness ratio of the circular features on the risk computations [8]. This adjustment gives the defect occurrence rate per area, which is multi-plied by the surface area to obtain the total defect occurrence rate for the respective defect location. This means that the defect occurrence rate can be different between defect locations. The defect oc-currence rate is then applied to the conditional POF to form the unconditional POF.
Frequency reduction factor, 𝝂. The frequency reduction factor is utilized to adjust the anomaly distribution to account for the effect of the slenderness of circular-hole features [8]. DARWIN gen-erates the frequency reduction factor from the plate definition supplied within the zone definition of the defect location [7, 8]. This default formulation works for the developed life-limiting approach. However, the DARWIN® formulation was insufficient for use with the discretized approach devel-oped within this report. The issue occurred in the surface area associated with the defect location. DARWIN® appears to assume that the surface area provided is for the entire feature not for a fraction of the feature, as is the case for the discretization method proposed in this report.
The discretization approach utilizes the surface areas associated with the individual defect locations not the feature surface area. To account for this the frequency reduction factor was established externally. The frequency reduction factor is a piecewise parameter, as shown in Fig. 16, which is dependent on the slenderness ratio of the feature [8], which can easily be obtained from the turbine disk geometry. Once the slenderness ratio of the feature of interest is known the frequency reduction factor can be obtained. The frequency reduction factor is formulated as [6, 7, and 8],
𝜈 = {0.04 × 0.04 𝑒(10.729∗(𝐿 𝐷⁄ −1)) 1.0 𝑓𝑜𝑟 𝐿 𝐷 ⁄ ≥ 1.0, ≤ 1.3< 1.0 > 1.3 (7)
For the representative turbine disk the frequency reduction factors were established for each of the features. For the circular features, such as the inlet and outlet air-slots and bolt-holes, and the hub, a reduction factor of 0.04 was obtained. The web features are turned surfaces which generate a much smaller occurrence rate of anomalies. For the web features a value of 0.0025 was established from assessment investigation, experience, and information obtained from engineers at Wright Patterson AFB. This frequency reduction value ensures that the web POF’s are below the life limiting inlet air-slot feature POF. Once the frequency reduction factor has been established the defect occurrence rate can be determined.
Defect occurrence rate, α. The defect occurrence rate must be established to move from the condi-tional POF to the uncondicondi-tional POF. The defect occurrence rate is defined by the frequency reduction factor, the anomaly distribution, and the surface area associated with the defect location [7, 8]. The exceedance rate associated with the minimum crack length of the anomaly distribution was utilized to define the defect occurrence proportional to a unit surface area [8]. The surface area associated with each defect location was then necessary to define the defect occurrence as a rate. The defect occurrence rate for the discretization method can be expressed as,
𝛼𝑧𝑜𝑛𝑒 = 𝜐𝑓𝑒𝑎𝑡𝑢𝑟𝑒× 𝑁𝑑[𝑎𝑚𝑖𝑛] × 𝑆𝐴𝑧𝑜𝑛𝑒 (8)
where 𝜐𝑓𝑒𝑎𝑡𝑢𝑟𝑒 – is the frequency reduction factor of the feature;
𝑆𝐴𝑧𝑜𝑛𝑒 – is the surface area associated with the defect location;
𝑁𝑑[𝑎𝑚𝑖𝑛] – is the exceedance/𝑖𝑛2 of the minimum crack length of the anomaly distribution [8].
Probabilistic risk determination
The fracture mechanics based probabilistic risk assessment was performed in DARWIN®. The probabilistic risk assessment was established by performing a Monte Carlo simulation on each defect location for the fracture mechanics determination of the conditional POF for the representative turbine disk model [7, 8], which was established in sections 2 and 3. From the Monte Carlo simulation the conditional POF was obtained for each defect location of a particular feature. Once the conditional POF was obtained for each of the features, it was essential to determine the unconditional POF. The unconditional POF was established externally via a MATLAB code which was developed. The unconditional POF can be expressed as,
𝑃 𝑧𝑜𝑛𝑒𝑢 = 𝑃𝑐 × 𝛼
𝑧𝑜𝑛𝑒 (9)
where 𝑃 𝑧𝑜𝑛𝑒𝑢 – is the unconditional POF;
𝑃𝑐 – is the conditional POF;
𝛼𝑧𝑜𝑛𝑒 – the defect occurrence rate [7, 8].
Once the unconditional POF has been determined for each defect location for a feature, the feature risk can be established. The feature risk is established by statistical means, assuming mutually exclusive events [17, 18], as defined in section 4.1. After the representative turbine disk feature risks have been quantified the overall turbine disk component risk can be determined. The disk risk determination was established utilizing a statistical combination of the feature POF’s [17, 18], provided in section 4.2.
Probabilistic feature risk. The probabilistic assessment of the discretized turbine disk yields a POF results for the defect locations. To obtain the total feature risk the POF’s of the individual defect locations, as shown for the inlet air-slot in Fig. 17, are statistically combined. The statistical combi-nation is established for a mutually exclusive and/or case [17, 18]. With the statistical combicombi-nation the feature POF can be expressed as,
𝑃𝑓𝑒𝑎𝑡𝑢𝑟𝑒 = 1 − ∏𝑛𝑖=1(1 − 𝑃𝑖) (10)
where i – is the zone index;
Pi – is the zone POF [17, 18].
This formulation provides a means for establishing the discretized POF of the feature, as shown in Fig. 18 for the inlet air-slot.
Fig. 18. Statistical Feature Risk w/ inspection, Inlet Air-slot.
Probabilistic component risk. Once the turbine disk model risk is obtained for the features, the discretized component POF can be obtained. As was done for the feature POF the component POF can be obtained by statistically combining the feature POF’s by,
𝑃𝑐𝑜𝑚𝑝𝑜𝑛𝑒𝑛𝑡 = 1 − ∏8𝑖=1(1 − 𝑃𝑖) (11)
where i – is the feature index;
Pi – is the feature based POF [17, 18].
The individual feature risks, shown in Fig. 19, are statistically combined to form the turbine disk risk, as shown in Fig. 20.
Fig. 20. Plot of total disk risk with in-service inspections.
Feature probability-of-fracture convergence and credibility check. The previous sections have provided the methodology for establishing the discretization and probabilistic risk determination. This section establishes the methodology utilized for establishing convergence and a credibility check of the discretization of the representative turbine disk model. The convergence studies were per-formed on the discretization of the representative turbine disk features to ensure the POF results have reach a singular POF solution per flight cycle. Two convergence studies were performed on the prob-abilistic risk assessment of the representative turbine disk.
One study was performed to determine the required number of samples for the Monte Carlo simula-tion to ensure convergence of the POF per flight cycle. The second convergence study was performed to establish the number, or density, of defect locations utilized for the discretization of the representa-tive turbine disk model. The credibility check of the discretization method was performed by com-paring the results obtained from the discretization method with the FAA’s life limiting method. The convergence study is necessary to establish the accuracy of the POF results obtained from the proba-bilistic risk assessment of the turbine disk. Meanwhile, the credibility check was established to eval-uate the discretization method in comparison with the FAA’s life-limiting method.
Feature probability-of-fracture convergence. A convergence study of the discretized representa-tive turbine disk was necessary to ensure that the POF of the defect locations and the features ap-proach the risk solution limit. Two convergence studies of the POF for the turbine disk are necessary. The first convergence study required was on the number of Monte Carlo samples utilized in the prob-abilistic risk assessment. The second convergence study that was necessary was for the feature POF based on the number, or density, of defect locations. These two convergence studies provide evidence which ensures that the model results are converging to a singular solution per flight cycle.
The first convergence study that was performed was on the number of Monte Carlo samples for the probabilistic risk assessment [7, 8]. This convergence study was performed to ensure that the number of random Monte Carlo samples were adequate to capture the POF of the defect location. According to Immarigeon and Graham, there should be enough samples to ensure that 1 in 1,000 components develop a life-limiting crack [2, 14]. The convergence study of the number of samples for the Monte Carlo simulation was performed. It was determined that a Monte Carlo simulation with 100,000 sam-ples was adequate for the probabilistic risk assessment of the representative turbine disk.
Next, a convergence study was performed on the number of defect locations within a given feature. However, there is more to the convergence study than just adding more defect locations. According to Millwater et. all, the identification of the defect locations requiring refinement is a key ingredient for the refinement [3]. For the probabilistic risk assessment, the defect locations should have nearly equal risk contribution factors (RCF) [3]. An initial run was performed for each feature and the feature POF was obtained. From the POF results of the probabilistic risk assessment a pie chart of the defect locations RCF’s was created, i.e. the inlet air slot as shown in Fig. 21.
Defect locations which have RCF’s greater than 5%, also called the RCF limit, are candidates for refinement [3]. For the risk assessment of the inlet air-slot containing 30 defect locations, as shown in Fig. 21, there is a large piece of the pie associated with one defect location, well above the RCF limit. To reduce the RCF at this defect location the area associated with the defect location was split into two, thus adding another defect location to the feature.
Fig. 21. Defect location POF contribution factors for refinement of the inlet air slot.
This method of refinement was performed for all defect locations with RCF’s greater than the RCF limit. The new surface areas were then determined and associated to the new defect locations and a new probabilistic risk assessment was performed. By investigating the effect of the refinement on the POF per flight cycle a check for convergence can be made. Fig. 22 and 23 show the POF versus flight cycles for the probabilistic risk assessment of the inlet air slot. From the Figs. 22-23 it can be seen that the POF has not converged to a solution for the 30 and 32 defect location risk assessments. Therefore, the defect location refinement was repeated resulting in 40 defect locations. From the Figs. it can be seen that at this point the defect location RCF’s are nearly equal with no exceedance of the
RCF limit. Correspondingly, the POF has reached convergence to a solution, as can be seen in Figs. 22 and 23.
Fig. 22. Convergence Plot of POF versus Flights for inlet air slot without inspection.
Fig. 23. Convergence Plot of POF versus Flights for inlet air slot with inspection.
This confirms that convergence of the feature risk has been attained. The convergence procedure was repeated for each of the features which make up the representative turbine disk. Once the Convergence of the Monte Carlo simulation and the feature risk of the component have been obtained the representative turbine disk POF can be established, in accordance with equation 11 of section 4.2. This generates the overall risk, or POF, for the component. Next, the component POF for the discretization of the representative turbine disk can be compared with the component POF results from the life-limiting approach recognized by the FAA.
Feature probability-of-fracture credibility check. To check the credibility of the discretization method developed within this report, the POF results for the discretized representative turbine disk are compared to the results obtained from the FAA, life-limiting, method. The probabilistic risk as-sessment was performed for both the discretized method and the life-limiting method utilizing DAR-WIN®. All analysis input parameters were established similarly for both methods. Therefore, the
only difference in the probabilistic risk assessment was the use of either the life-limiting location of a feature or the discretized feature, containing multiple defect locations.
The FAA’s prescribed method utilizes the life-limiting location of a feature to establish the opera-tional risk of the turbine disk. The life-limiting location of a feature is the location of the highest stress in the feature [6, 8]. Table 1 shows the probabilistic risk results for the life-limiting location of each of the representative turbine disk features. Of these, the FAA methodology utilizes only the most limiting location to define the component POF [6]. Unlike the discretization method, the FAA life-limiting method takes the entire surface area of the feature and the highest max principal stress, called the life-limiting stress, and projects it throughout the feature [6, 8]. This means that the entire feature is defined by a single defect location, the life-limiting stress location, associated with the entire sur-face area of the feature. In the case of the representative turbine disk this corresponds to the inlet air slot. Through the life-limiting location approach the component risk, which corresponds to the inlet air slot POF, was determined to be 2.06E-6.
The FAA life-limiting method provides a relative risk value, which does not account for the stress gradient topology of a particular feature. The discretization method allows for the stress gradient topology to be captured in the risk assessment, thus moving towards an absolute risk value. This is important as the U.S. Air Force considers the use of RFC to safely extend component operational life beyond the LCF limit of the safe life method.
The discretization of the representative turbine disk was established in section 3, with the probabilistic risk determination defined in section 4. The feature risk values obtained from the probabilistic risk assessment of the representative turbine disk are provided in table 1. The resulting operational risk of the inlet air slot was found to be 4.84E-7. This risk value is smaller in comparison to the inlet air-slot risk value obtained by the FAA life-limiting method. The change in the risk results from the discreti-zation method’s ability to capture the stress gradient topology producing a more accurate risk for the feature. Whereas, the FAA life-limiting method assumed the limiting stress was constant throughout the entire surface area of the feature. Fig. 24 exhibits the difference in the feature RCF’s for the probabilistic risk assessment. As can be seen the life-limiting method employed by the FAA utilizes only one defect location to describe the entire turbine disk, while the discretized method provides a more equal contribution of all features to the component risk value.
One very interesting result to be mentioned is that the turbine disk POF for the discretization method was close to the FAA life-limiting method. There are many possible factors which may have led to this result. For example, the web features utilized the same default anomaly distribution as the circu-lar-hole features. The difference was that the frequency reduction factor was established based on experience and a best guess. A change to the web anomaly distribution or frequency reduction factor could result in a change in the similarity of risk values. Therefore, a conclusion cannot be easily drawn on this happenstance; rather it could be a coincidence of the approximation of some of the analysis parameters of the probabilistic risk assessment. A conclusion that can be drawn though is the fact that the risks of the features are lower for the discretization method than that of the life-limiting approach. This occurred because the discretization method accounts for the stress gradient topology which removes some level of conservatism from the risk assessment in an effort to move towards an absolute risk value. Regardless, this information provides a credibility check for the proposed meth-odology, the discretization of a turbine disk for probabilistic risk assessment.
Table 1. Comparison of the end life POF with inspection for the life limiting approach and the proposed discretization approach to the probabilistic risk assessment of the representative turbine disk.
Fig. 24. Feature contribution charts for the life limiting and discretization methods for the probabilistic risk assessment of the representative turbine disk.
Summary. There is an economic benefit to safely extend the operational life of turbine engine com-ponents. Advances in computational tools and scientific knowledge have provided the capability to determine the probabilistic risk involved in operational usage of turbine engine components. One such computational tool that has been developed is the probabilistic risk assessment software package DARWIN®, the Design Assessment of Reliability With INspection. This program was created in conjunction with the FAA to establish a damage tolerance approach extension of the safe life method. The endeavor to establish a damage tolerance approach was a result from the accident at Sioux City in 1989, in which a catastrophic engine failure occurred due to manufacturing induced anomalies that degraded the integrity of a high energy rotor disk [4]. The damage tolerance approach and DAR-WIN® were developed to establish the capability to utilize NDI techniques and account for the man-ufacturing induced anomalies [4, 6, and 7]. However, the safe life and the damage tolerance ap-proaches provide conservative approximations for the operational risk of turbine engine components. To safely extend the operational life of turbine engine components the conservatism of the current lifing methods must be reduced. The proposed method establishes the capability to reduce the conservatism of the lifing methods by moving from the relative risk calculations to an absolute risk calculation through the feature based discretization of a turbine disk. The discretization provides the means to capture the max principal stress gradient topology of the component features for the probabilistic risk assessment. For the feature based discretization, the turbine disk is initially separated into the major component features. These features are then discretized through the introduction of defect locations, which were constructed by means of the max principal stress gradient
topology. These defect locations are placed such that the surface area associate with each defect location exhibits a univariant stress gradient.
Some general guidelines, for the introduction of the defect locations, were developed through the investigation of the discretization of a representative turbine disk. For the turbine disk features it was established that in the high stress gradient regions, where the stresses produce stress intensities above the stress intensity threshold, for every 1 ksi in the transverse direction of the feature a defect location set was necessary. Yet, in low stress gradient regions, where the stresses produce intensity factors below the stress intensity threshold, a defect location set was necessary only every 15 ksi in the transverse direction of the feature. The defect location sets should contain corner crack type defect locations at the edges of the feature and any number of surface crack type defect locations on the surface between the edges. As a general guideline it was determined that, for a defect location set, every 1.5 ksi thru the feature only one surface defect was required. These guidelines are meant to provide a starting point for the assessment, further refinement of the defect locations may be necessary to obtain convergence.
For the discretization of a representative turbine disk a convergence study was performed to ensure the assessment reaches the solution. The convergence study was performed utilizing the risk contri-bution factor, RCF, of the defect locations in a particular feature. If the RCF of a defect location exceeded the RCF limit, approximately 5%, then the surface area of that defect location was divided into two areas and a new defect location was introduced. The feature POF, which was established by the statistical combination of the risks of all defect locations in the feature, was utilized to verify convergence. Once all defect locations have RCF values below the RCF limit or the feature risk no longer changes then convergence was obtained.
A credibility check of the proposed method for the discretization of a turbine disk for the probabilistic risk assessment was performed by comparing the risk results with those obtained by performing the FAA recognized life-limiting approach. It was shown that the probabilistic risk for the discretization of the turbine disk was close to, yet lower than the results obtained from the life-limiting approach. This was expected due to the move from a relative risk to an absolute risk of service for the representative turbine disk. This report provides the method and approach for the reduction of the conservatism found in current lifing methods. The discretization method can be employed in the investigation for the safe extension of turbine engine components operational life beyond the LCF limit.
Nomenclature
AC – Advisory Circular AFB– Air Force Base CC11 – Univariant Corner Crack type,
DAR-WIN®
D – Feature diameter
DARWIN® – Design Assessment for Reliabil-ity With INspection
FAA – Federal Aviation Administration FCG – Fatigue Crack Growth FEA – Finite Element Analysis
L – Feature length, or depth LCF –.Low Cycle Fatigue NDI – Non-Destructive Inspection POD – Probability Of Detection POF – Probability-Of-Fracture (Failure) RCF – Risk Contribution Factor RFC – Retirement For Cause SA – Surface Area
SC17 – Univariant Surface Crack type,
DAR-WIN®
SWRI – South West Research Institute odb – Output database file r – Radius
t – Thickness 𝑎𝑚𝑖𝑛 – Minimum crack size of the anomaly
dis-tribution
𝑁𝑑 – Exceedance rate from the anomaly distri-bution
Pcomponent –Component level
probability-of-failure
Pfeature – Feature level probability-of-failure Pi – Defect location probability-of-failure
Pc –Conditional probability-of-failure Pu – Unconditional probability-of-failure 𝑑𝑎
𝑑𝑁– Fatigue crack growth rate α – Defect occurrence rate
Δ𝐾 – Change in stress intensity factor Δ𝑥– Change in global x-direction
Δ𝑦– Change in global y-direction Δ𝑧– Change in global z-direction
ν – Frequency reduction factor -3σ – Lower 3 standard deviation, value of lower confidence bound
References
[1] Whitney-Rawls, Ashley, “Impact of Induced Defect on Rotor Life Assessment”, Wright State University, 2010.
[2] Immarigeon, J-P., Koul, A.K., Beres, W., Au, P., Fahr, A., Wallace, W., Patnaik, P.C., Thamburaj, R., “The Aging Engines: An Operator’s Perspective”, NATO-RTO-AVT Lecture Series 218, October 2000.
[3] Millwater, H., Enright, M., Fitch, S., “Convergent Zone Refinement Method for Risk Assessment of Gas Turbine Disks Subject to Low-Frequency Metallurgical Defects”, Journal of Engineering for Gas Turbine and Power, July 2007, Vol. 129.
[4] “Damage Tolerance for High Energy Turbine Engine Rotors”, Federal Aviation Administration Advisory Circular 33.14-1.
[5] “Guidance Material for Aircraft Engine Life-Limited Parts Requirements”, Federal Aviation Ad-ministration Advisory Circular 33.70-1.
[6] “Damage Tolerance of Hole Features in High-Energy Turbine Engine Rotors”, Federal Aviation Administration Advisory Circular 33.70-2.
[7] Southwest Research Institute, “DARWIN 7.0 User’s Manual” 2010. [8] Southwest Research Institute, “DARWIN 7.0 Theory Manual” 2010.
[9] Vukelich, S., “Engine Life Extension Through the Use of Structural Assessment, Non-Destructive Inspection, and Material Characterization”, NATO-RTO-MP-079(11) Lecture Series, October 2001. [10] Immarigeon, J-P., Koul, A.K., Beres, W., Au, P., Fahr, A., Wallace, W., Patnaik, P.C., THam-buraj, R., “Life Cycle Management Strategies for Aging Engines”, NATO-RTO-MP-079(11) Lecture Series, October 2001.
[11] High Temp Materials, “Inconel 718 Technical Data”, High Temp Materials, September 2011, http://www.hightempmetals.com/techdata/hitempInconel718data.php
[12] Metallic Materials and Elements for Aerospace Vehicle Structures”, MIL-HDBK-5H, 1998 [13] Tong, Yu C., “Literature Review on Aircraft Structural Risk and Reliability Analysis”, DSTO-TR-1110, February 2001.
[14] Graham, A.D., Mallinson, G.D., Tong, Y.C., “NERF-A Tool for Aircraft Structural Risk Anal-ysis”, ICASP8, Manly, December 1999.
[15] Harmon, D. M., and Saff, C. R. “Damage Tolerance Analysis for Manned Hypervelocity Vehi-cle.” Vol. I, Wright Research and Development Center, Wright-Patterson Air Force Base, Ohio, pg. 1-164, Sept. 1989.
[16] Oyelakin, J.O., “On The Fracture and Fatigue Crack Growth of Thin Sheets of Nanocrystalline Metal Alloys”, University of Illinois, 2010.
[17] Kappas, J., “Review of Risk and Reliability Methods for Aircraft Gas Turbine Engines”, DSTO-TR-1306, May 2002.
[18] Millwater, H.R., Osborn, R.W., “Probabilistic Sensitivities for Fatigue Analysis of Turbine Engine Disks”, International Journal of Rotating Machinery, Article ID 28487, Volume 2006.


![Fig. 13. Default AIA 400 MV 50% confidence level Eddy Current POD curve [6, 7].](https://thumb-eu.123doks.com/thumbv2/123doknet/13265141.397042/11.892.263.625.196.505/fig-default-aia-confidence-level-eddy-current-curve.webp)
![Fig. 15. Default circular feature anomaly distribution curve [7, 8].](https://thumb-eu.123doks.com/thumbv2/123doknet/13265141.397042/12.892.259.633.651.972/fig-default-circular-feature-anomaly-distribution-curve.webp)
![Fig. 16. Plot of frequency reduction factor versus L/D ratio [7, 8].](https://thumb-eu.123doks.com/thumbv2/123doknet/13265141.397042/14.892.261.632.690.1070/fig-plot-frequency-reduction-factor-versus-l-ratio.webp)
