HAL Id: halshs-03107869
https://halshs.archives-ouvertes.fr/halshs-03107869
Preprint submitted on 12 Jan 2021
HAL is a multi-disciplinary open access archive for the deposit and dissemination of sci-entific research documents, whether they are pub-lished or not. The documents may come from teaching and research institutions in France or abroad, or from public or private research centers.
L’archive ouverte pluridisciplinaire HAL, est destinée au dépôt et à la diffusion de documents scientifiques de niveau recherche, publiés ou non, émanant des établissements d’enseignement et de recherche français ou étrangers, des laboratoires publics ou privés.
An Original Solution to Agency Issues Among PreWWI
Paris-Listed Firms : The Statutory Rule of Profit
Allocation
Emilie Bonhoure
To cite this version:
Emilie Bonhoure. An Original Solution to Agency Issues Among PreWWI Paris-Listed Firms : The Statutory Rule of Profit Allocation. 2021. �halshs-03107869�
WORKING PAPER N° 2021 – 04
An Original Solution to Agency Issues Among PreWWI Paris-Listed
Firms : The Statutory Rule of Profit Allocation
Emilie Bonhoure
JEL Codes: G32, G34, G35, N23, N83
Keywords: Profit allocation, Corporate governance, Dividend policy, Agency theory, historical finance, France.
1
A
N
O
RIGINAL
S
OLUTION TO
A
GENCY
I
SSUES AMONG
P
RE
-WWI
P
ARIS
-L
ISTED
F
IRMS
:
THE
S
TATUTORY
R
ULE OF
P
ROFIT
A
LLOCATION
Emilie Bonhoure
*Abstract
Agency issues (the conflicts that arise due to the divergence of stakeholders’ interests within firms) remain a critical challenge faced by companies. Unfortunately, there is hardly any existing solution that can claim to mitigate all agency issues at the same time. In this study, I examine an original governance mechanism, widespread within French firms at the turn of the 20th century, which could do so: a statutory rule of profit allocation. It fixed in corporate statutes
the part of profits to be allocated to a pre-determined set of agents. Contrary to other solutions, this rule could indeed be a way to solve several types of agency issues at the same time. Focusing on the allocations to shareholders, I show that this was the case: firms with more severe agency conflicts promised a higher part of profits to shareholders. I also provide evidence of the efficiency of this rule. Firms with more severe agency issues did not deviate too much from it (despite the specific deviations sometimes allowed) and distributed actual dividends close to the promised ones.
Keywords: profit allocation, corporate governance, dividend policy, agency theory, historical
finance, France
JEL codes: G32, G34, G35, N23, N83
I. Introduction
One critical question in corporate finance theory is about agency issues a corporation may face and how to solve them (Tirole 2006). These issues occur when one of the firm’s stakeholders (the agent) is supposed to perform actions or make decisions on the other’s behalf (the principal), but could also act following his interests at the expense of the principal’s interests (Jensen and Meckling 1976). Solving these issues come with (agency) costs for companies. Academic authors have discussed and offered many solutions to the corporate world, aimed at reducing agency issues (Campbell and Turner 2011; Faccio, Lang, and Young 2001; John, Knyazeva, and Knyazeva 2011; Shleifer and Vishny 1997). These solutions range from dividend payout to various governance mechanisms like specific boards, managerial compensation schemes, or voting rights. However, these solutions bear several caveats. In particular, they are usually punctual, meaning they are designed to reconcile the interests of one pair of stakeholders only. No global solution is discussed to deal with all types of agency issues.
Moreover, literature is unclear on the scope of the offered solutions and by how much they help reducing agency issues.
This paper brings forward an original and global solution to agency issues, taken from “historical” firms, and offers to quantify its effect. Companies listed on Paris stock markets at the beginning of the 20th century indeed implemented a specific governance mechanism: a
statutory rule of profit allocation. This rule fixed in corporate statutes the distribution of profits to a pre-determined set of agents or items, including shareholders. It made ex ante observable what certain stakeholders could expect from their involvement in the firm and ensure them a part of firm profits. It thus prevented the agent from misusing firm cash at the expense of the principal. This rule may also constitute a more global solution to agency issues as it could have included allocations for any principal (firm outsiders, shareholders, creditors, employees, etc) whose interests could be threatened by a given agent.
In this paper, I more specifically examine the statutory rules implemented by the 40 largest French firms (hereafter historical CAC40) listed on Paris stock exchanges between 1906 and 1909. I first assess whether it was actually implemented to compensate for agency issues, and then verify whether this governance mechanism worked as a good agency-issue solver. I focus on the distributions made to shareholders1and proceed in two steps. First, I examine whether
the dividend amount ensured by this rule to shareholders was aimed at reducing the agency conflict between them and firm controllers. In the particular case of allocations to shareholders, this rule may have prevented controllers from extracting private benefits (i) by promising higher dividends to shareholders, and (ii) as a whole, by preventing them from changing arbitrarily the levels of dividends paid to shareholders. Second, I explore whether the rule worked and did prevent controllers from extracting too many private benefits at the expense of shareholders. Every year, these firms promised to distribute a certain proportion of their profits as dividends: the expected dividend payout ratio (hereafter EDPR)2. Due to some specificities in the statutory
rules (especially variability sometimes allowed in the distribution set), each firm had a range of
EDPRs annually. For instance, the Aciéries de Longwy ensured in 1906 to distribute between
48.71% (the lower bound of the range, hereafter named the worst EDPR) and 88.39% (the upper bound, hereafter named the best EDPR) of their profits to its shareholders.
In the first part of my analysis, I examine whether EDPRs were set to compensate for agency costs. One way to do so is to assess whether they were higher within firms that suffered from high agency issues. In particular, I test whether firms that were larger, older, with fewer investment opportunities, located further from their shareholders, or listed on the less regulated stock exchange3 had relatively higher EDPR than the others. The results are consistent with the
rule as an agency-issue solver. On the one hand, the best EDPR is positively correlated with the initial size of the firm (measured by initial capital) and its age, and negatively correlated with firm investment opportunities. On the other hand, the worst EDPR is explained by one variable only: firm size (measured by its capital); and positively correlated with it. These effects are also sizeable: while a one-standard-deviation increase in age (or in initial capital) is associated with
best EDPRs higher by 4% (or 3% respectively), such an increase in capital is linked to an
increase of 11% in worst EDPRs. As a whole, EDPRs, and more particularly the best one, were
1 Among the different stakeholder pairs this rule may have help reconciling, I will focus on the shareholders – firm
controllers one. Here, shareholders (or minority shareholders, firm outsiders, etc) are the principal, and firm controllers (or managers, firm insiders, etc) the agent. In further research, other pairs may be considered (shareholders-board, firm-employees, etc).
2 The amount of promised dividends was not a linear function of profits: it varied depending on the amount of
profits. Thus the EDPR also varied every year (depending on the profits made on this certain year).
3 These characteristics (size, age, distance, etc) are indeed shown to be correlated with the agency issues a company
3
higher within firms with more severe agency issues, suggesting that they may have been set to decrease them.
But did it work? Were agency issues mitigated thanks to this rule? This is the second part of my analysis. Should the statutory rule be efficient in reducing agency issues, firms with more severe agency issues should not deviate more from promised dividends than other firms when paying actual dividends (hereafter actual dividend payout ratios – ADPRs). In other words, they should not exhibit an EDPR-ADPR difference significantly different from other firms. The results are consistent with this hypothesis. In particular, older and more remote firms do not exhibit significantly larger best EDPR-ADPR or worst EDPR-ADPR difference. Further, firms that are larger and with fewer investment opportunities even have a lower best EDPR-ADPR difference, suggesting that they distributed something closer to what they promised than others. Overall, the statutory rule of profit allocation may be a global solution offered to companies for them to solve their agency issues. In the particular case of the shareholder-controller relationship, it was implemented to compensate for these issues and was efficient in doing so. However, several points should be noticed about these findings. First, what is studied here is the dividend distribution (either the promised or the actual one) after profits are reported. Set differently, I do not study in this paper the possibility of earning manipulation. Agency issues could also occur before any profit amount is reported to the general assembly (hereafter GA) and before any distribution. Second, the part of the dividends promised to shareholders but not actually distributed to them could be so for more “regular” uses (instead of for private benefits at the expense of firm outsiders). For instance, it could be allocated to reserves to fund future investment projects. Part of further work will then be about controlling for this possibility. Third, the quantitative analysis provides evidence of correlations between EDPRs and measures of agency issues, suggesting that the rule was set to mitigate them. Nonetheless, to confirm that the true objective of companies while stating this rule was to deal with these conflicts will require further analysis. For instance, further research could consist of studying their archives, and in particular statutes or GA reports, to verify whether the discourse was in line with our quantitative results. Fourth, studying EDPRs instead of actual payments allows us to study a solution implemented ex ante by the firm to deal with potential agency conflicts that could arise over its lifetime. Given some of their characteristics, companies implemented a certain rule to decrease agency issues and promised certain amounts to shareholders. Looking at actual dividends, I further show that this mechanism worked.
These findings provide several contributions to the existing literature about the solutions to agency issues (Jensen 1986; Jensen and Meckling 1976; Shleifer and Vishny 1997; Tirole 2006). Many solutions have been discussed and are already implemented within companies (including earlier ones). One of them is the view of dividends as an agency-cost solver4
(Bonhoure, Germain, and Le Bris 2017; Campbell and Turner 2011; Easterbrook 1984; Faccio et al. 2001; Jabbouri 2016; Jensen 1986; John et al. 2011; Lang and Litzenberger 1989). Another one relates to the board and its role in monitoring and advising firm managers (Campbell and Turner 2011; Hermalin and Weisbach 2003; Le Bris, Goetzmann, and Pouget 2016; Ravanel 2013). Appropriate compensation schemes (in particular performance-related ones) may also contribute to reducing agency conflicts between managers and shareholders by aligning their interests (Anderson et al. 2018; Bayer and Burhop 2009; Bebchuk and Weisbach 2010; Burhop 2004; Burhop and Deloof 2017; Jensen and Murphy 1990; Shleifer and Vishny 1997). The use of specific voting right schemes may also help to reduce agency issues, in particular between minority shareholders and controllers (large investors, managers) (Dunlavy 1998; Enriques and
4 This view is related to one of the explanatory models of dividends widely discussed in academic literature: the
agency explanation of dividends. According to this view of dividends, by distributing firm cash to shareholders, dividends may allow to extract cash from managers’ hand and thus to prevent them from misusing it
Volpin 2007; Hilt 2013). More “democratic” voting rules (like one-shareholder-one-vote) are indeed shown to reduce the latter’s bargaining power and thus to allow the former to make their voice heard more easily. With the study of “historical” firms also comes original solutions brought to this agency problem. Acheson, Campbell, and Turner (2019) show that to compensate for the end-19th poor legal protection of UK shareholders, companies implemented
“private contracting” mechanisms under the form of charter provisions. Through their corporate charters, they set mechanisms (like specific governance features, voting right schemes, etc) to protect and attract potential shareholders. However, these solutions are punctual and do not allow firms to deal with several types of agency issues at the same time. They are also mostly elaborated to solve shareholder-controller agency conflict. Conversely, the mechanism unveiled in this paper would make it possible to deal with several agency relationships at once, and thus constitutes a more global solution to them. Even though I focus on the profits promised to shareholders in this paper, this rule ensured allocations of profits to other stakeholders. Part of further research will be about other stakeholders’ conflicts and whether the rule was also efficient in their cases.
Another contribution relates to the shareholder-versus-stakeholder theory. These results echo the very modern debate about who should be entitled to firm profits. Should shareholders receive the bulk of profits (Friedman 1970) or should profits be also allocated to other stakeholders (Robé 2012) like employees? A statutory rule of profit allocation may help modern managers and practitioners to deal with this debate by ex ante fixing the allocation of profits to a specific set of stakeholders, based on corporate strategy and characteristics. This study may help them to understands this “new” governance item and quantify its effects on the agency conflicts they face.
Finally, from a more business history perspective, it is the first study of a very specific governance feature, widespread all over the 19th and at the beginning of the 20th century: the
statutory rule of profit allocation. If papers like Acheson et al. (2019), De Jong, Fliers, and van Beusichem (2019), and Gregg and Nafziger (2019) mention such provisions, they do not specifically study this mechanism of profit distribution.
The rest of the paper is organised as follows. Section II describes the general context of the firms studied in the paper along with the statutory rule of profit allocation. Section III introduces data, methodology, and preliminary statistics. Section IV provides a study of the EDPRs, in particular of their determinants, and compares them to ADPRs. Section V assesses whether this rule was efficient in protecting from agency issues by studying the EDPR-ADPR difference. Section VI concludes.
II. Historical Background
France at the beginning of the 20th century
The pre-WWI period was a period of growing economy in France, after a relatively long period of stagnation. According to Lévy-Leboyer and Bourguignon (1985), 1897 French GDP was about the same as in 1882 while it enjoyed strong growth in the following period and subsequently increased by 67% between 1897 and 1914. In 1907, around half of this growth was realized, with any significant effect of the 1907 US financial crisis. Such a positive economic and financial context was reflected in the steady levels of the interest rates of the French Rente 3% bond (around 3% and 3.2% between 1906 and 1908) and the relatively flat
5
levels of the historical CAC40 in 1907 compared with the prior twenty years5. In particular, the
1906-1909 period is far from the economic and political troubles triggered by the WWI, and from the 1911 inflation peak experienced in France.
If France benefited from strong growth at the time, so did its stock markets: French stock market capitalisation (in terms of GDP) represented, in 1913, almost twice the US one (respectively 78% versus 39%) (Rajan and Zingales 2003). The French financial markets generally followed an increasing trend during the 1890-1936 period: the number of listed companies, the amount of the securities issued by these firms, along with the part of these issues in their capital all increased at the time (Hautcoeur 1999). If we restrict the analysis to the 40 largest market capitalisations, they represented around 20% of the French GDP (Le Bris and Hautcœur 2010). French stock markets were divided into a bunch of local markets in both Paris and the province. This paper focuses on Paris markets because of higher data availability and of the relatively higher importance of the capital markets of the French capital6. More specifically, the Paris
market was divided into two complementary poles (Hautcoeur and Riva 2012). The first one was the “official market” (the Parquet) (re)launched by the government at the beginning of the 19th century to keep control of the financial transactions. As a consequence, this stock exchange
faced several governmental restrictions in terms of companies that could be listed, and of products that could be traded (only spot trades were allowed, while any forward or option contract was forbidden until the end-19th). Most companies listed on this market were French
and relatively larger, usually operating in more mature sectors like railways and banks (Hautcoeur 2007). This stock exchange was then usually the place of exchange of the most liquid securities and attracted more individual and smaller investors.
The second pole of the Paris capital market was the “unofficial” or the “over-the-counter” market, the Coulisse, which initially developed in reaction to the Parquet and the various restrictions it had to face to. It was far less subject to government control and was thus able to accept for trade and listing all products (including forwards and options) and firms’ securities that did not comply with the Parquet’s rules. In particular, smaller, more recent, or foreign companies were more likely to have their securities listed on this market (Hautcoeur and Riva 2012). These aspects made the Coulisse a “most dynamic and innovative” financial market (Hautcoeur and Riva 2012), despite the fact it was legally forbidden for most of the 19th
century7. All of this made the Paris market a duopoly one, divided into a most important stock
exchange in terms of size and visibility, the Parquet, while a more smoothly regulated stock exchange, the Coulisse, ensured the trade of less visible and liquid securities.
A period of high asymmetry of information
The beginning of the 20th century is a period characterised by a high asymmetry of information
between the different firm agents (see Braggion and Moore 2011; Campbell and Turner 2011; Moortgat, Annaert, and Deloof 2017), including in France (Hautcoeur 1999; Herrigel 2008). The debates surrounding the governmental authorisation required to establish a corporation (société anonyme) well illustrate this phenomenon. The main concern before the release of this authorisation (in 1867 in France) was related to the limited liability of shareholders and to the possibility that the initiators of the corporation may set the firm up to engage in risky and non-controllable activities likely to make the subsequent and smaller investors lose their money.
5 See Bonhoure and Le Bris (2019) for more details.
6 It is true that about one third of the newly listed firms were so on the Lyon stock exchange. Nonetheless, these
firms were usually smaller in terms of size and most of them were listed on this provincial market for geographic-proximity reasons (Ducros 2018).
7 Even though it was forbidden, it was de facto tolerated, with more or less acceptance depending on the periods
The law of the 24th of July, 1867, that allowed free incorporation ensured little transparency
and mandatory disclosure of corporate (financial) information. Corporations only had to publish a balance sheet and an inventory of assets at each yearly GA of shareholders (Hautcoeur 1999)8.
This paved the way for strong agency issues between the firm agents (Hautcoeur 1999). These agency issues were particularly salient between minority and controlling (family and founders) shareholders. An increasing number of minority investors were likely to finance increasing firm capital needs, as the strong economic growth paved the way for firms to extend their business while the most notable activities of the 19th and beginning of the 20th century (like railways)
were less possible to finance through a small group of initial investors. Moreover, despite the growing importance of minority shareholders, separation of ownership and control was not fully achieved yet, especially in France (Cheffins 2008), with firm controllers (or insiders) who were often its main shareholders.
Such a context may call for alternative mechanisms to counterbalance this institutional asymmetry of information and to provide this lacking protection through “private contracts”9.
Among others, the statutory rule of distribution of profits may be considered to be a specific case of these private-contract mechanisms, and thus one way to reduce such asymmetry of information between firm controllers and its minority and smaller investors. Being statutory, it fixes the allocation made to shareholders and other corporate agents or items more transparently.
The statutory rule of distribution of profits
This dataset gave me access to a specific feature of corporate governance, which was in practice all over the 19th century and at the beginning of the 20th. Most firms listed on the Paris stock
exchanges (the Parquet and the Coulisse) had set up the distribution of their profits in a fixed manner every year. Although it was a common practice among firms listed on Paris markets, there was no legal obligation requiring that the allocation of all the profits to certain and predetermined corporate agents or items be stated ex ante. Such a rule was implemented and defined in corporate statutes (Maria 1906) and was then specific to the firm itself. Nonetheless, due to this statutory characteristic, this rule was supposed to be applied every year without being changed. Modifying it required to implement the usual processes necessary to statute modifications: calling for an extraordinary GA and collecting a pre-specified majority of votes. Few items were legally mandatory and included in this fixed rule. In particular, corporations (sociétés anonymes) had to set up a legal reserve to which they had to allocate at least 5% of their yearly profits. Once this legal reserve had reached up an amount equal to the tenth of the corporate capital, this obligation was released; but as soon as it went down below the 10%-capital level, the deductions of 5% of profits had to resume (Blanchenay 1935; Lemarchand 1994; Maria 1906). However, many companies went beyond this legal obligation, in particular by requiring in their statutory rule to set up reserves equal to more than a tenth of the capital. Broadly, the fixed rule of profit distribution specified how much of a firm’s yearly profits would be distributed to each of its agents or entities, beginning by shareholders and reserves but also including stakeholders as various as their board, founders, employees or top managers, etc10
8 The most notable improvement in the legally mandatory releases of corporate information was made through a
subsequent law, which imposed the release of a balance sheet prior to the firm stock IPO.
9 In the sense described by Acheson, Campbell, and Turner (2019).
10 In his handbook for new entrepreneurs, Paul Maria (1906) provides a quite complete list of the corporate agents
7
(Blanchenay 1935; Maria 1906). Specifically, allocations were made according to several levels of payments: first-level deductions were then primary on second-levels ones, which were primary on third-level ones, etc. Usually, on the first level, the reserve item received a percentage of firm profits, and shareholders had a percentage of the capital (taken on the firm overall profits) (the “share interest”). On the second and subsequent levels, percentages of remaining profits (after the first-level deductions) were typically allocated to the board, to shareholders again (as the “share dividend”), and to other stakeholders or items.11
One specificity and one difficulty in assessing this distribution rule are that not all amounts allocated to corporate agents were expressed as a percentage of profits. Share interests were indeed expressed as a percentage of the firm (paid) capital. Similarly for amortizing accounts (when considered), the amounts were often expressed as a percentage of the value of the goods to be amortized (building, furniture, etc).
Appendix 1 provides the rules of profit distribution for each of the historical CAC40 companies between 1906 and 1909. From them, one can observe both a common pattern in the template but also many exceptions to it, making the collection and examination of this governance feature even more difficult. In particular, several firms introduced some variability in their rule. For instance, they implemented in their statutes the possibility (and not the obligation) to allocate a part of their profits to additional reserves or contingency funds. This possibility and the percentage amount were usually supposed to be assessed by the GA of shareholders and/or by the board.
One specific point is the two-fold distribution made to shareholders. They were typically allocated (1) from the first level of profits a fixed percentage of the (paid) capital (the share interest or the first dividend), and (2) from the second or other levels a fixed percentage of the profits remaining after many other deductions (the dividend or the second dividend). This specific distribution pattern for shareholders was common at the time. The distinction between shares and bonds was indeed not clear: shares were more or less regarded as a specific type of bond whose only difference with bonds was the payout of interest for an indefinite maturity (Lemarchand 1994; Praquin 2012; Preinreich 1932; Rutterford 2004)12. Nonetheless, such a
payment expressed as a percentage of the capital raised an issue depending on the profits made by the firm. If the interest was lower than the profits, then it was deducted from these profits. However, if it was higher than the firm profits, it may be regarded as a “breach in the corporate capital” (Blanchenay 1935; Lemarchand 1994). In the last case, several legal mechanisms ensured that the capital would not be unduly reduced13. Such a “breach” in the capital was
indeed legally forbidden: by law, firm agents were not able to make deductions on the corporate capital (the jurisprudence going into the same direction – see Blanchenay 1935 for examples).14
Overall, this two-fold allocation made to shareholders resulted in the fact that the total amount they received (interest and dividend) was not a linear function of profits. As a consequence, it is important to keep in mind that an EDPR figure is valid for a certain amount of profits.
reserves, “operational” amortizing (including building and furniture amortizing), share amortizing, dividends (namely again shareholders), managers, founders (through their founders’ shares).
11 I have coded this rule following the coding process implemented within the DFIH Equipex (PSE – Paris School
of Economics). The DFIH database results from a project designed to collect and treat data about the firms listed on both Paris stock exchanges between 1796 and 1976 (see its website: https://dfih.fr).
12 The distinction was even harder to make insofar as (i) shares may also have had a limited lifetime (until company
expiration), and (ii) some bonds also had a non-finite maturity (government bonds such as “rente perpétuelle”) (Shannon 1933).
13 These mechanisms have been developed in several steps from the beginning of the 19th century (see Lemarchand
1994).
14 In practice, when the amount of profits was below the amount of share interests, shareholders only received the
III. Data and Methodology
Sources, variables, and preliminary descriptive statistics
I extracted my data from a hand-collected database of firms listed on both Paris stock exchanges from 1906 to 1909. This database is more specifically described in Bonhoure, Germain, and Le Bris (2017), and Bonhoure and Le Bris (2019).
Briefly, I was able to collect these data using the yearbooks published for each stock exchange: the Annuaire des valeurs admises à la cote officielle15 published for the Parquet, and the
Annuaire Desfossés16 published for the Coulisse. These yearbooks display many characteristics
of the companies listed on the above markets: their capital structure, their sector, and a detailed description of their activities and their location, governance features (voting right schemes, composition of the board) including the statutory rule of allocation of profits, etc. They also sort these companies according to their sector. Importantly, they constitute the main source of
actual dividend data.
In addition to this main source set, I also used additional data (in particular to have access to corporate profit amounts) provided by the DFIH Equipex (Data for Financial History Equipment of Excellence) on their website. I took from this website dividend data that were missing from the main source as well as most of the profit amounts. When, for a given firm, this amount was not available, I took as its profits in year t the weighted average profits of the sector in year t. Specifically, I calculated the average profits made by the firms of a given sector, weighted by the market capitalisation of each firm in this sector17.
I focus the examination on the French 40 largest ones in terms of market capitalisation (historical CAC40 firms) each year between 1906 and 1909 (see Appendix 2 for a list of these companies). The first reason for examining the largest firms is that they represented the most important part of Paris markets. Another reason is that, though the statutory rule of distribution of profits follows a similar trend from one firm to another, it bears many exceptions that prevent any automatic process to compute estimate the total amount of dividends promised to shareholders.
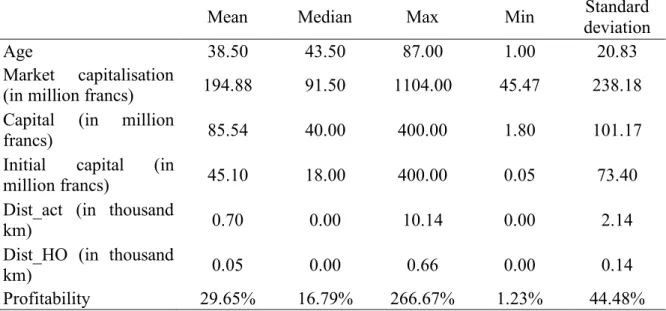
Historical CAC40 companies display characteristics that are consistent with their large market capitalisation and the related more established situation (Table 1 and Table 2). First, despite the youngest company that was one year old, they were on average almost 40 years old. Second, most of these firms operated in France (on average, their activities were located 700 km away from Paris). They had their headquarters in France, but more specifically in Paris (for at least 50% of them – see the median of the dist_HO variable) or very close to Paris (see its average). Third, the most represented sectors in the sample are the most mature ones of the time, namely bank and insurance along with railways. Several utilities (10% of the sample) are also part of the largest market capitalisations. This may be related to the very large concessions granted to these companies by state or city administrations that contributed to their growth. Fourth, most historical CAC40 firms were listed on the official stock exchange, only 2.5% of them being on the Coulisse. Fifth, most of them did not operate in sectors of the 2nd Industrial Revolution,
15 For instance, the 1908 edition (for information about 1907). 16 For instance, the 1909 edition (for 1907 as well).
17 The reason why weighing the average profit by the market capitalisation is to avoid downward biases in this
average. For instance, I had no access to the 1907 profits of the Paris à Lyon à la Méditerranée (PLM) railways, and taking the simple average profits of the railway sector (also dependent on the profits made by smaller railway companies) would have provided a too low amount of profits with regard to PLM market capitalisation and to its peers.
9
which is consistent with the prevalence of bank and railway companies. Nevertheless, there is a non-negligible proportion (more than 10%) of such “new businesses”.
Appendix 3 displays the same descriptive statistics for each year of the study.
Table 1: Descriptive statistics of historical CAC40 firms
Mean Median Max Min
Standard deviation
Age 38.50 43.50 87.00 1.00 20.83
Market capitalisation
(in million francs) 194.88 91.50 1104.00 45.47 238.18 Capital (in million
francs) 85.54 40.00 400.00 1.80 101.17
Initial capital (in
million francs) 45.10 18.00 400.00 0.05 73.40
Dist_act (in thousand
km) 0.70 0.00 10.14 0.00 2.14
Dist_HO (in thousand
km) 0.05 0.00 0.66 0.00 0.14
Profitability 29.65% 16.79% 266.67% 1.23% 44.48%
Note: This table displays some of the descriptive statistics for the historical CAC40 companies. Market capitalisation and capital are the figures for the beginning of the year (for instance, 1906 market capitalisation is the market capitalisation as of beginning-1906). Initial capital is the capital of the firm when it was founded. Dist_act is the distance between Paris and the place where most activities of the firm are located; dist_HO is the distance between Paris and the firm headquarters. Profitability is the ratio of firm profits over firm capital. For each of these variables, the number of observations is 160.
Table 2: Sectors and stock exchanges of historical CAC40 firms
Number Proportion Number Proportion
Banks and insurance 50 31.25% Parquet 156 97.50% Railways 35 21.88% Coulisse 4 2.50% Coal 9 5.63% Total 160 100% Other mines 11 6.88% Metal industry 23 14.38% Number Proportion Utilities 17 10.63% 2IR 18 11.25%
Other industries 15 9.38% non-2IR 142 88.75%
Total 160 100% Total 160 100%
Note: The first set displays the number of historical CAC40 companies that are in a given sector; the railway sector includes tramway companies. The second set presents the number of companies in each of the Paris stock exchanges. The third set presents the number of 2IR versus non-2IR companies (namely the companies that operated in sectors of the 2nd Industrial Revolution or not).
Expected DPRs: calculation process
Because of the length of the process, I focus on the 40 largest French market capitalisations displaying a fixed rule of distribution of profits. These firms represented a large portion of the firms (in particular the French ones) listed on Paris markets. However, results may be biased towards large and old firms and certain sectors (especially banking and railways). Companies may implement changes in this statutory rule over their lifetime to fit better to their changing situation or environment, and to compensate different types of stakeholders according to their size, age, etc.
To compute EDPRs, I had to proceed in several steps18. For the first step, I had to find out
different pieces of information to compute it, in particular, the amount of reserves (in case of the allocation to the reserves stopped when they reached a certain level) and of the firm (paid) capital (to estimate the share interests).
I then went through the second step. This step is essentially due to the variability sometimes allowed by the rule. I considered several possibilities (hereafter denominated as “cases”). Several (but non-exhaustive) examples of such hypotheses follow.
• The first example is related to the firms that included in their rule allocations of a part of their profits, whose precise amount was to be determined (TBD). Here, I considered two (or three) hypotheses: (i) when the amount allocated was relatively high (between 60% and 90% of the remaining profits), and (ii) when this amount was much lower (between 30% and 50% of the remaining profits).
• The second one is due to the part of profits allocated by most railways to a share-amortizing account. The amount of this deduction was not specified; the only specification about it was that all shares had to be amortized by a certain date (usually the concession expiration date). Given the nominal value, the number of shares, and the concession expiration date, I calculated the yearly average amount the firm had to pay for share amortizing to meet the specification above. I considered two cases: (i) when the company paid this yearly amount out of profits for share amortizing, and (ii) when it did not.
• The last example is that some rules also allowed optional deductions for certain items (typically special reserves, contingency funds, etc), whose amount again had to be determined. I treated this case the same way as the TBD allocation amounts adding one more hypothesis: (iii) when there was no deduction at all (namely 0% of remaining profits).
Given all these hypotheses, this ended up, for a given firm, with several “cases” (from 1 up to 12 different “cases”), ranging from the worst to the best ones from shareholders’ perspective. The worst case (for shareholders) was thus when many other deductions were made besides the one for shareholders (typically cases when reserves had not reached their minimal threshold, when there was a deduction for share amortizing, when optional deduction was the highest possible, etc). Symmetrically, the best-case scenario occurred when most of the profits went to shareholders.
The third step consisted in computing the EDPRs paid to shareholders in year t for each of these “cases”. Formally, for a given “case”, the EDPR of firm i in year t is given by:
18 This process is the most general one; it is the process for the common pattern of profit distribution (namely a
percentage of profits for reserves and a percentage of the capital as the share interests; on the remaining profits, if so, a percentage to the board and a percentage as the share dividend). Adjustments have been necessary for each rule.
11
𝐸𝐷𝑃𝑅%,' =𝑎𝑚𝑜𝑢𝑛𝑡 𝑝𝑎𝑖𝑑 𝑡𝑜 𝑠ℎ𝑎𝑟𝑒ℎ𝑜𝑙𝑑𝑒𝑟𝑠% 𝑝𝑟𝑜𝑓𝑖𝑡𝑠%,'
So, I first calculated the aggregate amount distributed to shareholders (including both share interest and dividends) given the firm profits of year t. Then, I computed the ratio of this aggregate amount over profits of year t.
Appendix 5 provides an example (the Aciéries de Longwy) of this calculation process that may help understand the process.
Expected and actual DPRs: preliminary statistics
Table 3 displays the summary statistics for both the expected and actual DPRs. It should be noted that in the case of EDPR, one has three different measures: the worst and the best EDPRs (as defined in section III-B and Appendix 5), and the average EDPR which is just the average of the worst and best ones.
Appendix 6 displays the mean DPRs sorted according to several categories.
Table 3: Summary statistics of expected and actual DPRs
Mean Median Max Min
Standard deviation ADPR 71.40% 78.29% 302.01% 0.00% 34.26% Worst EDPR 58.47% 50.50% 100.00% 5.00% 27.97% Best EDPR 90.44% 92.42% 100.00% 64.89% 8.39% Average EDPR 74.46% 71.39% 100.00% 39.43% 15.66%
Note: For each of these variables, the number of observations is 160.
ADPRs are on average relatively high (more than 70%), comparable to current ratios if not
higher. However, there is some variability as displayed by the standard deviation of this variable, and the large gap between the minimum and the maximum points. The very high maximum should be noticed: some companies seem to have distributed more than the profits they made on certain years.
On the same vein, the EDPRs, or the dividends “promised” to shareholders, were relatively high as well. If on average, shareholders could expect almost all the profits at best, they could also expect to obtain, at worst, no less than half of them. However, the worst EDPR is more variable across firms than the best one. At worst, shareholders were indeed paid, on average, half of the profits, but with a standard deviation of almost 30%.
The comparison of ADPR and EDPR figures provides a first insight into the main question addressed in this paper. It seems that shareholders obtained (in terms of dividends) something consistent with what they could expect from the rule. The ADPR is very close on average to the
average EDPR, being larger than the worst EDPR and lower than the best one. Sections IV and
V provide a clearer assessment of the difference between actual and expected DPRs.
It should be noted that, in this sample of historical CAC40 firms, examples of ADPRs equal to 0% are very rare. In other words, almost all firms paid a dividend to their shareholders. The exception is for one only firm, the Société financière franco-américaine, which is part of the historical CAC40 from 1906 to 1908. It paid no dividend (ADPR = 0%) in 1906 and 1907 and started paying out from 1908. The explanation for that is related to its recent foundation (in 1905): the company was then one (two) year(s) old in 1906 (1907).
Overall, this point is consistent with the literature on dividend payments and in particular on the agency explanation of dividends (Allen and Michaely 2003; Bonhoure et al. 2017) which
states that larger, more mature firms and those with fewer investment opportunities are more likely to pay (large) dividends (Denis and Osobov 2008; Fama and French 2001; Lang and Litzenberger 1989).
IV. The Expected DPRs: Determinants and Comparison
To assess whether companies implemented the statutory rule to decrease agency issues between shareholders and controllers, the first step is to explore the payments promised to the former, namely EDPRs. Accordingly, this section first aims at examining whether they are driven by some characteristics that also increase agency issues. Additionally, it will examine whether the dividends actually paid out to shareholders fit the amounts promised to them.
The determinants of EDPRs
The first question addressed here concerns the determinants of EDPRs. I hypothesize that the statutory rule of profit allocation may be a solution to agency issues. As the part of profits distributed to the principal (here shareholders) is fixed ex ante, it would prevent the agent (firm controllers) from deviating too much cash at the expense of the former. And if a firm is more exposed to such misbehaviour (in other words if it has more severe agency issues), one could expect that it set higher EDPRs in its rule.
Literature has shown that agency issues within companies tend to increase with certain corporate characteristics such as age, size, investment opportunities, or distance. The proxy of agency costs by such measures of corporate characteristics is widely used in academic literature (see for instance studies on the agency explanation of dividends like John et al. 2011; Lang and Litzenberger 1989).
Agency issues are, for instance, more severe within older and/or larger firms (Lang and Litzenberger 1989). One could thus expect EDPRs to increase as firms become older and larger. On the contrary, firms that benefit from more investment opportunities have less room for agency issues: they should thus promise a lower EDPR to their shareholders (Lang and Litzenberger 1989). This may be particularly the case of 2IR firms, which at the time operated in novel and “promising” sectors calling for more and more investments (Bonhoure and Le Bris 2019). On the same vein, should firm activities (respectively head office) be located further, this would be more difficult for shareholders to monitor ex post (respectively ex ante) firm insiders like managers (Bonhoure et al. 2017). The promised dividends, or EDPRs, should thus be higher when these distances increase.
The hypotheses regarding Coulisse- versus Parquet-listed firms are more mixed. On the one hand, the former is shown to be, on average, lower, and younger than the latter (Hautcoeur and Riva 2012). They may have less severe agency issues and thus fix lower EDPRs through their statutory rule. On the other hand, they may be listed on the Coulisse because they did not comply with Parquet “listing rules”19 because they operated in relatively more recent sectors.
In one word these firms may be more opaque and pave more ground for agency issues. So, they may promise higher payments as a signal to reassure and attract (potential) shareholders. I conduct a regression analysis to assess whether EDPRs were significantly correlated with several of the above corporate characteristics. Table 4 and Table 5 show the results for the upper
19 To be listed on the Parquet, firms were required to meet few standards (imposed by both the government and
the Parquet governing body itself). On the contrary, being listed on the Coulisse required to meet no specific condition: a firm was listed on this stock exchange when its securities were considered by the Coulisse brokers to be interesting to trade (Bonhoure and Le Bris 2019; Ducros 2018).
13
and the lower bound of EDPRs respectively (the results on the average EDPRs are displayed in Appendix 7, Table 25).
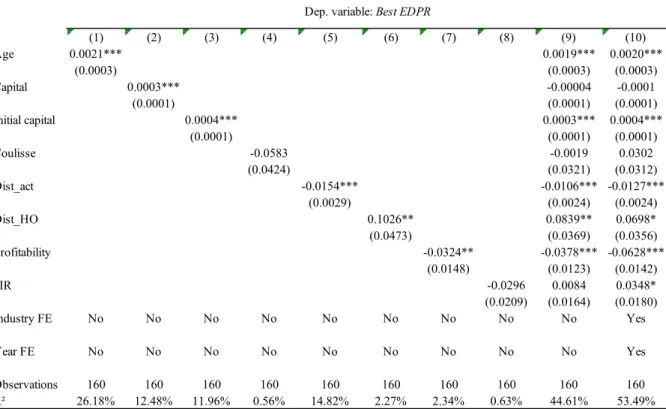
Table 4: Determinants of best EDPRs
(1) (2) (3) (4) (5) (6) (7) (8) (9) (10) Age 0.0021*** 0.0019*** 0.0020*** (0.0003) (0.0003) (0.0003) Capital 0.0003*** -0.00004 -0.0001 (0.0001) (0.0001) (0.0001) Initial capital 0.0004*** 0.0003*** 0.0004*** (0.0001) (0.0001) (0.0001) Coulisse -0.0583 -0.0019 0.0302 (0.0424) (0.0321) (0.0312) Dist_act -0.0154*** -0.0106*** -0.0127*** (0.0029) (0.0024) (0.0024) Dist_HO 0.1026** 0.0839** 0.0698* (0.0473) (0.0369) (0.0356) Profitability -0.0324** -0.0378*** -0.0628*** (0.0148) (0.0123) (0.0142) 2IR -0.0296 0.0084 0.0348* (0.0209) (0.0164) (0.0180) Industry FE No No No No No No No No No Yes Year FE No No No No No No No No No Yes Observations 160 160 160 160 160 160 160 160 160 160 R² 26.18% 12.48% 11.96% 0.56% 14.82% 2.27% 2.34% 0.63% 44.61% 53.49%
Dep. variable: Best EDPR
Note: Heteroskedasticity-robust standard errors are reported in parentheses. *** Significant at the 1 percent level, ** Significant at the 5 percent level and * Significant at the 10 percent level. Capital and initial capital are in million francs; dist_act and dist_HO are in thousand km.
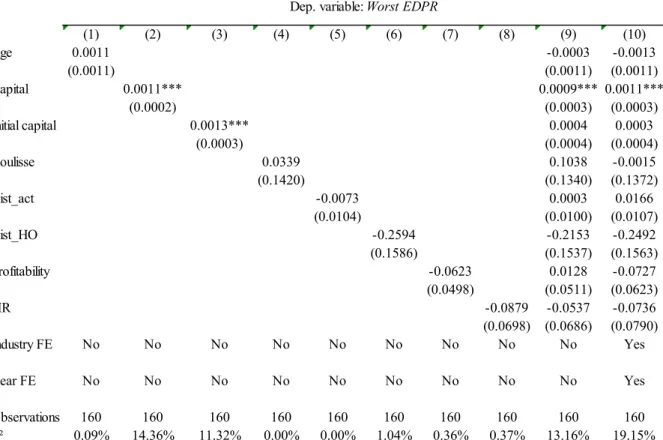
Table 5: Determinants of worst EDPRs
From the above tables, one can draw two sets of conclusions. While the best EDPR is driven by several corporate characteristics, it is not the case for the worst one which is only related to the “current” size of firms (current capital). In other words, when firms implement their statutory rule, they seem to signal their good quality (namely how they solve agency issues) mostly through the largest payment which is promised to shareholders, best EDPR.
More specifically, the relationship between best EDPR and most corporate characteristics is consistent with an agency assessment of the statutory rule (Table 4). Older and larger firms do promise larger best EDPRs to their shareholders, as well as firms whose headquarters are located further away from Paris. The size effect is notable: a one-standard-deviation increase in age (20.83 years), or in initial capital (73.40 million francs) is associated with an increase of 4% or 3% (respectively) in the best EDPRs promised to shareholders. Firms with larger profitability (thus potentially with more growth opportunities) conversely promise smaller (best) payments to their investors. Again, a one-standard-deviation increase in profitability is associated with a 3% decrease in best EDPRs. One thing that should be noticed is that if both size measures (capital and initial capital) are positive and significant (Columns 2 and 3), this significance does not hold for the first one in the last specifications (Columns 9 and 10). In other words, the size does matter in the assessment of best EDPRs, but what matters most is the “initial” size of firms. Conversely, best EDPRs are driven on a counterintuitive way by the distance between Paris and firm activities: the relationship between both variables is indeed
(1) (2) (3) (4) (5) (6) (7) (8) (9) (10) Age 0.0011 -0.0003 -0.0013 (0.0011) (0.0011) (0.0011) Capital 0.0011*** 0.0009*** 0.0011*** (0.0002) (0.0003) (0.0003) Initial capital 0.0013*** 0.0004 0.0003 (0.0003) (0.0004) (0.0004) Coulisse 0.0339 0.1038 -0.0015 (0.1420) (0.1340) (0.1372) Dist_act -0.0073 0.0003 0.0166 (0.0104) (0.0100) (0.0107) Dist_HO -0.2594 -0.2153 -0.2492 (0.1586) (0.1537) (0.1563) Profitability -0.0623 0.0128 -0.0727 (0.0498) (0.0511) (0.0623) 2IR -0.0879 -0.0537 -0.0736 (0.0698) (0.0686) (0.0790) Industry FE No No No No No No No No No Yes Year FE No No No No No No No No No Yes Observations 160 160 160 160 160 160 160 160 160 160 R² 0.09% 14.36% 11.32% 0.00% 0.00% 1.04% 0.36% 0.37% 13.16% 19.15%
Dep. variable: Worst EDPR
Note: Heteroskedasticity-robust standard errors are reported in parentheses. *** Significant at the 1 percent level, ** Significant at the 5 percent level and * Significant at the 10 percent level. Capital and initial capital are in million francs; dist_act and dist_HO are in thousand km.
15
negative (and significant)20. Overall, the high R2 (especially in Columns 9 and 10) should be
highlighted: this model seems to accurately describe best EDPRs.
On the contrary, the worst EDPRs is modeled only by one variable: current capital (Table 5). Nonetheless, the effect is still sizeable: a one-standard-deviation increase in capital is indeed correlated with an increase of 11% in worst EDPRs. This suggests that for larger firms, shareholders could expect, at worst, 11% additional percentage points of firm profits. In this sense, worst EDPRs may be a complement to best EDPRs, with the latter being fixed first and the former fixed accordingly.
However, the statutory rule of profit allocation did not change regularly (especially not yearly): the observed variations in EDPR may thus simply due to changes in corporate profits. Doing a panel analysis may thus simply consist in doing a similar analysis for the four years of the sample. I thus conduct the same tests as above but on year subsamples (Appendix 7, Table 26, Table 27, and Table 28). The number of observations in each specification largely decreases; results remain consistent with the above.
Comparison with ADPRs
If now the potential drivers of EDPRs are clearer, what about the actual payments? Did they fit what shareholders could expect from EDPRs, namely from the statutory rule? In this section, I explore whether these actual payments (ADPRs) were similar, on average, to what shareholders could expect to; and in particular, whether they were close to the largest payments (best EDPRs) promised to investors, or whether these investors had less (namely something close to worst
EDPRs).
The possibility of “expecting” certain levels of DPRs allows one to assess by how much controlling agents of the firm cheated other shareholders. On the one hand, if shareholders received an ADPR close to the worst EDPR, this may mean that controlling agents take advantage of their position to extract some of the firm’s profits and allocate them to other items or agents. Set differently, this may be the clue of higher agency conflicts between controlling and minority shareholders. If, on the other hand, shareholders earned an ADPR close to the best
EDPR, this may provide evidence of a non-cheating behaviour of controlling shareholders. As
a whole, a large expected-minus-actual DPR difference would provide evidence of high agency conflicts between both types of agents.
To explore this question, I perform a univariate analysis of the EDPR-ADPR difference. Table 6 displays the results.
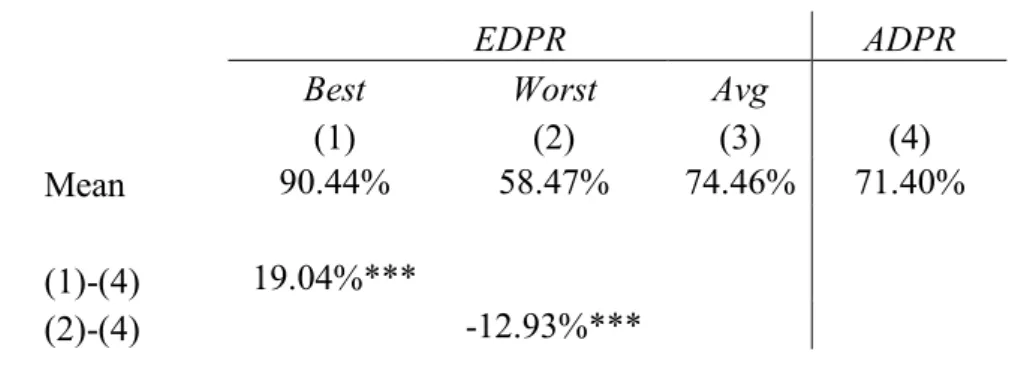
Table 6: EDPR-ADPR - Difference in means
EDPR ADPR
Best Worst Avg
(1) (2) (3) (4) Mean 90.44% 58.47% 74.46% 71.40% (1)-(4) 19.04%*** (2)-(4) -12.93%***
20 One explanation could be related to the sample itself. I only consider historical CAC40 firms: most of them had
their activities located either in Paris or elsewhere in France, namely in areas already well connected to Paris (and their shareholders). Focusing on such firms could thus mitigate dist_act as a measure of agency issues.
(3)-(4) 3.05%
Note: *** Significant at the 1-percent level, ** Significant at the 5-percent level, and * Significant at the 10-percent level. In all cases, there are 160 observations.
On the one hand, worst EDPR is significantly (at the 1% level) lower than ADPR. Shareholders earned a higher part of firm profits compared to what they could expect to, at worst. On the other hand, best EDPR is significantly higher (again at the 1% level) than the ADPR. This overall means that, if shareholders did earn a larger part of profits than expected at worst, they did not earn a part of profits as high as they could expect in the best case, suggesting that controllers did not take too much advantage of the variability in the statutory rule.
This result is confirmed by the last specification. Average EDPR is indeed not significantly different (on average) from the actual payments, further suggesting that shareholders had something between the worst and the best cases.
Overall, it seems that EDPRs (in particular the upper bound) were set such as they could compensate shareholders for the higher agency conflicts arising within specific firms. They somehow provided a signal to these (potential) investors on what the firm did to solve these issues. And it seems to work, as, if controlling agents of the firm took advantage of their position to extract some private benefits at the expense of other shareholders, they did so in a limited way and did not deviate too much from promised dividends. Investors did have actual dividends consistent with the average dividends they could expect by observing ex ante the statutory rule.
V. The EDPR – ADPR Gap
A further way to examine whether the statutory rule was efficient in compensating for agency issues is to study the EDPR-ADPR gap. Specifically, should it be the case, firms suffering from higher agency issues should not exhibit a larger EDPR-ADPR difference than other firms21. Set
differently, they should not cheat more their shareholders than other companies, by distributing them ADPRs that are lower than EDPRs to a higher extent.
As detailed above, firms with higher agency issues are those which are larger, older, with fewer investment opportunities, whose activities and head office are located further than the others from Paris, etc. Consequently, the hypothesis is that these firms should have an EDPR-ADPR gap not significantly different from (or even lower than) the gap exhibited by other firms.
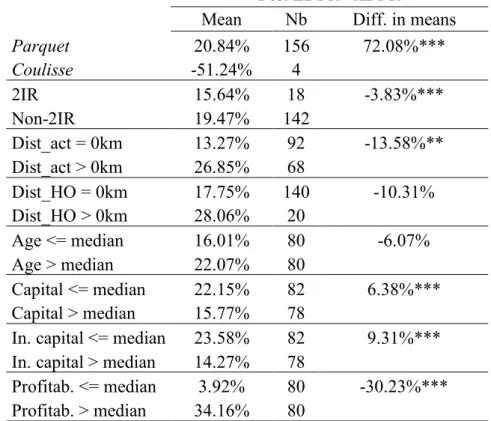
Univariate analysis
I first study the difference in the means of EDPR-ADPR gaps across several sets of firms (Table 7 and Table 8). For instance, in Table 7 and the first sample, I test whether the best
21 Again, the EDPR-ADPR difference may provide a measure of the agency issues within a given firm; the larger
this difference, the more severe these agency issues. And this is the case whether one considers best or worst EDPR minus ADPR. One, tough, must pay attention to the sign of the difference. The best EDPR-ADPR gap is likely to be positive as most firms are expected to actually distribute less than what they promised, in the best case, to their investors. If this difference decreases so much that it becomes negative, this may mean that agency issues are literally non-existent as the company distributes more than promised at best. The reverse is at play for the worst
EDPR-ADPR difference. Similarly, the more it increases, the more severe agency issues; but this gap should be
negative. Indeed, firms should distribute actual dividends at least equal to what they promise at worst (worst
EDPR). If this difference increases to the point that it becomes positive, it will mean that they conversely distribute
17
ADPR mean for firms listed on the Parquet is significantly different from the best EDPR-ADPR
mean of firms listed on the Coulisse.
Table 7: Determinants of the best EDPR - ADPR difference (univariate analysis) Best EDPR - ADPR
Mean Nb Diff. in means
Parquet 20.84% 156 72.08%*** Coulisse -51.24% 4 2IR 15.64% 18 -3.83%*** Non-2IR 19.47% 142 Dist_act = 0km 13.27% 92 -13.58%** Dist_act > 0km 26.85% 68 Dist_HO = 0km 17.75% 140 -10.31% Dist_HO > 0km 28.06% 20 Age <= median 16.01% 80 -6.07% Age > median 22.07% 80 Capital <= median 22.15% 82 6.38%*** Capital > median 15.77% 78
In. capital <= median 23.58% 82 9.31%*** In. capital > median 14.27% 78
Profitab. <= median 3.92% 80 -30.23%*** Profitab. > median 34.16% 80
Note: *** Significant at the 1-percent level, ** Significant at the 5-percent level, and * Significant at the 10-percent level. The "Nb" column displays the number of observations in each subsample; "In. Capital" stands for initial capital, "profitab." for profitability. Median age is 43.5 years; median capital is 40 million francs; the median initial capital is 18 million francs; median profitability is 16.78%.
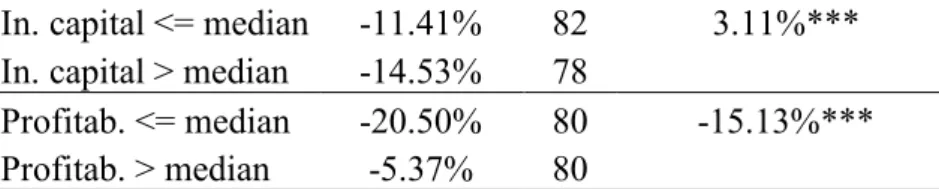
Table 8: Determinants of the worst EDPR - ADPR difference (univariate analysis) Worst EDPR - ADPR
Mean Nb Diff. in means
Parquet -11.36% 156 62.86%*** Coulisse -74.22% 4 2IR -21.51% 18 -9.66% Non-2IR -11.84% 142 Dist_act = 0km -15.79% 92 -6.72%*** Dist_act > 0km -9.07% 68 Dist_HO = 0km -12.43% 140 3.98%*** Dist_HO > 0km -16.41% 20 Age <= median -15.28% 80 -4.70%*** Age > median -10.58% 80 Capital <= median -14.01% 82 -2.22%*** Capital > median -11.79% 78
In. capital <= median -11.41% 82 3.11%*** In. capital > median -14.53% 78
Profitab. <= median -20.50% 80 -15.13%*** Profitab. > median -5.37% 80
Note: *** Significant at the 1-percent level, ** Significant at the 5-percent level, and * Significant at the 10-percent level. The "Nb" column displays the number of observations in each subsample; "In. Capital" stands for initial capital, "profitab." for profitability. Median age is 43.5 years; median capital is 40 million francs; the median initial capital is 18 million francs; median profitability is 16.78%.
The difference-in-mean analysis shows that they are indeed differences across firms on their
EDPR-ADPR gap. And these differences are overall consistent with the potential efficiency of
the rule in mitigating agency costs. Firms that are older or whose head office is further from their shareholders do not exhibit a significantly different best EDPR-ADPR gap. Further, the firms that are larger and with fewer investment opportunities (namely with lower profitability) have a significantly lower best EDPR-ADPR difference than the others (Table 7). In other words, their ADPR is lower than the best EDPR to a lesser extent than the one of firms that are smaller or with more investment opportunities22.
Similarly, companies that are initially larger (whose initial capital is above the median), with fewer investment opportunities, and whose head office is further from Paris exhibit a significantly lower worst EDPR-ADPR difference (Table 8).
Several subsamples provide results that are not consistent with the agency explanation and the efficiency of the statutory rule. First, non-2IR firms (that should be more mature, with fewer growth opportunities) have significantly larger best EDPR-ADPR differences. Second, companies whose activities are further from shareholders also exhibit a larger (best and worst)
EDPR-ADPR gap. Third, currently larger firms (larger current capital) have a larger worst EDPR-ADPR difference. All this suggests that further (and multivariate) analysis is needed, to
assess whether these results hold when controlling for other effects.
Results are relatively similar to the above when one focuses on the average EDPR-ADPR difference (Appendix 8, Table 29).
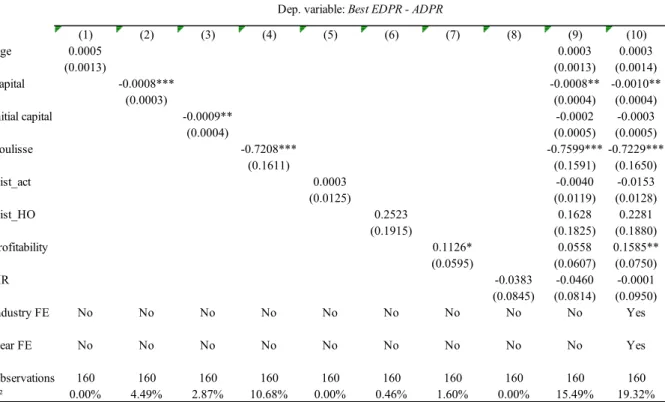
Multivariate analysis
The univariate analysis highlights large differences across firms in the EDPR-ADPR gap. Conclusions are clearer and even more consistent with the rule efficiency when one models this gap using a multivariate model.
Table 9 displays the results for the best EDPR-ADPR difference. Older firms, whose activities and head office are located further from Paris, and do not operate in 2IR sectors do not exhibit a best EDPR-ADPR gap significantly different from the others. Further, this gap is significantly lower for firms that have a larger capital and fewer investment opportunities, suggesting that the rule was so efficient in mitigating agency conflicts that these firms’ controllers cheated less their shareholders than in other firms. The Coulisse dummy provides a result that is more consistent with the view of more opaque firms listed on this stock exchange.
22 For instance, smaller companies (those whose capital is below the median capital) have a best EDPR larger than
ADPR by 22.15%. Larger ones (whose capital is above the median) also have a best EDPR larger than ADPR, but
19
Table 10 shows the results for the worst EDPR-ADPR difference. Again, when considered all together, only the Coulisse dummy and profitability have a significant (at the 1% and 10% levels respectively) impact on the worst EDPR-ADPR gap.
Altogether, these results again suggest that the higher importance of the upper bound of the
EDPR range in mitigating agency issues. The worst EDPR may be set in a second step, as a
mere complement to the best one; another explanation may be that this lower bound was set for another purpose.
Table 9: Determinants of the best EDPR - ADPR difference (multivariate analysis)
(1) (2) (3) (4) (5) (6) (7) (8) (9) (10) Age 0.0005 0.0003 0.0003 (0.0013) (0.0013) (0.0014) Capital -0.0008*** -0.0008** -0.0010** (0.0003) (0.0004) (0.0004) Initial capital -0.0009** -0.0002 -0.0003 (0.0004) (0.0005) (0.0005) Coulisse -0.7208*** -0.7599*** -0.7229*** (0.1611) (0.1591) (0.1650) Dist_act 0.0003 -0.0040 -0.0153 (0.0125) (0.0119) (0.0128) Dist_HO 0.2523 0.1628 0.2281 (0.1915) (0.1825) (0.1880) Profitability 0.1126* 0.0558 0.1585** (0.0595) (0.0607) (0.0750) 2IR -0.0383 -0.0460 -0.0001 (0.0845) (0.0814) (0.0950) Industry FE No No No No No No No No No Yes Year FE No No No No No No No No No Yes Observations 160 160 160 160 160 160 160 160 160 160 R² 0.00% 4.49% 2.87% 10.68% 0.00% 0.46% 1.60% 0.00% 15.49% 19.32%
Dep. variable: Best EDPR - ADPR
Note: Heteroskedasticity-robust standard errors are reported in parentheses. *** Significant at the 1 percent level, ** Significant at the 5 percent level and * Significant at the 10 percent level. Capital and initial capital are in million francs; dist_act and dist_HO are in thousand km.
Table 10: Determinants of the worst EDPR - ADPR difference (multivariate analysis)
VI. Conclusion
The statutory rule of profit allocation is a governance mechanism that sets the distribution of corporate profits to specific agents or items in the firm statutes. During the whole 19th and at
the beginning of the 20th century, it was widespread among French firms but also elsewhere.
Contrary to the solutions already offered to practitioners to deal with agency issues companies face, this one would allow us to solve several of these issues at the same time.
In this study, I show that this mechanism is indeed capable of for the agency issues firms suffered from. By making the dividend distribution ex ante observable and predictable, it somehow provided “private” protection to shareholders, what they lacked from a legal one. In particular, the promised dividends (EDPRs) were set such as they were higher in firms likely to suffer from more severe agency issues (like larger or older ones).
And it seems this mechanism was relatively efficient in protecting shareholders from firm controllers. First, shareholders received actual dividends consistent with what they could expect on average from the rule. Set differently, they received something between the worst and the
best EDPR. Second, firms with more severe agency issues exhibit an EDPR-ADPR gap not
significantly different from (and sometimes even lower than) the others.
This study is a first step to further work on this governance feature, very uncommon by current standards. In particular, it may also benefit from an examination of what was promised to other stakeholders. The idea would be to assess whether this rule of profit allocation was set to mitigate other types of agency relationships (for instance between share- and debtholders, between controllers and employees…).
One should also consider the other explanations at play. Earning manipulation may pave the ground for additional agency issues potentially missed by the statutory rule. The allocations
(1) (2) (3) (4) (5) (6) (7) (8) (9) (10) Age -0.0004 -0.0019 -0.0031 (0.0014) (0.0015) (0.0015) Capital 0.00002 0.0001 0.0002 (0.0003) (0.0004) (0.0005) Initial capital 0.0001 0.0000 -0.0003 (0.0004) (0.0006) (0.0006) Coulisse -0.6286*** -0.6541*** -0.7546*** (0.1763) (0.1799) (0.1880) Dist_act 0.0084 0.0069 0.0140 (0.0134) (0.0135) (0.0146) Dist_HO -0.1096 -0.1363 -0.0909 (0.2061) (0.2064) (0.2142) Profitability 0.0828 0.1065 0.1486* (0.0642) (0.0686) (0.0854) 2IR -0.0966 -0.1082 -0.1084 (0.0902) (0.0921) (0.1083) Industry FE No No No No No No No No No Yes Year FE No No No No No No No No No Yes Observations 160 160 160 160 160 160 160 160 160 160 R² 0.00% 0.00% 0.00% 6.86% 0.00% 0.00% 0.42% 0.09% 5.87% 8.76%
Dep. variable: Worst EDPR - ADPR
Note: Heteroskedasticity-robust standard errors are reported in parentheses. *** Significant at the 1 percent level, ** Significant at the 5 percent level and * Significant at the 10 percent level. Capital and initial capital are in million francs; dist_act and dist_HO are in thousand km.