HAL Id: pasteur-01967232
https://hal-pasteur.archives-ouvertes.fr/pasteur-01967232
Submitted on 30 Dec 2018
HAL is a multi-disciplinary open access
archive for the deposit and dissemination of
sci-entific research documents, whether they are
pub-lished or not. The documents may come from
teaching and research institutions in France or
abroad, or from public or private research centers.
L’archive ouverte pluridisciplinaire HAL, est
destinée au dépôt et à la diffusion de documents
scientifiques de niveau recherche, publiés ou non,
émanant des établissements d’enseignement et de
recherche français ou étrangers, des laboratoires
publics ou privés.
Distributed under a Creative Commons Attribution| 4.0 International License
validate stratification biomarkers for autism spectrum
disorders
Eva Loth, Tony Charman, Luke Mason, Julian Tillmann, Emily Jones,
Caroline Wooldridge, Jumana Ahmad, Bonnie Auyeung, Claudia Brogna, Sara
Ambrosino, et al.
To cite this version:
Eva Loth, Tony Charman, Luke Mason, Julian Tillmann, Emily Jones, et al.. The EU-AIMS
Longi-tudinal European Autism Project (LEAP): design and methodologies to identify and validate
strati-fication biomarkers for autism spectrum disorders. Molecular Autism, BioMed Central, 2017, 8 (24),
�10.1186/s13229-017-0146-8�. �pasteur-01967232�
R E S E A R C H
Open Access
The EU-AIMS Longitudinal European Autism
Project (LEAP): design and methodologies
to identify and validate stratification
biomarkers for autism spectrum disorders
Eva Loth
1,2*, Tony Charman
3, Luke Mason
4, Julian Tillmann
3, Emily J. H. Jones
4, Caroline Wooldridge
5,
Jumana Ahmad
2, Bonnie Auyeung
6,7, Claudia Brogna
8, Sara Ambrosino
9, Tobias Banaschewski
10,
Simon Baron-Cohen
6, Sarah Baumeister
10, Christian Beckmann
11, Michael Brammer
5, Daniel Brandeis
10,12,
Sven Bölte
13, Thomas Bourgeron
14, Carsten Bours
11, Yvette de Bruijn
11, Bhismadev Chakrabarti
6,15, Daisy Crawley
2,
Ineke Cornelissen
11, Flavio Dell
’ Acqua
1,2, Guillaume Dumas
14, Sarah Durston
9, Christine Ecker
1,16, Jessica Faulkner
2,
Vincent Frouin
17, Pilar Garces
18, David Goyard
17, Hannah Hayward
2, Lindsay M. Ham
19, Joerg Hipp
18,
Rosemary J. Holt
6, Mark H. Johnson
4, Johan Isaksson
13,20, Prantik Kundu
21, Meng-Chuan Lai
6,22,
Xavier Liogier D
’ardhuy
18, Michael V. Lombardo
6,23, David J. Lythgoe
5, René Mandl
9, Andreas Meyer-Lindenberg
24,
Carolin Moessnang
24, Nico Mueller
10, Laurence O
’Dwyer
11, Marianne Oldehinkel
11, Bob Oranje
9, Gahan Pandina
25,
Antonio M. Persico
8,26, Amber N. V. Ruigrok
6, Barbara Ruggeri
27, Jessica Sabet
2, Roberto Sacco
8,
Antonia San José Cáceres
2, Emily Simonoff
28, Roberto Toro
14, Heike Tost
24, Jack Waldman
6, Steve C. R. Williams
5,
Marcel P. Zwiers
11, Will Spooren
18, Declan G. M. Murphy
1,2and Jan K. Buitelaar
11Abstract
Background: The tremendous clinical and aetiological diversity among individuals with autism spectrum disorder (ASD) has been a major obstacle to the development of new treatments, as many may only be effective in particular subgroups. Precision medicine approaches aim to overcome this challenge by combining pathophysiologically based treatments with stratification biomarkers that predict which treatment may be most beneficial for particular individuals. However, so far, we have no single validated stratification biomarker for ASD. This may be due to the fact that most research studies primarily have focused on the identification of mean case-control differences, rather than within-group variability, and included small samples that were underpowered for stratification approaches. The EU-AIMS Longitudinal European Autism Project (LEAP) is to date the largest multi-centre, multi-disciplinary observational study worldwide that aims to identify and validate stratification biomarkers for ASD.
(Continued on next page)
* Correspondence:eva.loth@kcl.ac.uk
1Sackler Institute for Translational Neurodevelopment, Institute of Psychiatry,
Psychology and Neuroscience, King’s College London, De Crespigny Park, Denmark Hill, London SE5 8AF, UK
2Department of Forensic and Neurodevelopmental Sciences, Institute of
Psychiatry, Psychology and Neuroscience, King’s College London, De Crespigny Park, Denmark Hill, London SE5 8AF, UK
Full list of author information is available at the end of the article
© The Author(s). 2017 Open Access This article is distributed under the terms of the Creative Commons Attribution 4.0 International License (http://creativecommons.org/licenses/by/4.0/), which permits unrestricted use, distribution, and reproduction in any medium, provided you give appropriate credit to the original author(s) and the source, provide a link to the Creative Commons license, and indicate if changes were made. The Creative Commons Public Domain Dedication waiver (http://creativecommons.org/publicdomain/zero/1.0/) applies to the data made available in this article, unless otherwise stated.
(Continued from previous page)
Methods: LEAP includes 437 children and adults with ASD and 300 individuals with typical development or mild intellectual disability. Using an accelerated longitudinal design, each participant is comprehensively characterised in terms of clinical symptoms, comorbidities, functional outcomes, neurocognitive profile, brain structure and function, biochemical markers and genomics. In addition, 51 twin-pairs (of which 36 had one sibling with ASD) are included to identify genetic and environmental factors in phenotypic variability.
Results: Here, we describe the demographic characteristics of the cohort, planned analytic stratification approaches, criteria and steps to validate candidate stratification markers, pre-registration procedures to increase transparency, standardisation and data robustness across all analyses, and share some‘lessons learnt’. A clinical characterisation of the cohort is given in the companion paper (Charman et al., accepted).
Conclusion: We expect that LEAP will enable us to confirm, reject and refine current hypotheses of neurocognitive/ neurobiological abnormalities, identify biologically and clinically meaningful ASD subgroups, and help us map phenotypic heterogeneity to different aetiologies.
Keywords: Biomarkers, Cognition, Neuroimaging, MRI, EEG, Eye-tracking, Genetics
Background
Autism spectrum disorder (ASD) is a life-long neurode-velopmental condition, currently estimated to affect be-tween 1 and 1.5% of children and adults worldwide [1]. Since Kanner’s [2] and Asperger’s seminal case reports [3], diagnostic classification has solely relied on clinical observation, rather than aetiology. Defining symptoms are impairments in social-communication, repetitive and restricted behaviours and interests, and atypical sensory responses (DSM-5 [4]). However, the tremendous clin-ical, aetiological and genetic heterogeneity among indi-viduals with ASD is now widely recognised. Clinically, individuals with ASD can differ substantially from each other in terms of the quality and severity of core symp-toms, level of intellectual ability, co-occurring psychi-atric symptoms, and developmental trajectories [5]. Multiple neurocognitive and neurobiological abnormal-ities have been reported, yet none seem to be shared by all individuals with ASD [6]. Likewise, hundreds of com-mon and rare risk genes have been identified [7]. These diverse genetic as well as environmental risk factors may converge on a smaller number of common molecular pathways, including protein synthesis, synapse develop-ment and function, and neuro-immune interaction, which in turn impact brain circuit development and function [8]. However, it is not yet known how different aetiologies and phenotypic diversity at the cellular, mo-lecular, brain systems, cognitive, and/or behavioural level(s) map onto one another.
This heterogeneity has also been a major obstacle to the development of effective treatments. Different people with ASD may have different treatment needs; moreover, most medical treatments may only be effective in certain sub-groups because similar symptoms may have different bio-logical causes in different individuals. In response to this problem, precision medicine aims to develop treatments
based on the understanding of individual differences in the underlying pathophysiology, and then select patients for a particular treatment through use of ‘stratification bio-markers’ [9]. Therefore, a crucial step for this approach is the identification and validation of biomarkers that can parse the condition into distinct (biological) subgroups.
Stratification research in ASD is still in its infancy. In fact, most studies use case-control designs and look for ‘diagnostic biomarkers’. Conceptually, the assumption that ASD involves a variety of pathophysiological mechanisms casts doubt that a truly diagnostic marker—universal and specific to ASD—may exist. Also, the recently developed NIMH Research Domain Criteria (RDoC) Framework suggests that several circuit-based behavioural dimensions may be shared across neurodevelopmental/neuropsychi-atric disorders [10]. Methodologically, a mean group dif-ference alone (especially in combination with small effect sizes) does not necessarily indicate that a particular meas-ure would be a good (diagnostic) biomarker for ASD. For example, a test on which the majority of people with ASD falls within 0.5–1 standard deviations of the control group scores would have limited clinical utility in predicting whether someone has ASD or not. Alternatively, a small proportion of individuals with highly atypical scores may drive a mean group difference. On a test with continuous scores, higher scores may be correlated with severity of particular symptoms across ASD and control populations but only indicate risk for ASD above a certain cut-off. This may be more indicative of a potential subgroup, yet within-group variability remains largely unexplored.
In addition, most studies have been hampered by rela-tively small sample sizes, resulting primarily in lack of power but also the ‘winner’s curse’ (the likelihood of finding exaggerated effects in small studies) [11]. As in many areas of neuroscience [12], in ASD research repli-cation failures are common. Methodological differences,
such as different versions of cognitive tests or different neuroimaging analysis approaches, all impact findings and comparability between studies. Therefore, it is often difficult to disentangle whether inconsistencies between findings reflect participant heterogeneity, statistical power, or methods used.
Hence, to identify clinically useful stratification markers, we need to move from group level declarations to a better understanding of individual differences, and we need new approaches to identifying potentially (biologically) distinct ASD subgroups. The developmental nature of ASD and the likelihood that there may not be a strict one-to-one correspondence between different levels of analyses add complexity. Large-scale, longitudinal multidisciplinary ob-servational (or ‘natural history’) studies are an important first step to identify stratification markers and track how different biological and clinical profiles are linked over de-velopment. This requires collaborative research using a standardised protocol and analysis plan, and stringent statistical approaches [13]. As part of the European Autism Interventions—A Multicentre Study for Develop-ing New Medications (EU-AIMS) consortium (www.eu-aims.eu) [14, 15], we set up the multicentre Longitudinal European Autism Project (LEAP) to address this challenge.
Methods
Overall design of the Longitudinal European Autism Project
LEAP comprises over 800 participants. The case-control study includes approximately 437 individuals with ASD, and 300 controls and uses an accelerated longitudinal de-sign. In this design, four cohorts, defined by age and IQ, are recruited concurrently: A. Adults aged 18–30 years; B. Adolescents aged 12–17 years, C. Children aged 6– 11 years,—all with IQ in the typical range (75+)—and D. Adolescents and adults aged 12–30 years with ASD and/ or mild intellectual disability (ID) (IQ 50–74). Within each schedule, participants are recruited with a male:female ra-tio 3:1—corresponding to recent estimates of the sex rara-tio in ASD [16]. The main advantage of the accelerated longi-tudinal design over a single-cohort longilongi-tudinal study lies in the ability to span the age range of interest in a shorter period of time. The cohorts are followed up after 12– 24 months using the same core measures (see Table 1). A further twin cohort of N = 102 (including 36 monozygotic or dizygotic twin pairs discordant of ASD) is tested at one time point to identify genetic and environmental causes for ASD and to investigate variable expressivity and pene-trance of genetic mutations [17].
The project was designed by academic and industry partners and in consultation with the European Medi-cines Agency (EMA) to increase the chances that strati-fication biomarkers identified in this study may be
qualified to support regulatory decisions for future clin-ical trials [18]. An overview of our study protocol is given in Table 1 and Additional file 1. Our protocol and standard operation procedures (SOPs) are accessible on https://www.eu-aims.eu/fileadmin/websites/eu-aims/ media/EU-AIMS_LEAP/EU-AIMS-LEAP_SOP_Study-Protocol.zip. The study was approved by national and local ethics review boards at each study site and is car-ried out to Good Clinical Practice (ICH GCP) standards. An overview of the recruitment and study procedures is given in Fig. 1
Participant selection criteria
In the ASD group, inclusion criteria were an existing clinical diagnosis of ASD according to DSM-IV/ICD-10 or DSM-5 criteria. All psychiatric comorbidities (except for psychosis or bipolar disorder) are allowed as up to 70% of people with ASD have one or more co-occurring psychiatric conditions [19]. Similarly, we include partici-pants on stable medication because 30–50% [20] children and adults with ASD in Europe and up to 70% in the USA are prescribed at least one medication for features, such as aggression, anxiety, hyperactivity, or sleep problems [21]. The intellectual disability (ID) group (defined by IQ between 50 and 74) comprises in-dividuals with both idiopathic and syndromic forms of mild intellectual impairments.
Clinical characterisation measures in ASD
In the ASD group, diagnosis is confirmed using the com-bined information of the Autism Diagnostic Interview-Revised (ADI-R [22]) and the Autism Diagnostic Observa-tion Schedule 2 (ADOS-2). Cut-offs on the ADI-R/ ADOS-2 are not used as exclusion criteria [23]. To assess dimensional symptom severity across ASD core domains, we used several parent-report instruments with relative emphasis on social-communication [24, 25], repetitive and restricted behaviours [26, 27], sensory processing anomal-ies [28, 29], and overall autism symptom severity [30, 31] (see Additional file 1). All scales had been validated for the targeted age ranges. In-house translations/back-trans-lations were carried out for some scales. In adolescents and adults with average IQ, companion self-report ver-sions are also included.
We assess a range of psychiatric disorders using the Development and Well-being Assessment (DAWBA, [32]). The most common comorbidities (attention-def-icit/hyperactivity disorder (ADHD), depression, anxiety, sleep anomalies) are also assessed at the symptom level using parent and self-report questionnaires. Parental interviews on adaptive behaviour [33] and parent and/ or self-report questionnaires on quality of life [34] provide additional outcome measures.
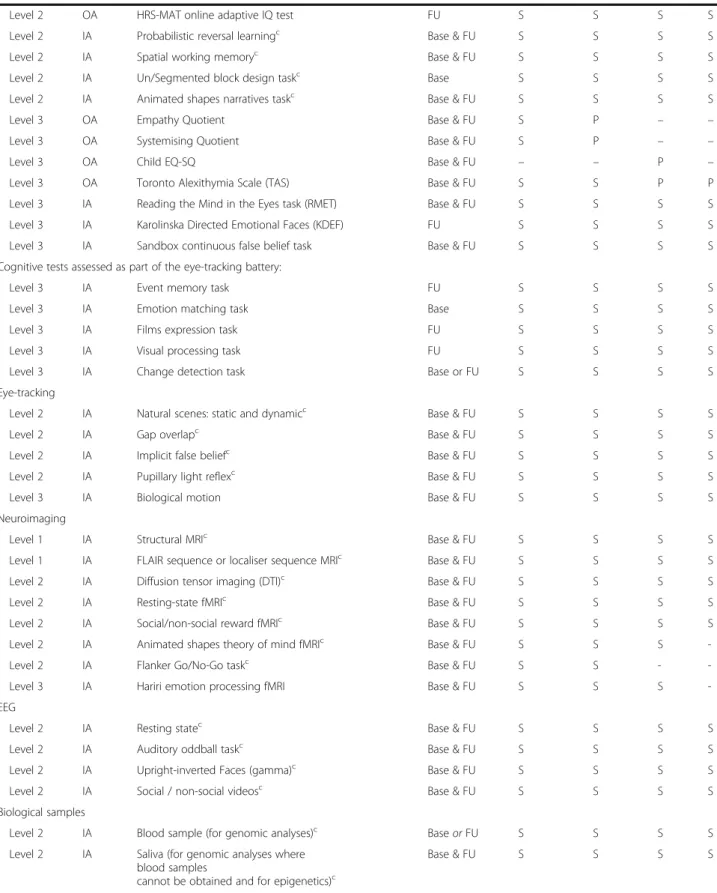
Table 1 LEAP summary of study protocol, by schedule Level IA/ OA Domain/task Time point Schedulea A B C D Clinical diagnosis
Level 1 IA Autism Diagnostic Interview-Revised (ADI-R)c Base Pb Pb Pb Pb
Level 1 IA Autism Diagnostic Observation Schedule (ADOS or ADOS-2)c
Base & FU Sb Sb Sb Sb
Dimensional measures of ASD symptoms
Level 2 OA Social Responsiveness Scale-2nd Edition (SRS-II)c Base & FU S & Pb S & P P P
Level 2 OA Repetitive Behaviour Scale-Revised (RBS-R)c Base & FU Pb P P P
Level 2 OA Short Sensory Profile (SSP)c Base & FU Pb P P P
Level 2 OA Children’s Social Behaviour Questionnaire (CSBQ)c
Adults’ Social Behaviour Questionnaire (ASBQ)c Base & FU –S & Pb P– P– P–
Level 2 OA Autism Quotient (AQ), AQ-Adol, AQ-Childc Base & FU S & Pb P P P
Level 2 OA Aberrant Behaviour Checklist FU Pb P P P
Level 2 OA Adult Routines Inventory (ARI) or
Childhood Routines Inventory-Revised (CRI-R)
FU S – –P – P – P Level 2 OA Sensory Experiences Questionnaire—short
version (SEQ 3.0)
FU Pb P P P
Level 2 OA Global Score of Change FU Pb Pb Pb Pb
Comorbidities
Level 2 OA Development and Well-Being Assessment (DAWBA)c Base S & Pb S & P P P
Level 2 OA Strengths and Difficulties Questionnaire (SDQ)c Base & FU S & Pb S & P P P
Level 2 OA DSM-5 ADHD rating scalec Base & FU S & Pb P P P
Level 3 OA Beck Anxiety Inventory (BAI) Base & FU S S P P
Level 3 OA Beck Depression Inventory (BDI) Base & FU S S P P
Quality of life/adaptive behaviour
Level 1 IA Vineland Adaptive Behaviour Scale-2nd Ed (VABS-2) Base & FU Pb Pb P P
Level 2 OA Columbia Impairment Scale (CIS)c Base & FU S & Pb S & P P P
OA Child Health and Illness Profile (CHIP-CE) or World Health Organisation Quality of Life (WHOQOL-BREF)
Base & FU – S
P
– P– P–
Medical or psychiatric history
Level 1 OA NIH ACE Subject Medical History Questionnairec Base S’ or Pb P P P
Level 2 OA NIH ACE Family History Form Base S’ or Pb P P P
Level 2 OA Medical Psychiatric History Perinatal Environmental Risk
Questionnairec
FU Pb P P P
Level 2 OA Brief Life Events Questionnaire, anchored in pregnancy
FU Pb P P P
Level 2 OA Children’s Sleep Habits Questionnaire or Adult version (FU only)
Base & FU – S
S & P
– P– P–
Level 2 IA Family Medical History Interview FU S’ or Pb P P P
Cognitive and psychological profile
Level 1 IA WASI or WISC / WAIS (4 subtests)c Base S S S S
Level 1 IA WASI or WISC / WAIS (2 subtests)c FU S S S S
Table 1 LEAP summary of study protocol, by schedule (Continued)
Level 2 OA HRS-MAT online adaptive IQ test FU S S S S
Level 2 IA Probabilistic reversal learningc Base & FU S S S S
Level 2 IA Spatial working memoryc Base & FU S S S S
Level 2 IA Un/Segmented block design taskc Base S S S S
Level 2 IA Animated shapes narratives taskc Base & FU S S S S
Level 3 OA Empathy Quotient Base & FU S P – –
Level 3 OA Systemising Quotient Base & FU S P – –
Level 3 OA Child EQ-SQ Base & FU – – P –
Level 3 OA Toronto Alexithymia Scale (TAS) Base & FU S S P P
Level 3 IA Reading the Mind in the Eyes task (RMET) Base & FU S S S S
Level 3 IA Karolinska Directed Emotional Faces (KDEF) FU S S S S
Level 3 IA Sandbox continuous false belief task Base & FU S S S S
Cognitive tests assessed as part of the eye-tracking battery:
Level 3 IA Event memory task FU S S S S
Level 3 IA Emotion matching task Base S S S S
Level 3 IA Films expression task FU S S S S
Level 3 IA Visual processing task FU S S S S
Level 3 IA Change detection task Base or FU S S S S
Eye-tracking
Level 2 IA Natural scenes: static and dynamicc Base & FU S S S S
Level 2 IA Gap overlapc Base & FU S S S S
Level 2 IA Implicit false beliefc Base & FU S S S S
Level 2 IA Pupillary light reflexc Base & FU S S S S
Level 3 IA Biological motion Base & FU S S S S
Neuroimaging
Level 1 IA Structural MRIc Base & FU S S S S
Level 1 IA FLAIR sequence or localiser sequence MRIc Base & FU S S S S
Level 2 IA Diffusion tensor imaging (DTI)c Base & FU S S S S
Level 2 IA Resting-state fMRIc Base & FU S S S S
Level 2 IA Social/non-social reward fMRIc Base & FU S S S S
Level 2 IA Animated shapes theory of mind fMRIc Base & FU S S S
-Level 2 IA Flanker Go/No-Go taskc Base & FU S S -
-Level 3 IA Hariri emotion processing fMRI Base & FU S S S
-EEG
Level 2 IA Resting statec Base & FU S S S S
Level 2 IA Auditory oddball taskc Base & FU S S S S
Level 2 IA Upright-inverted Faces (gamma)c Base & FU S S S S
Level 2 IA Social / non-social videosc Base & FU S S S S
Biological samples
Level 2 IA Blood sample (for genomic analyses)c Base or FU S S S S
Level 2 IA Saliva (for genomic analyses where blood samples
cannot be obtained and for epigenetics)c
Biomarker methodologies
Core measures were selected to be suitable across all age and ability levels to determine whether biomarkers are present only at distinct ages or change with age. We chose measures on which individuals with ASD were previously reported to differ from controls on average and that test several of the most influential neurocogni-tive (see Table 1) and neurobiological hypotheses of ASD (e.g. differences in brain connectivity [35], excitatory-inhibitory balance [36]). Measures that provide compar-able read-outs in animal models and humans were prioritised so that findings can be translated to drug dis-covery. Some of these measures were taken from the high-risk infant sibling study EUROSIBS (www.eurosib-s.eu) allowing us to establish whether some cognitive or neurobiological markers identified in this study also con-fer risk for developing ASD.
Neurocognitive and behavioural markers Neurocogni-tive measures included in this study span a wide range of social, motivational, affective, and cognitive domains previously linked to ASD.
Theory of mind (ToM)[37] (also called mentalising or mindreading) refers to the ability to represent mental states, such as beliefs, desires, and intentions to predict and explain (others’ and own) behaviour. ToM deficits have been widely regarded as core social-cognitive deficits in ASD and have been hypothesised to underlie, or con-tribute to, a range of social-communicative impairments.
However, severity of impairments has been shown to de-pend on age and ability level. A useful distinction has been made between explicit (i.e. verbally or cognitively medi-ated) [38] and implicit or spontaneous ToM [39, 40]. Many high-functioning adolescents and adults with ASD acquire some degree of explicit ToM, whereas abnormal-ities may primarily consist of persistent deficits in the (typically developmentally earlier emerging) implicit the-ory of mind usage. Therefore, we compare for each par-ticipant abnormalities in explicit vs. implicit/spontaneous ToM at the behavioural and (using fMRI) neurofunctional levels because atypical brain processes can persist despite apparently‘intact’ behaviour.
Emotion recognition refers to the ability to infer other people’s emotions from their facial expressions and is there-fore critical for many aspects of social-communication. We assess the ability to recognise a range of simple and com-plex facial expressions in behavioural tests [41] and using eye-tracking [42] and examine neural responses during the processing of facial expressions using fMRI [43].
Another influential theory has proposed that dimin-ished social motivation may represent a primary deficit in ASD [44] and is often operationalized as diminished spontaneous attention to social (vs. non-social) informa-tion when observing (naturalistic) images or social situa-tions, using eye-tracking. Social motivation deficits may in turn be rooted in diminished social reward sensitivity [45], i.e. the reward value of faces and other social information.
Table 1 LEAP summary of study protocol, by schedule (Continued)
Level 2 IA Urine (at home, for biochemical biomarkers)c Base or FU S S S S
Level 2 IA Hair roots (to generate iPSCs)c Base or FU S S S S
Level 2 IA Head circumferencec, weightc, heightc Base & FU S S S S
Assessment of clinical symptoms and cognition in both biological parents
Level 3 OA Social Responsiveness Scale (SRS-2) Base Pb Pb Pb Pb
Level 3 OA DSM-5 ADHD rating scale Base Pb Pb Pb Pb
Level 3 OA Beck Anxiety Inventory (BAI) Base Pb Pb Pb Pb
Level 3 OA Beck Depression Inventory (BDI) Base Pb Pb Pb Pb
Level 3 OA Adult Routines Inventory (ARI) FU Pb P P P
Level 2 OA HRS-MAT online adaptive IQ test FU Pb P P P
Level 1 measures are defined as the minimal data set that must be acquired for any one participant to be included in the‘head count’. Level 2 measures are (a) central to primary and/or secondary study objectives, (b) suitable for the entire targeted participant age and ability range, and (c) have previously shown ASD case-control differences or have been validated in ASD group(s). Level 3 measures are measures that are either (a) more exploratory (e.g. related to novel/emer-ging hypotheses), (b) less central to the primary or secondary study objectives, and/or (c) only suitable for some schedules. Within each assessment module, in the order of assessments, level 1 and level 2 assessments should be administered before level 3 assessments. Level 3 measures are omitted first in the event of, e.g. participant fatigue or if assessments take considerably longer than average
ADHD attention-deficit hyperactivity disorder, ASD autism spectrum disorder, Base baseline assessment wave, DSM Diagnostic and Statistical Manual of Mental Dis-orders, fMRI functional magnetic resonance imaging, FU follow-up assessment wave, IA investigator administered assessment at the institute, iPSCs induced pluri-potent stem cells, NIH ACE US National Institutes of Health Autism Centers of Excellence, OA online assessment, P reported by parent, S reported, S’ self-reported in the TD adult group in which parents are not enrolled in the study, sMRI structural magnetic resonance imaging, TD typical development
a
Schedule A: adults with ASD or TD (aged 18–30 years, with IQ greater than 70); schedule B: adolescents with ASD or TD (aged 12–17 years, with IQ greater than 75); schedule C: children with ASD or TD (aged 6–11 years, with IQ greater than 75); schedule D: adolescents and adults with mild ID (with or without ASD) (aged 12–30 years, with IQ 50–74); schedule E: monozygotic or dizygotic twins (schedule E is not shown but is based on schedules A–C)
b
ASD groups only
c
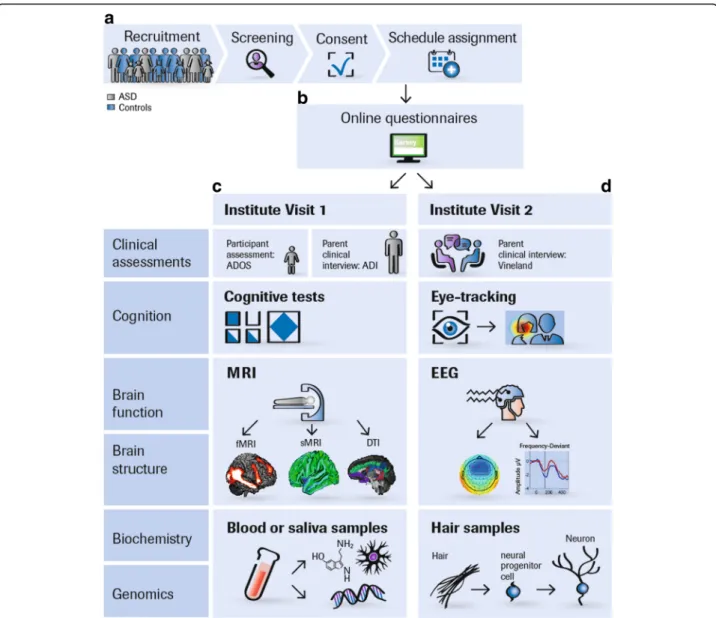
Fig. 1 LEAP recruitment and assessment procedures. a Participants are concurrently recruited and assessed at seven European study sites: the Institute of Psychiatry, Psychology and Neuroscience, King’s College London, United Kingdom Autism Research Centre at the University of Cambridge, United Kingdom, Radboud University Nijmegen Medical Centre, University Medical Centre Utrecht, the Netherlands, Central Institute of Mental Health, Mannheim, Germany, and the University Campus Bio-Medico, Rome, Italy. Twins are predominantly recruited from the Roots of Autism and ADHD Twin Study in Sweden (RATSS) at Karolinska Institute, Stockholm, Sweden [17]. At each study site, participants with ASD and mild ID are recruited from existing local databases, clinic contacts, and local and national support groups. TD participants are recruited via mainstream schools, flyers (e.g. left at youth centres, colleges, churches, etc.), and existing databases. Participants (or parents) who express interest are sent an information sheet and then screened over the phone for eligibility. If inclusion criteria are confirmed, written consent is obtained and the participant is assigned to a study schedule based on their age and ability level. b Parents (as well as adolescents and adults without ID) are sent login details to an online questionnaire (Delosis Ltd., London) to complete at home. c and d The participant and a parent visit the study centre on two separate occasions within 4 weeks. For participants who travel from far, visits take place on two consecutive days with an overnight stay at a local hotel arranged by the research team. Clinical assessments and interviews are conducted with the participant
(e.g. ADOS-2) and a parent (ADI-R, Vineland, Family History Interview). If parents stay with their child during his/her assessments, these interviews are later conducted over the phone. Most cognitive tests are administered using the computerised platform Psytools (Delosis, London Ltd.); some are paper-pencil tests. Eye-tracking is acquired using Tobii-Eye-trackers with a standard acquisition rate of 120 Hz. Tasks are presented interleaved to minimise attentional requirements. Each participant completes a 60–90-min MRI scan session to acquire structural and DTI scans, a resting-state functional MRI scan, and (depending on schedule) one to four task-related fMRI scans. During a training session before the scan, they are instructed to keep still, familiarised with the scanner noise, trained in the functional tasks, and, where possible, are given the opportunity to lie in a mock scanner. During the structural scans, participants watch videos from a video library or DVD brought from home, to make the scan experience more enjoyable. The EEG session tests functional activation during face processing, social and non-social processing, an auditory oddball paradigm (MMN), and resting state. Blood, urine, and saliva samples are taken from the participant and, where possible, both parents for biochemical and genomic analyses. Hair samples are taken to derive induced pluripotent stem cells from selected participants
Executive functions (EF) is an umbrella term for a set of cognitive processes that rely on prefrontal regions and that include attentional control, inhibitory control, work-ing memory, cognitive flexibility, reasonwork-ing, problem solving, and planning. Originally, EF deficits, perhaps notably impairments in cognitive flexibility, were hypothesised to underlie repetitive and restricted behav-iours [46, 47]. Whereas evidence for the role of EF in RRBIs is mixed, EF deficits may contribute to both social and non-social ASD symptoms, possibly, by interac-ting—developmentally or online—with other cognitive systems. Intact EF skills in some individuals may serve as a compensatory mechanism [48] that scaffolds adaptive behaviour [49]. We assess spatial working memory [50] and probabilistic reversal learning [51] using computerised tests and inhibitory control while fMRI blood-oxygen-level dependent (BOLD) responses are recorded.
Weak central coherence (WCC) [52] describes a local, detail-focused information processing style, paired with difficulties in global processing, processing information for meaning and in integrating information in context. WCC is thought to pervade different areas of perception and cognition. This account explicitly aims to address is-lets of talent (in absolute or relative terms) and spared skills. We include the un/segmented block design task as an index of WCC.
Systemizing [53] describes a cognitive style charac-terised by the motivation to predict lawful events (using if-then rules) and observations of input-operation-output relationships and includes good attention to de-tail. Systemizing is thought to represent a continuum where, on average, males exceed females, and individuals with ASD (both males and females) are shifted to the ex-treme end of aptitude. It also aims to address relative and absolute strengths in ASD. We assess systemizing using age-appropriage versions of the Systemizing Quo-tient [54].
Top-down processingrefers to the fundamental cogni-tive principle that we use our past experiences and prior knowledge to make sense of the present and predict the future. Top-down processing anomalies have been linked to superior perceptual skills and a more ‘accurate’ or veridical memory in ASD [55].
Predictive coding [56, 57] assumes that the brain con-stantly matches incoming (external) stimuli against a set of (internal) expectations of what will likely happen. Ab-normalities in predictive coding may potentially impli-cated in several facets of repetitive behaviours, sensory processing anomalies, talents as well as social cognitive abilities [58]. Top-down processing is assessed using eye-tracking change detection and event memory tasks; predictability using by studying mismatch negativity de-rived from an auditory oddball task (using EEG).
Together, this aims to create a comprehensive profile of each participant’s strengths and weaknesses across cognitive domains. Such a cross-domain profile (or com-posite markers) may potentially be better in predicting symptom severity or functional outcome than the sever-ity of deficits/differences in one single domain. For core domains (e.g. theory of mind), we use convergent meth-odologies (e.g. behavioural testing, eye-tracking, and fMRI) in the same participant, to identify atypical pro-cesses and compensatory mechanisms.
Eye-tracking in ASDEye-tracking measures can be eas-ily acquired in children and adults with ASD as they are non-invasive and do not require motor responses or lan-guage skills. Visual fixation patterns and saccadic control provide a quantitative index of several attentional, per-ceptual, or social cognitive abnormalities that may be both more specific to particular clinically related features than are questionnaire scores (which typically comprise a composite of several behavioural abnormalities) and more proximal to neurobiological abnormalities. For ex-ample, we assess the pupillary light reflex, which largely depends on cholinergic synaptic transmission [59]. We also measure spontaneous visual attention to social and non-social aspects of static and dynamic naturalistic scenes (movie clips). Previous studies found diminished spontaneous attention to the eyes in a high proportion of individuals with ASD from around one year of age through to adults [60, 61]. This behavioural marker of so-cial impairment has been linked to either reduced soso-cial reward sensitivity or increased (social) anxiety, which may in turn be mediated by the neuropeptides oxytocin [62] and vasopressin [63], or serotonin [64]. Therefore, changes in visual fixation patterns or saccadic control following a treatment may indicate an initial benefit that presages lon-ger term symptom reduction or behavioural/adaptive changes. It may also provide indications of the neurocog-nitive mechanisms through which improvements occur.
Markers of brain structure, function, and connectivity
We use magnetic resonance imaging (MRI) and electroen-cephalography (EEG) to study differences in brain structure [65], function, and connectivity [35, 66]. These methods are critical to delineating ASD subgroups based on systems-level abnormalities and provide the basis for identifying the mechanisms through which (future) treatments may pro-duce improvements in functioning.
MRI and DTI Across sites, MRI scans are acquired on 3T scanners from different manufacturers (Siemens, Philips, General Electric). We carried out several proce-dures to optimise structural and functional sequences for the best manufacturer-specific options and to address challenges related to standardisation and quality
assurance of multi-site image-acquisition (e.g. use of phantoms, travelling heads).
Measures of total grey and white matter volume provide global descriptors of brain anatomy. Previous neuroimag-ing studies showed abnormalities in brain development in ASD, with enlarged brain volumes over the first years of life that plateaued across school age and were followed by a more rapid decline from adolescence [65]. This indicates that differences in total brain volume may only reflect risk for ASD at certain developmental stages rather than being causal for the condition. Abnormalities have also been reported in regional brain volumes of children and adults with ASD, including the frontal and temporal cortices, amygdala, hippocampus, caudate nucleus, and cerebellum [67]. These regions support several cognitive, motivational, and emotional functions that are affected in some people with ASD (Table 2). In addition to total and regional brain volumes, we also investigate differences in cortical thickness and cortical surface area, as these anatomical indices have distinct genetic determinants [68], phylogeny, and develop-mental trajectories [69].
Structural connectivity reflects physical connections between neurons. Its strength depends on the number and efficacy of synapses and in turn affects functional connectivity. We derive indices of structural connectivity both from structural MRI scans and diffusion tensor im-aging (DTI). For example, intrinsic grey matter connect-ivity can be estimated by examining differences in local and global wiring costs [70] and differences in short and long-range white matter tracts using tractography ana-lysis of specific pathways [71].
Task-related functional MRI Four functional MRI par-adigms assess neural activation in networks implicated in social and non-social reward processing using an in-centive delay task that measures brain reactivity when anticipating a social reward (a woman’s smile) or a mon-etary reward [72], theory of mind, using an adapted ver-sion of the animated shapes task [73], inhibitory control/ conflict monitoring using a Flanker/Go-NoGo task [74], and emotional reactivity to fearful faces [43]. Their known or putative underlying brain networks and implicated neurotransmitter systems are described in Table 2.
The paradigms have been adapted such that each task can be acquired within 5–10 min, as it is challenging for young children and some individuals with ASD (and es-pecially ID) to remain still in the scanner for longer pe-riods of time.
Good test-retest reliability of the fMRI battery was demonstrated in typically developing adults [75, 76]. A pilot study confirmed the feasibility of the tasks for use in children and individuals with ASD. We will use region-of-interest analyses of known areas comprising a particular network (Table 2) as well as exploratory whole-brain analyses in order to investigate potential ab-normalities in both activation and functional connectiv-ity within and across tasks.
Resting-state fMRI We use a multi-echo EPI sequence for resting-state fMRI data acquisition. Data are proc-essed using multi-echo independent component analysis and TE-dependent analysis to identify and remove non-neural noise, such as motion artefacts, from the BOLD-signal [77]. This enhances the temporal BOLD-signal-to-noise
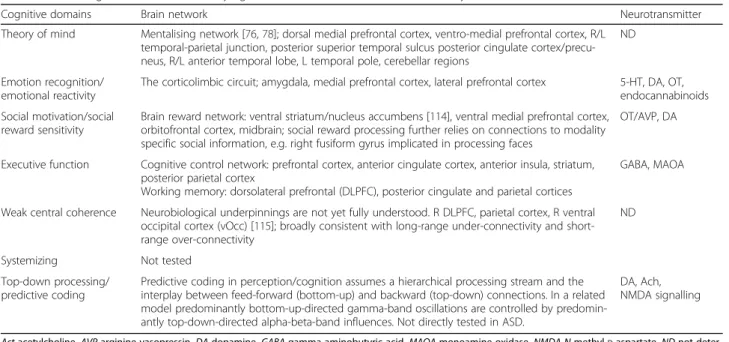
Table 2 Neurocognitive domains, underlying brain networks, and neurotransmitter systems
Cognitive domains Brain network Neurotransmitter
Theory of mind Mentalising network [76,78]; dorsal medial prefrontal cortex, ventro-medial prefrontal cortex, R/L temporal-parietal junction, posterior superior temporal sulcus posterior cingulate cortex/precu-neus, R/L anterior temporal lobe, L temporal pole, cerebellar regions
ND
Emotion recognition/ emotional reactivity
The corticolimbic circuit; amygdala, medial prefrontal cortex, lateral prefrontal cortex 5-HT, DA, OT, endocannabinoids Social motivation/social
reward sensitivity
Brain reward network: ventral striatum/nucleus accumbens [114], ventral medial prefrontal cortex, orbitofrontal cortex, midbrain; social reward processing further relies on connections to modality specific social information, e.g. right fusiform gyrus implicated in processing faces
OT/AVP, DA
Executive function Cognitive control network: prefrontal cortex, anterior cingulate cortex, anterior insula, striatum, posterior parietal cortex
Working memory: dorsolateral prefrontal (DLPFC), posterior cingulate and parietal cortices
GABA, MAOA
Weak central coherence Neurobiological underpinnings are not yet fully understood. R DLPFC, parietal cortex, R ventral occipital cortex (vOcc) [115]; broadly consistent with long-range under-connectivity and short-range over-connectivity
ND
Systemizing Not tested
Top-down processing/ predictive coding
Predictive coding in perception/cognition assumes a hierarchical processing stream and the interplay between feed-forward (bottom-up) and backward (top-down) connections. In a related model predominantly bottom-up-directed gamma-band oscillations are controlled by predomin-antly top-down-directed alpha-beta-band influences. Not directly tested in ASD.
DA, Ach, NMDA signalling
Act acetylcholine, AVP arginine vasopressin, DA dopamine, GABA gamma-aminobutyric acid, MAOA monoamine oxidase, NMDA N-methyl-D-aspartate, ND not deter-mined, OT oxytocin, 5-HT 5-hydroxytryptamine, serotoni
ratio in seed connectivity analyses and may increase ef-fect size estimation and statistical power [78]. As motion-related noise can produce spurious correlations throughout the brain [79], this is particularly relevant for connectivity analyses in children and clinical popula-tions who may systematically move more in the scanner than typically developing adults. Multiple functional net-works have been identified that are characterised by co-herent patterns of intrinsic activity between‘nodes’ that resemble patterns of activity that are engaged during particular cognitive functions. This includes the ‘default mode network’ and networks implicated in dorsal atten-tion, fronto-parietal control, and motor functions [80]. We aim to identify subgroups with hyper- and hypo-connectivity within and across these networks [81, 82] and examine whether they differ in symptom presenta-tions and/or aetiology.
Electroencephalography (EEG) EEG is a promising biomarker modality with potential clinical utility because of its suitability across broad age and ability ranges, rela-tive low cost, ease of administration, and widespread availability [83, 84]. Its high temporal resolution comple-ments better spatial resolution offered by fMRI. Our EEG methods follow the recent guidelines of recording, analysis, and interpretation of EEG data in autism re-search [85]. MRI data from the same participants can be used to derive personalised anatomical priors for cortical source reconstruction approaches. We derive two com-plementary indices: First, using event-related potential (ERP) and event-related oscillation (ERO) paradigms, we study differences in ERP components and EROs that contribute to different sets of neurocognitive processes, such as face processing (P1, N170 components), pre-attentive change detection (mismatch negativity, MMN), or novelty detection (P3a). Second, we use frequency-based analyses to investigate differences in functional ac-tivity, variability, and connectivity across all frequency bands (sub-delta to gamma) during resting-state record-ings and while passively viewing social and non-social videos. For example, the neurochemical basis of neural firing in the gamma band range depends on interactions between excitatory and inhibitory neurotransmitter con-centrations and may therefore serve as a proxy measure of E/I imbalances [86]. Functional connectivity analyses examine differences in short- and long-range synchron-isation within and between brain networks and comple-ment connectivity analyses from resting-state fMRI.
Biochemical biomarkers
Alterations in the immune system, mitochondrial func-tion, oxidative stress pathways, and several neurotrans-mitter systems have previously been reported in ASD [87]. For example, increased serotonin blood levels are
the most consistently replicated biochemical abnormality found in ASD [88] with approximately 27% of individ-uals showing significant elevations [89]. As 5-HT eleva-tions appear to be more prevalent in pre- than in post-pubertal ASD samples [90], we will determine the utility of blood serotonin as a biomarker from childhood to adulthood.
Genetic markers
We acquire blood samples from the participant, and—-where possible—both biological parents, for genomic ana-lyses. First, in collaboration with the Autism Speaks MSSNG project (https://www.mss.ng), we carry out whole-genome sequencing of multiplex (families with two or more individuals with ASD) and simplex families (where only one person has ASD) to assess the combin-ation of inherited and de novo genetic varicombin-ation (rare and common variants, coding and non-coding variants) that may confer risk for ASD or specific traits linked to ASD. Second, we aim to identify pathways associated with ASD and assign each individual to particular molecular path-ways based on their entire mutation profile. In addition, data will be pooled with other international initiatives, to improve the ability to identify new ASD-risk genes.
Environmental risk factors
Despite the high heritability of ASD, recent findings in-dicate that environmental risk factors, notably those act-ing pre- and perinatally [91, 92], might play a larger role than previously assumed (e.g. maternal immune activa-tion [93], prenatal steroid exposure [94], and gestaactiva-tional diabetes [95]). Therefore, we gather retrospective infor-mation on perinatal factors, including any maternal ill-ness/infection, medication, alcohol/drug use, stressful life events, complications during pregnancy/delivery, as well as potentially protective factors, such as the use of vitamins/nutrients.
Parent-phenotyping and family psychiatric history
In both biological parents, we administer dimensional measures of the ASD phenotype and assess personality traits linked to ASD (empathising/systematising), com-monly co-occurring psychiatric conditions, and IQ.
Using a semi-structured interview, we also obtain comprehensive information on the psychiatric history of first- and second-degree relatives. This addresses the fact that many ASD-risk genes also confer familial vulner-ability for a range of other neurodevelopmental/neuro-psychiatric disorders and subclinical traits [96].
Hair samples
We collect hair roots from participants and first-degree rel-atives. They are subsequently frozen to generate induced pluripotent stem cells (iPSCs) from selected donors with a
particular genomic and/or phenotypic profile. These cell lines help to identify convergent and divergent morpho-logical, cellular, and molecular mechanisms underpinning ASD (subgroups) and for drug screening [97].
Central data base/data access
The central database comprises three layers: First, raw data from all recruitment centres (and the on-line ques-tionnaire platform) are uploaded onto the central database using a secured web-interface. Second, for neuroimaging pre-processing and quality control procedures, analysis teams access the raw data via sftp, carry out the necessary analyses locally, and upload quality controlled (QC)/pre-processed data. The final data set is ‘read-only’. A web-based interface enables users to access the database using personalized login details to search, filter, and download data. The EU-AIMS database is currently accessible for in-ternal users but will subsequently be opened to the wider scientific community.
Statistical analysis plan
Table 3 outlines the governance structure of EU-AIMS LEAP and describes steps undertaken to increase trans-parency, standardisation, and reproducibility.
We are using two complementary approaches to iden-tify stratification biomarkers for ASD subtypes. Power calculations are provided in Additional file 2.
Stratification by participant characterisation criteria
For each measure, we will first test for overall case-control differences and then stratify the sample by age, IQ, sex, and the presence of comorbidities. To investigate age ef-fects in, for example, brain anatomy, resting-state con-nectivity, or cognitive skills, we first create‘cross-sectional developmental trajectories’ or ‘growth charts’ for the typic-ally developing (TD) group that test for linear and nonlin-ear (e.g. quadratic) developmental patterns and determine the typical variability at a particular age [98]. Then, we use confidence intervals around the TD trajectory to assess for each individual with ASD whether, and by how far, he or she falls outside the range of performance expected for their age group. This will help determine whether the ab-normality is only detected at a certain developmental stage, or in a subgroup of individuals with ASD across ages. We will also compare several trajectories simultan-eously using mixed design linear regression models [98] to establish whether in the ASD group, performance de-velops with delay or is uneven across domains or compo-nent processes. Cross-sectional age-related patterns will be compared to longitudinal (within person) trajectories once follow-up data are available.
Sex differences have previously been reported both in typical development and ASD groups at multiple levels, including serum biomarkers, brain structure and function,
Table 3 Governance structure of LEAP, pre-registration, quality control, and reporting of findings
Data analysis is split into expert core analysis groups, broadly defined by data modality (e.g. clinical measures, cognition, EEG, structural MRI, functional MRI, etc.). Each group leads core analyses and coordinates modality-relevant exploratory bottom-up projects. Core analysis groups are closely linked to each other and to‘cross-cutting’ interest groups (e.g. sex differences, excitatory-inhibitory balance, etc.).
Registration of projects: All individual projects (whether they are part of core-analyses or bottom-up projects) are pre-registered on an internal website and shared among the group. Project information includes lead and senior investigators, active collaborators, primary and secondary project goals, and outlines core measures and methodologies. Individual login details to the central EU-AIMS data-base is given upon project review and approval.
Quality control, standardisation of definitions and analyses: To maximise coherence and comparability between projects, expert groups lead on modality-specific quality control procedures, which are documented and shared. Where applicable, processing and analysis scripts are also shared to increase transparency and enable replication. Expert groups provide study-wide recommendations, including, for example, a core set of clinical out-come measures, the use of specific covariates, particular analysis approaches pertaining to a given data modality, procedures to correct for multiple-comparisons (e.g. permutations), a priori decisions as to whether/when the data set should be split into a test/replication sample (depending on whether exact or approximate external validation data sets are available). For example, for cognitive analyses, IQ is not recommended to be entered as co-variate, as in the present cohort IQ is partially collinear with group status [116]. For all but machine learning approaches, the data set is not split into test/replication (e.g. 70:30%) data sets, as for cross-domain or cross-modal analyses data loss due to missing values is expected, the number and size of empirically derived subgroups are a priori unknown, and therefore the repli-cation data set likely has limited power in replicating findings. In these in-stances, internal cross-validation strategies (e.g. bootstrapping) should be used. For neuroimaging analyses, core analysis groups carry out centralised pre-processing using a homogeneous automated motion detection algo-rithm and several quality control procedures, based on consensus agreement on specific parameters, as well as first level values, e.g. of cortical thickness/ surface area. For second-level neuroimaging analyses, parametric and non-parametric permutation-based inference methods will be applied depending on the distribution properties of the data. While parametric analyses offer the advantage of efficiency and reproducibility if the underlying distribution as-sumptions are met, non-parametric approaches offer greater robustness when normality assumptions are violated. These efforts are aimed at increas-ing consistency between individual projects/analyses, reducincreas-ing duplication of efforts, and to allow LEAP researchers to benefit from each other’s expert-ise. In addition, we aim to create a culture that discourages practices such as ‘undisclosed analytic flexibility’, i.e. one uses multiple approaches for one ana-lysis question but only reports the‘best’ results (‘fishing, p value hunting’). However, to strike a balance between standardisation and supporting novel/ different approaches, all LEAP researchers can access raw data, use different pre-processing methods or outcome measures, as long as these choices are a priori justified in a project proposal and/or the number of analyses per-formed are reported and appropriately corrected for.
Standardised framework for reporting and evaluating biomarkers: Each project gives summary statistics about effect size, frequency and severity of abnormalities, sensitivity, specificity and—where applicable—cut-offs for dimensional stratification biomarkers. These criteria were identified as a priority for the validation of biomarkers by the European Medicines Agency and follow efforts made to increase consistency in reporting and evaluating case-control studies (see STROBE, http://strobe-statemen-t.org/index.php?id=available-checklists) and clinical trials (see CONsolida-tion of Standards for Reporting Trials, CONSORT [117]).
several aspects of cognition, and clinical symptom presen-tation [16]. Likewise, IQ or psychiatric comorbidities may significantly impact on brain and cognitive profile. Hence, we will test diagnosis-by-sex models to identify potentially sex-specific biomarkers and explore whether neurocogni-tive or neurobiological abnormalities vary with IQ or the presence of psychiatric comorbidities, using both dimen-sional and categorical approaches. We will also consider potentially mediating (e.g. sleep problems) or moderating factors, such as handedness (lateralisation), medication, and the narrow vs. broader ASD spectrum (ADI-R/ ADOS-2 cut-offs).
Progress has also been made in developing machine learning techniques for neuroimaging data in order to make clinically relevant predictions [99, 100]. Previous proof-of-concept data show that multivariate pattern clas-sification approaches using structural MRI data discrimi-nated individuals with ASD from healthy controls and non-autistic neurodevelopmental disorders with 90% ac-curacy [101]. We will apply multivariate approaches to see whether they can discriminate a priori defined subtypes (sex, comorbidities).
To test the potential value of each candidate marker as a‘surrogate end-point’, we will use correlation and re-gression analyses to establish whether it relates to or predicts symptom severity (overall, or in a particular do-main) or level of adaptive behaviour [102]. For each measure, we will report p values adjusted for the number of these core analyses, as well as nominally significant p values (to enable comparison with previous studies), ef-fect sizes, and descriptive information on frequency and severity of deficits. For quantitative stratification markers to be of clinical utility, it will be essential to delineate reference values and cut-offs to aid the interpretation of individual scores.
Stratification by unsupervised, data-driven approaches
The second approach uses data-driven multivariate ana-lysis techniques to identify subgroups based on the pat-tern of the data itself.
For example, cluster analyses are a widely used set of techniques to divide data into prototypical groups based on only the data points and their relationships to one another. Input variables could be multiple cognitive [103], eye-tracking indices [104], EEG values, or a com-bination of values from different data types. The optimal
number of (meaningful) clusters can be determined based on height differences in a cluster tree, while clus-ter robustness will be evaluated using cross-validation techniques, such as bootstrapping.
Normative modelling approaches have also recently been extended to model biological variation across the en-tire study sample or a typical population [105]. Gaussian process regression is used to predict a set of biological re-sponses (e.g. structural indoor connectivity indices) from a set of clinically relevant covariates (e.g. quantitative co-gnitive or symptom scores), while estimating predictive confidence for every prediction. This approach enables identification of individuals who are outliers within this distribution and to quantify the degree of deviation in re-lation to specific symptom domains.
Functional data analysis (FDA) takes advantage of trial level data, using curves or trajectories as observa-tional units (for example, eye-tracking gaze paths over time, individual ERP waveforms over the course of the experiment), rather than signals averaged across trials. One recent EEG study reported increased variability of task-related activity in ASD [106]. By combining this ap-proach with a robust multi-level clustering method, re-cent findings showed distinct learning patterns in particular ASD subgroups [107].
We will also apply recently developed unsupervised techniques to identify meaningful subtypes from the structural and functional neuroimaging data [100]. Fur-ther extensions of these methods enable combining dif-ferent data types (e.g. connectivity indices derived from DTI and resting-state EEG and fMRI) [108], which may further increase specificity/sensitivity of classifiers. Mandatory for these approaches is splitting the data into training and test data sets to avoid‘overfitting’ and to es-tablish how well the classifiers can predict to which sub-group a new individual belongs.
Molecular biomarkers are potentially of particularly high value to predict treatment response. We will use novel network-based stratification approaches similar to those that have recently been validated in cancer research to identify tumour subtypes that are predictive of patient survival or response to therapy [109]. This method inte-grates genomic information from each individual with functional gene networks (e.g. protein-protein inter-action), leveraging prior knowledge to stratify patients in subgroups with specific molecular profiles. We then aim to map those molecular subgroups to biological pathways, structural and functional biomarkers, and clinical symp-tom profiles.
Longitudinal follow-up
To test the value of candidate stratification markers in predicting symptom progression, we will initially track the relationship between changes in the neurobiological/
Table 3 Governance structure of LEAP, pre-registration, quality control, and reporting of findings (Continued)
Increased transparency of analyses and findings by depositing a summary of results: EU-AIMS researchers will deposit for each registered project a summary of results upon completion. The aim is to increase transparency of findings from planned analyses, including‘negative results’, which are both less frequently written-up for publication and currently more difficult to publish in peer-reviewed journals than positive results [112].
cognitive measure and clinical or behaviour indices at 12–24 months follow-up. In addition, we are seeking additional funding for a third assessment wave to con-struct for each individual developmental trajectories at multiple levels. This will enable us to ascertain whether subgroups whose (social-communicative, RRBI) symp-toms improve, remain the same, or worsen over devel-opment [110] differ in terms of their neurobiological/ cognitive profile at a given time or the rate of changes (e.g. arrested, uneven across component processes) across particular developmental stages.
Twin data
Twin data are analysed by applying a statistical framework of multiply adjusted (conditional) linear regressions based on generalised estimations equations (GEE) and allowing both categorical and dimensional ASD outcomes. In addition to the GEE model, an additive genetics, common environment, and unique environmental (ACE) model will be computed to determine heritability estimates. For all analyses, probability estimates for different twin groups will be included, based on the population-based twin co-horts, which allows generalizability of the results.
Biomarker validation
We will adopt biomarker validation criteria and steps similar to those employed in other biomedical fields, such as oncology, where biomarkers are ‘fit for purpose’, i.e. used in clinical practice [111]. Key criteria against which candidate stratification biomarkers will be validated are performance characteristics (accuracy and reliability) of the measure, reliability in relating to a particular clinical endpoint/clinical symptoms, and its prognostic and/or predictive value. For stratification markers of a priori de-fined subgroups (e.g. sex, comorbidity), accuracy (i.e. sen-sitivity and specificity, positive and negative predictive value) can be established using receiver operating charac-teristic (ROC) curves. For subgroups derived from data-driven, unsupervised approaches, external validation is essential as these groups do not necessarily differ in terms of their clinical profile. They may be validated by demon-strating their biological plausibility (i.e. that they have different genetic causes or molecular mechanisms) or functional value (that they differ in terms of their develop-mental trajectory or respond differentially to a given treat-ment). The latter cannot be tested in observational studies. Instead, the marker will need to be included in the design of treatment studies or clinical trials in order to compare responders and non-responders in terms of their biomarker characteristics [112]. To ascertain reproducibil-ity, replication in independent samples is essential. For this purpose, we are sharing our protocols and SOPs with other interested international research groups with whom we also have formal data-sharing agreements. They
currently include the Australian Cooperative Research Cen-tres (CRC), the French Fondation FondaMental, the Chin-ese Key 973 program, the Foundation for the National Institutes of Health (FNIH) Autism Biomarker Consortium, and the Province of Ontario Neurodevelopmental Disor-ders (POND) network. To investigate whether any of these stratification markers are specific to ASD we have aligned several measures with parallel European networks focused on ADHD, obsessive-compulsive disorder, and conduct dis-order (MATRICS, TACTICS, NeuroIMAGE [113]).
Results
Demographic information of the baseline cohort and assessment rates
Recruitment and assessment of the baseline case-control cohort was carried out between January 2014 (first sub-ject first visit, FSFV) and August 2016, except for sched-ule D, where recruitment and assessment are ongoing. Follow-up assessments began in September 2015, and all assessments (including schedule D baseline visits) are scheduled to be completed by August 2017. As per protocol, the twins at KI (schedule E) are only seen at one time point. Also, adults at UCBM are only seen at one time point. At the time of writing (08 April 2017), 448 participants have completed their follow-up assess-ments. Across study sites, retention rates range between 80.3 and 96.2%. (KCL 96.2%, RUNMC 84.7%, UMCU 86.8, UCAM 87.8%, CIMH 80.3%).
Cohort characteristics
Tables 4 and 5 give an overview of the baseline sample composition. The ASD and TD groups do not differ in terms of their sex composition overall or by schedule. However, the TD group has on average significantly higher verbal, performance and full-scale IQs than the ASD group (see Charman et al., under review). This was primarily driven by fewer TD individuals with IQs in the lower average range (i.e. 75–90). Age and IQ were not correlated in either group.
Data acquisition rates
For MRI measures, acquisition rates in the ASD group ranged from 93% (structural scan) to 47% (emotion processing functional scan) and in the TD group from 96 to 60%. This difference in acquisition rates between sequences is largely explained by our hierarchy of level 1 (core) to level 3 (optional) measures, such that level 3 measures were always omitted first (e.g. when scanning started late, technical problems were encountered, or the participant expressed that he/she wanted to stop the scan session). For cognitive tests, acquisition rates ranged between 92–86% in the ASD group and 97–87% in the TD group. For EEG measures, acquisition rates in the ASD group ranged between 83–75% and 80–79%
in the TD group. These lower acquisition rates for EEG measures reflect the fact that one site (UCAM) did not acquire EEG data. For eye-tracking, acquisition rates of the four main task sets ranged between 91–86% and 91–87% in the ASD and TD groups, respectively. Two tasks that were later added to the protocol (change de-tection, emotion matching) had lower acquisition rates. Blood samples were acquired in 68% of ASD partici-pants and 73% of TD participartici-pants and ‘trios’ (i.e. par-ticipant, biological father, and biological mother) in 29% of people with ASD. Saliva was acquired in those individuals who did not wish to give a blood sample, 39% of people with ASD and 30% of TD people. Urine was given by 82% of participants in both the ASD and TD groups, and hair samples in 43% of people with ASD and 35% of people with TD.
Additional file 3 shows the data acquisition rates across the different assessment modalities and split by group and schedules.
Discussion
‘Lessons learnt’ and future directions
The scale and level of integrated phenotypic and genomic characterisation of the LEAP cohort is unprecedented in ASD research. Within a 5-year period, we have been able to comprehensively assess a large cohort of children, ado-lescents, and young adults from 6 to 30 years at two time points. As the final sample slightly exceeds the original re-cruitment target, the study (accounting for missing data and data loss after QC procedures) has the power to de-tect subgroups with medium effect sizes.
However, we also wish to acknowledge limitations of the study, and ‘share lessons’ learnt regarding the study design, recruitment, and data acquisition.
Study design It is important to allow sufficient time for study set-up, piloting of tasks, development of standard operating procedures (SOP), and training prior to com-mencing data collection. This includes dedicated periods
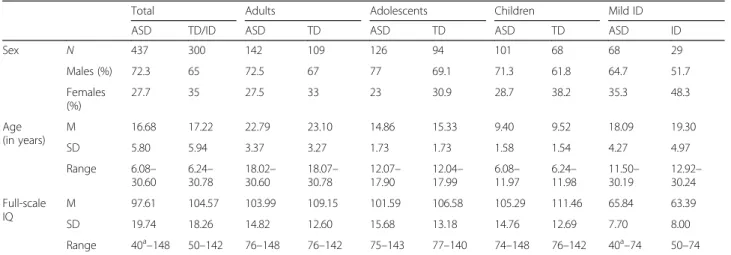
Table 4 LEAP participant characteristics; case-control cohort, by sex and schedule
Total Adults Adolescents Children Mild ID
ASD TD/ID ASD TD ASD TD ASD TD ASD ID
Sex N 437 300 142 109 126 94 101 68 68 29 Males (%) 72.3 65 72.5 67 77 69.1 71.3 61.8 64.7 51.7 Females (%) 27.7 35 27.5 33 23 30.9 28.7 38.2 35.3 48.3 Age (in years) M 16.68 17.22 22.79 23.10 14.86 15.33 9.40 9.52 18.09 19.30 SD 5.80 5.94 3.37 3.27 1.73 1.73 1.58 1.54 4.27 4.97 Range 6.08– 30.60 6.24– 30.78 18.02– 30.60 18.07– 30.78 12.07– 17.90 12.04– 17.99 6.08– 11.97 6.24– 11.98 11.50– 30.19 12.92– 30.24 Full-scale IQ M 97.61 104.57 103.99 109.15 101.59 106.58 105.29 111.46 65.84 63.39 SD 19.74 18.26 14.82 12.60 15.68 13.18 14.76 12.69 7.70 8.00 Range 40a–148 50–142 76–148 76–142 75–143 77–140 74–148 76–142 40a–74 50–74
ASD autism spectrum disorder, TD typically developing, Mild ID intellectual disability
a
There are 3 individuals with a full-scale IQ <50
Table 5 LEAP participant characteristics; twin cohort
MZ/ DZ twin pairs (at least one ASD sibling) TD twins
Twin 1: ASD Twin 2: ASD or TD Twin 1 Twin 2
Diagnosis Sex
N 36 36 15 15
ASD (%) 100 66.7 71.5 65.8
Males:female (%) 61.5:38.4 70.2:29.9 56.3:43.7 53.3:46.7
Age (in years) M 15.9 15.9 16.8 16.9
SD 4.5 4.5 2.9 2.9
Range 6–27 6–27 12–21 12–21
Full-scale IQ M 94.1 94.2 103.6 103.7
SD 19.5 19.0 13.7 12.6