HAL Id: hal-01937040
https://hal.archives-ouvertes.fr/hal-01937040
Submitted on 27 Nov 2018HAL is a multi-disciplinary open access archive for the deposit and dissemination of sci-entific research documents, whether they are pub-lished or not. The documents may come from teaching and research institutions in France or abroad, or from public or private research centers.
L’archive ouverte pluridisciplinaire HAL, est destinée au dépôt et à la diffusion de documents scientifiques de niveau recherche, publiés ou non, émanant des établissements d’enseignement et de recherche français ou étrangers, des laboratoires publics ou privés.
An analysis of cointegration relationships between world
prices of soybean products with the Granger-Engle two
step-estimation procedure
Yves Dronne, Christophe Tavéra
To cite this version:
Yves Dronne, Christophe Tavéra. An analysis of cointegration relationships between world prices of soybean products with the Granger-Engle two step-estimation procedure. [Research Report] INRA station d’économie et sociologie rurales. 1988, 24 p. �hal-01937040�
•
I.N
.
R.A.
· RENNES
8DEC
1988
C
TYD
8805
AN ANALYSIS OF
COINTEG
RA
TION REL
A
TIONSH
I
PS BETWEEN WOR
L
D PRICES
OF
SOYBEAN PRODUCTS
WITH
THE
GRANGER-ENGLE
TP~A-EU-TWO
STEP-ESTIMATION
PROCEDURE
Y. Dronne C. Tavera
Institut National de la Recherche Agronomique Station d'Economie et Sociologie Rurales de Rennes
Novembr~e 1983
1 DOCUMENTATION ÉCONOMIE RURALE RENNES
I - INTRODUCTION
In the world of time series analys is, a new concept-cointegrat ion-has recent l y appeared. At the OPPosi te of usual t ime se rie approaches which typical l y concern short -run adjustment economic flutuations , cointegr·ation concerns the
process towar-ds long-run eoui l i bri um pos itions. The general idea behind this notion i s that al th::,ughf ce1~ta1.n Pairs or grouos of variable can drif t apart in the short - run, they maY be exoected to move so that they do not diverge from each other by too great an extent, at least in the long-r-un. More orecisely, a vector Xt of economic variables is said to be cointegrated when there exists a st ationary linear combination of the levels of those variables.
Eouilibrium i s thus achieved when this combinati on i s 2e1-o. However, most of the t ime this combinat:ion of level is not zer-o and the system is out of equilibrium. In this case. stationarity of the combination of levels imolies that there is a tendency for the system to retu,-n to equilib1-iun1.
An important result of cointegration is that as was shown by Granger- and Ençile, if a set of var'i ables are cointegrat ed, tJ-1en there always exists an error correcting f ormulation of the dynamic model and vice versa. The specification c,f the dynamic adjustment towards the long-run eoui l ibr·ium is thus an errer correct ion mode l ( ECM) . The p1~ocedure used in test ing for cc,integration combines the oroblems of unit root tests and tests with parameters unidentified under the null.
GenerallY, most emoirical papers on cointegration use the two step estimation procedure-estimation of the cointegration relation in a f i r s t step then estimation of the ECM in a second t ime suggested by Granger anf Engle since this procedur-e is shcwn to give coefficients estimates which converge on the true parameter values.
This paper is an attempt to apply this procedure to the anelysis of the relationships between the Rotterdam price of soy0ean seeds, soybean oil and soybean cakes.
The cr-ushing activity Plays a centt~al role in the determinat ion of the relat ionships between the va1·-ious soybean Pr'oducts since this industry main! Y buys seeds and pr·oduces the-two other products with fixed proportions.
C'
Thej% .,two la.s t: commodi t ies concern two speci fic sectot~s and thus face two distinct demand curves. Their price fluctuate a lot and often d1~ift far apart with sometimes opposite> directions.
Such a production Process immediatelY raises two kinds of question.
.t>.t fir st, which is the strategic behavior of the crushing sector? Is i t to choose the raie of growth of i t s production in order to simultaneously influence the demand for soybeanseeds and the SUPPlY for soybean oil and meal or is i t to modify the prices for one or several of these three products according to the Prices
of the other ones? Another possibility is that EC crushers decide
to use seeds other than soybeanseeds in order to receive the EC
---crushing subsidy.
- Secondly, what kind of relationships is there between the Prices for these three commodities? The first assumption is that due to
cost pr'essures, the p1··i ce of seeds causes the prices for oil and
meal. In such a case, pr·oduci:::rs ar·e able t o pass an increase in their costs on to oil and meal consumers. The second assumption is that one of the two final products Plays a dominant role and causes the Price for seeds and for the second final product. Last l Y a third view . amounts to assume that these three markets are competitive and that EC curshers onl y have an adaptative
behavior in the long-run. Their activity is directly related to
the crushing margin and does not rely on the Price of a specific
product.
The aim of this pape, i s to highlight these two questions by exploring dynamic relationships between the weeklY Rotterdam
Prices for soybeanseeeds, sovbean oil and soybean meal wi th the
Granger-Engle cointegration testing strategy_
The l ink between the technol ogical charact erist ics of the
crushing activity and the Prices for soybean products is analysed in section II. Sorne methodological issues related to the
Gr·anger-Engle procecjur'e are discussed in the third section. The empirical results are presented in tt·,e section IV while conclue-Jing
comments are given in the last section.
II. THEORICAL BACKGROUND
The processing of a given quantity of whole soybeans produces both meal and oil ir1 relatively fixed PîOPertions. Once the amount of soybeans to be crushed has been determined, market supplies of meal and oil are fixed. They are then sold into end use markets or held as inventory. The joint-product aspect of soybean meal and oil is thus due t o the fact that meal Production and oil production are l ocked t ogether through technically fixed crushing Yields for meal ar~ oil : one unit of soybean seeds includes nearly
0 . 78 unit of meal and 0 . 18 unit of oil.
The revenue obtained by processors for soybean products depends upon the prices for~ these items and UPOn the physical rate at
which they are extracted from raw beans, largely determined by the fixed proportions of meal and oil which are locked together in the whole bean.
Assuming linear separability between seeds and other inputs Z,
the long-run optimization program of the crushers can be written
[
Max 1t (QSJ = QC.PC
with
QC = 0.78 QS
QO = 0. 18 QS
where rt are profits
+ QO.PO - QS.PS
(2.2)
( 2. 3)
OC, 00 are the produced quantities of cakes
and oil while QS is the amounts of seeds used in production. PC,
PO, and PS respectively stand for the prices of cakes, oil and
seeds.
Substiting (2. 2) and (2.3) into (2.1) , the condition for profit
maximisation in the long- run is
an
;
ao
s
= 0.78 PC+ 0.18 PO - PS 0 ( 2 . 4)Under competit:i.ve conditions, [2.4) may be seen as the optimal
pricing policy for crushers with a technology as described above.
Thus, whereas demand movements can distort the price relationship
(2. 4) in the short-run, this relationship needs to be true in the
long-run since i t is the solution to the optimization oroblem of
crushers. As a result, price data series for cakes, oil and seeds
should be compatible with such a relationship in the long-run.
Although soybean meal and oil as joint products ar-e closely
related on the SUPPlY side, their 1-espective price fluctuations
strongl y ref lect the demand influences in the short-run so that
!
I ,_
From (2.4) the seed demand function of crushers can be written
QSd = QSd (PC, PO, PS) (2.5)
By first inserting this input demand function into the
production function (2.2) and (2.3) in order to obtain the cake
S c·
and oil supply functions QC and QO~, then by assuming that demand
for oil (QOdJ and cakes (QCdJ are bath negatively related to their
own price and rnaking the hyoothesis that seed suppl y ( QSs) i s
oositively related to the Price of seeds in orde1~ to close the
model, the market clearing condit ions for the three soybean
oroducts can be written as :
= QOS (PC, PO, PS)
-
QCS (PC, PO, PS) PO, PS)=
QSS (PS) (2.6) (2.7) (2.8)Linearizing these markets clearing condition around equibrium
gives
[
PO=
ai
·
~c
PC=
!31_~0 PS=
r
1.PO + + +a
2.~s
!3 ~. PS ",c. •r
2.PC (2.9) (2. 10) (2.11 )Where PO, PC, PS are the price growth rates (P = ~P/P) for
oil, cakes and seeds, and the a, !3 and "l"'s coefficients are
function of the various direct and cross demand and supply
elasticities for every comrnodity <1>.
( 1 ) Since the a, !3 and "j"s c o e f f i c i e n t s are easy to derive they are
not d e t a i l e d i n the paper. 11-f 1 ,J<. l_,1 I I
The system of price relationships (2.9) ( 2. 11) can be seen as describing price variations for the three products in the
short-run. However these relationships have to be modified on the
ground of the two following remarks.
- First, equilibrium conditions such as (2.6) - (2.8) do net hold
instantaneously and equations (2.9) (2.11) have to be made
dynamic in order to capture adjustment mechanisms.
- Secondly since the price relationship (2.4) needs to be true in the long-run, departures f rom this equi l ibrium relat ionship must be included in equations (2. 9), (2.10) and (2.11) as an er,~or
correction mechanism. This errer correcting ensures that the
system ultimately converges towards the long-run relationship
( 2. 4).
Due becomes
____.,,
to these remarks, the system
ao(L) .P0 = al (L).PC + a2(L) .PS + a3.ECM
(2.9) (2.11)
(2.12)
(2. 13) (2.14)
where the a(L), B(L) and r(L) are now lag polynomials and ECM = (PG - 0. 78 PC - 0.18 P0 ) is the errer correcting term.
now
Stochastic versions of the orice relationships (2. 12), (2. 13),
(2.14) will be estimated with the Granger-Engle procedure for
cointegrated equations. This procedure is particular'Y adapted in
this case since the profit maximisation condition is a long-run
equilibrium condition and that short-run price relationships must
natural method for analysing the stochastic version of system
(2.12) - (2.14) i s'1to~first check that prices of soybean products
/
are cointegrated with a cointegrating vector equal to the meal and
oil extraction rates then to estimate equations (2.12), (2.13) and
III. COINTEGRATION GENERAL PRESENTATION AND TESTING PROCEDURE
Let Xt be a vector of N component t ime series. Xt is said to
be integrated of order· d (denoted Xt - I(d)) if the d differenced
vector series is a zero mean, purely non deterministic stationary
process, so that there is a Wold r epresentation
é.
t
where C.
t is an N X 1 zero mean white
contemporaneous correlations E ( é. t E (c. . c.' ) = G for t = s . Equation t s C. ) s ( 3 . 1 ) ( 3. 1) noise vector :::: 0 for t is normal ized
C(o) = IN, the unit matrix.If Xt - I(d), then Xt will
wi th onl y s by and taking be said to_
--b.e.. cointegrated of order d, b, (denoted Xt - C I (d,b)) i ·f t here
exists a vector B such that
(3.2)
is integrated of order (d-b) with b
>
O. The vector Bthe cointegrating vector.
In this case, the relationshiP
B'
(3.3)is called
must be considered a long-run equilibrium relationship perhaps
as suggested by some economic theory - and Ztgiven in (3.2) thus
measures the extent to which the system Xt is out of equilibrium
and can thus be called the eouilibrium errer.
There is an int imat e connect ion between cc integrated series
been shown in Engle-Granger <1> t hat if the components of Xt are cc-integrated of ordre d, b, t here exists a generati ng mechanism having the general "errer correcting f orm" <2>
A(B)
*
with À. -,1. 0, A(O) ==IN and l t\
the unit cir-cle. It sr1ould be
in p0wer's of B, has no t e,-rn in the right hand side.
(
(,.)
)
l
= 0 has all ~ t i t s ( 3 . 4) roots outside noted that [1-(1-B) bJ,
if expanded Bo and so only lagged zt occur onWhereas the above definition of cointegration refers to the
most gener··al case, much of the theory of cointegration has been
developed for the case where all the series are I(l) since most econornic time series are effectively I(l). In such a oarticular case, the error correction form (3.4) reduces to
flX
t - - zt-l + Lagged (fl X t ) + d (B) (3. 5)
It c.learly aooears from (3.5) that if the comoonents of Xt ar~e I ( 1) and cointegrated, there must be Gr-anger causa l i ty betwee.-n t hese ser·ies in at least one direct ion as the overal l set of series can help forecast each variable.
( 1) Engle - Granger ( 1987) General Representation Theorem,
<2> More p r e c i s e l y ,
a r e l a t i o n s h i p but
an ECM such as (4)
not only must cointegrated variables obey such the reverse i s a l s o true and data generated by
This can be made clearer by assuming that Xt has only two components xt and Yt which are both 1(1). In this case the general ECM representation (3.5) reduces to
ti. y
=-t ( /1 X t '
where zt = xt
-
b. yt and j;\.1 from this last condition that
/1 y ) t + d ( B) /1 y ) t + ci ( B) + l À l ~
o.
2 xt and yt are I l t It immediatly related by a (3.6a) (3.6b) follows Granger causal link since 2t-1 must occur in at least one eouation and this knowledge of improve forecastability of at least one of X t ,
the ECM by
( 1 )
Further more, t he presence of the lagged terms in a second source of causation of by yt .
- J or of
The gener·-al. method for anal ysing cointegrat ion pre.sented by Engle and Granger involves two steps. The order of integration of the various variables is first determined in a preliminary stage. Cointegration is then tested in the firsl step of the procedure while the second step is devoted to the determination of the r-e levant ECM.
In a preliminary stage, i t is necessary to begin by testing the level of integr·ation of the components of Xt by using the Dickey-Fuller (DF) and an Augmented Dickey-Fuller (ADF) test.
(1) As was pointed out in Granger (1986) t h i s connection between
c o i n t e g r a t i o n and c a u s a l i t y implies t hat i f X
t and y t are a pair
of pric es from a
be coi ntegrated.
imply that once
j o i n t l y e f f i c i e n t s p e c u l a t i v e market, they cannot
Clearly from ( 3 . 6 a ) and (3.6b) c o i n t e g r a t i o n would pri ce can be used to help f o r e c a s t the other and the e f f i c i e n t market assumption would thus be v i o l a t e d .
These are both t tests and rely on r ejecting the hypothesis that
the series is a random walk in faveur of stat ionari ty this
requires a negative and significant test stati stic. However, the
test-statistic does not have a t distribution but tables of significance levels have been orovided by Dickey and Fuller
(1981) .
- Cointegration is then tested in a first steo. In this respect,
if each component is exoected to b~ I(d), we first fo,-·m
the "c.ointegrat ion regr-ession
N = f31+ L f3 . •
i=2 1
( ,3. 7)
then we test if the ,-esidual appears to be I ( o) or not . It
might be noted that when Xt is cointegrated, this regression when
estimated using OLS should gi ve an excellent estimate of the true cointegrating coefficients in large samples. In order to test for the stationarity of ut, two simple tests of the null hypothesis
H
0 Xt not cointegrated
are based either on a Durbin Watson s t a t i s t i c (CRDW) <1> for (3.7) b6tt testing if CRDW is significantlY greate,- than zero, or using
the previouslY mentioned Dickey-fuller test for üt.
- When Xt aooears cointegrated of or-der sa Y ( d-b), the second step
is t o construct an ECM representation similar to (3.5) where Z is
the deri ved residual from the cointegrat ion regression ( 3. 7) . The
relevant ECM f onn is determined following the "general to simple"
modelling methodology proposed by Hendry <2>.
( 1) This coint egrating r e g r e s s io n Durbin Watson (CRDW) s t a t i s t ic
i s derived from Sargon and Bhargava (1983).
Both the steps require only least squares and this two-step estimator is just as efficient as the maximum l i kelihood estimator based on the know-value of 6 <1>. The advantage of such a procedure lies i n the fact t hat the dynamics do not need to be
speci f ied unt i l the error correct ion structure has been est imated.
In this paper, cointegration will be tested between the
Rotterdam weekly prices of soybean seeds, soybean oil and soybean
cakes. Ser~ies retained are PS : the CIF Rotterdam price of soybean
seeds which is representative of t1·1e price paid by EC
processor·s cr·ushing located in the North of EC PC the CIF
Rotterdam price of US soybean cakes (44 % protein) which is
representative of the crusher supply price for soybean meal and PO
the Dutch FOB ex Mill price of soybean oil which is
representative of both the EC internal price and the export price
for this product.
Al l price ser'ies ar-e weekl y and for the period 1981. l . 1. to 1987.7.16.
IV. EMPIRICAL RESULTS
In this section cointegration i s analysed for the t r i p l e t (PS, PC. PO) according to the two steps procedure out l ined in the pr-eceed i ng section.
In a pr·el:iminary stage, we f i r s t consider the time ser·ies
behaviour~ of each of the individual ser·ies. Table 1 r·eports the>
Dickey-Fuller lDF) and Augmented Dickey-Fuller (1\DF) Stat:istics
for the f i r s t and second differences of the three series.
Table 1. The Time Series Procerties of the Variables
Variable DF S t a t i s t i c ADF S t a t i s t i c
llPO) (-1,01; -1.04. -0.76) (-0,93; -0.96;-0.78)
(-11.02; -12.93; - 14..28) (-7.21; -7.36: -7.61)
The DF and ADF r··egressions with f i r·st differences lead to
negative but non s ignificative t s t a t i s t i c s . At the opposite, r·unning the same models with second differences gave negative and significative t s t a t i s t i c indicating the f i r s t difference of each
serie i s stationnarY [each serie i s I (1)).
In a f i r s t stec we sear-ch f or· a linear cornbination of the
three I ( l ) se1~ies that i s i t s e l f Ilo) by running cointegr·ating regressions between eacr, combination of the levels of the three
Table Al in Annexe t"eports the estimates and the tests
obtained with each combinat ion and table A2 gives the
corresponding cri tical values. While we ar·e unable to reject the
hypothesis that every pair of the three variables are not
cointegrated, the three vc:ir-iables PS, PC and PO do fü.,pear as cointegrated and the corresponding cointegrating regression is
PS = 0.93 (0.39) 2 R = 0.97 + 0.78 PC l74. 06) + IJ.175 PO (68.9) CRDW = 0,65 DF = -5.50 ( 4. 1 ) ADF (4) - - 4.21
ln this case, the CRDW, DF and ADF s t a t i s t i c s are well above their ,~espective critical values so that we cannot reject the hypothesis that these variables are not cointegrated even at the 1 % level of significance.
Such resul t s seem to show that f i r s t i t i s not possible to i solate a biva,~iate long-run ,~e1ationsriip between the Pt'ices of these commodities. Cointegrat:ion i s always r·ejected by the data when taking into accoui1t onl y two price series. This is 7'ullY consistent with the long-run price relationshiP (2.4) derived from the profit maximization problem of processors. EC soybean crushers do not seem to focus on a speci fic product or on a pair of products. Taken two bY two. prices for soybean products are not cointegrated and i t does net seem possible to agree with the view that the behavior of the EC soybean cr·ushers is to focus on sol el y a given commodity or a pair of commodities.
At the opposite, when taken simultaneously, the prices for the
t hree commodities do seem to be cointegrated. In eouation (4.1),
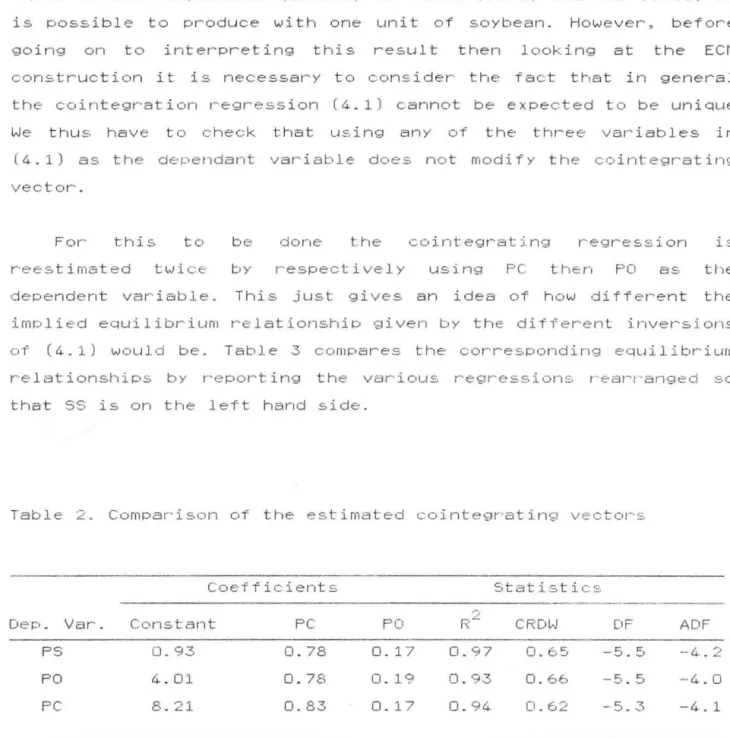
equal to the respective ouantity of cakes (0. 78) and oil l0. 18) i t is possible to produce with one unit of soybean. However, before goi ng on to interpret ing this resul t then looking at the ECM construction i t is necessary to consider the fact that in general the cointegration regression (4.1) cannot be expected to be unioue
We thus have t o check that using any of the three variables in (4.1) as the dependant variable does not rnodify the coi ntegrating vector.
For' this to be done the cointegrating regression is reestimated twice by respectivel y using PC then PO as the dependent variable. This just gi ves an idea of how di tferent the imolied eouilibrium relationshiP given by the different inversions of (4.1) would be. Table 3 compares the corresponding equil ibrium relationships by r-eporting the various r-egressions rear-r-anged so that SS is on the left hand side.
Table 2 . Comparison of the estimated cointegrating vecto,-s
Coefficients Statistics
,;,
Dep. Var. Constant PC PO R- CRDW DF ADF
PS 0.93 0.78
o.
17 0.97 0.65 -5.5 -4.2PO 4.01 0.78
o
.
19 0.93 0.66 -5. 5 -4. 0PC 8.21 0.83 0. 17 0.94 0.62 -5. 3 -4.1
The three variables always appear to be cointegrated and only the coefficient of the constant terrn is highlY sensible t o the
choice of the dependant variable.The coefficients attached to
var-iables PC and PO in each of the rear-ranged regressions are always quasi equal to the rneal and oil extraction rates.
Such r-esults tend to confirm that there exists a long-run
equilibrium relationship between the Prices for the three soybean
Pt~oducts which reflects the fixed proportions of meal and oil
which are locked together in the whole bean. This i s fully
consistent the joint-product aspects of soybean meal and oil.
Soybean meal and soybean oil are essent ial l y independant of
each other in use and the economic forces underlying the de-mand
for meal are largely unrelated to those underlying the demand for
oil. However the joint product-aspect of meal and oil production
ensures that the supplies and the prices of these commodities are
tied very closelY together in the long-run. A 1 % increase in meal
production will automatiquely result in a 1 % increase in oil
production due to constant extraction r'ates. P,s a result, a r~ise
in say the price of meal due for instance to an exogenous shift in
demand will incr~ease the crushing dema11d and will ultimately lead
to an higher oil SUPPlY which will push oil prices downwards.
For instance. an exogenous increase in the
cakes Apc
>
0 will have two distinct effects onas can be seen from equation (4.2)
Apo 1 0.78
o
.
175 0.175price:: of soybean
the price of oil
( 4. 2)
The f i r s t effect i s a direct cost-push effect due to the
increase in cake supply following the rise in the price of cakes,
the demand for bean i s increased and the price for bean i s thus
pushed upwards by an amount APS/APC
>
O. This will tend toincrease the pr~ice of oil proportionaly to the oil extraction
rates as shown by the f i r s t te,~m on the r:i ght side of equat ion
(4. 2) . The second effect cornes from the joint-product aspects of
soybean meal and oil by producing more cakes, the curshing
sector automaticallY produces more oil and thus pushes the oil
respective oil and meal contents of bean as shown by the second
member of the right side of equation (4.2) . The conclusion i s that
there i s evidence of equilibrium level relationships between the
orices of soybean pr-oducts considered here. In the long-run, the
price level of these commodities thus do not significantly depart
from each other. Further more this long-run relationships seems
mainly due to the joint product aspect of meal and oil production
since the two coefficients of the cointegrat ion regression Just
equal the meal and oil ex tract ion r·ates. The entir·0- system (bean,
oil and meal) thus moves towards a long-run equilibrium in a
simultaneous manner- 1,,.1ith a l l sectors interacting with one another··
and cointegration regression is Just the optimal pricing policy
for crushers under comPetitive conditions.
Having achieved a suitable specification of the cointegrating
equation we can proceed to the second stage of the Granger and
En.,;ile procedure. If we define ES, EC and EO to be: the derived
redisuais from cointegrating regr·essions obtained w:i
t.;r,
respectively SS. SC and SO as the dependant variable, we may then
include these r,::disuals in a standar·d ECM model . A 1=airly sim1.:,le
search procedure produced the following equations
= 0,184 (3. 47) hps -t-2 0,178 hpst-4. (-2.02) - 0,160 (3. 16) hPst_ 14 + 0,030 hpot_3 (2. 37) + 0,6.27 hPCt-t, (4.41) • 0, 151 llpct--S (-2.41) -- 0,131 llps (-2.47) t -6 + 0.037 (2.57) hpQ t-6. DW = 1. 9.5 Q (47) = 38.69 SEE= 6 .62 -0.178 EOt-l (-3.97) 0.308 hpot-l (-4. 78) 0.136 hpot_ 2 (-2.23) (3.2)
+ 0.872 ôPS + 0.924 ôPSt_ 2 (3.39) t - l (3.66) - 0.79 ôPCt_ 14 (-3.02) + 0.456 ôPSt_ 4 (2.09) (3.3) DW =- 2.02 ; Q(49) = 30. 22 SEE= 27.69 ôPC t = -0.065 ECt- l + 0.269 Apct_4 (-1.80) (4.97) - 0.100 tipct-s (-1.91) -0. 111 ôPCt-S -0. 101 tipst_6 + 0.112 ôPSt-lO (-2.06) (-2.33) (2.28) -0.091 ôPSt_ 14 -0.0275 ôPOt-l O (-2.10) , (-2.43) (3. 4) DW = 1. 93 Q(48) = 30.58 SEE= 5.56
Where DW, 0 and SEE are resoectively the Durbin Watson test.
the LJung-Box tes t for a r andom correlogram and the standard errer of estimates.
Only the soybean oil and soybean meal eouations include
signi. f icat ive l agged leve-ls. These ter~ms-, are of the aooropr'iaté
signs and sizes for er-ror correction t erms and are individually signifi cant or nearly so (an F test for the nullity of the errer, correction term in equation l l l ) yiel ded a F statistic close to
3.25 with a significance level equal to 0.072) .
On the ground of the se three eouat ions, there appear to be
general interactio1·1 among the t hree orices since every pr'ice is
influenced by the two others ones. Within each eouation, the sum
of lagged terms on every variable is always lower than the
coefficient s derived from the cointegrat ion regression thus
showing that adjustement towards the cointegrati on relationships
FinallY, the structure of delays seems to show that while variations in the prices for soybean oil or sooybean meal are bath
transmitted to the Price of seeds with an average lag close to
nearly 3 .5 weeks, movements in the price of seeds are more quickly
transmitted to oil consumers (average lag close to 2 weeks) than
V. CONCLUDING REMARKS
In this paper, the Granger-Engle cointegration analysis procedure was used in order to chek wether there exists a special relat ionshiP between the prices for soybean products due to the joint-product aspect of meal and oil production.
EmPirical r-esul ts
,~e i at ionshiPs between
and soybean meal which
extraction rates. The
suggest that there is an equil ibrium
the prices for soybean seeds, soybean oil
production
relat ionshir:,
seerns
coïncides with the oil and meal constant
joint product aspect of meal and oil
be responsible for such a long-r-un
the prices for the oroducts since althought
to between
taken tvJo by two, Pr"ices cointegrated, cointegration
is net rejected by the data.
for· soybean products never appear' as
between prices for the th1~ee products
Three conclusions can be drawn from this result. At first, due
to the link between cointagration an errer correction mechanism,
results from unrestricted vectorial autoregressive analysis of
soybean product prices are to be taken with caution. SecondlY, the
estimated cointegration regression seems to show that a 1 %
increase in the price for soybean seeds can be exoected to lead to
a l % increase in the prices for bath soybean oil and soybean meal in the long-run. Lastly, due to t he joint-pr'oduct aspect of meal
and oil production, the long-run effect of a r i s e in the price for
soybean meal (oil) is a decr-ease in the price for' soybean oil
(meal ) which is strictly proportional to the respective oil and meal contents of soybean seeds. In the long-run, t he prices for~ soybean meal, soybean oi l and soybean seeds co-f luct uate wi th price ratio strictly proportional to meal and oil extraction rates.
Lastly, a related issue is that the Rotter-dam markets for soybean seeds, soybean oil and soybean meal do not seem to be
efficient markets since cointegration impl ies that information
concerning the prices for two of these commodities can help
REFERENCES
Box, G. E.P. and Jenkins, G. M. [1970) . Tirne series analysis
forecasting and control, San Francisco, Holden Day.
Campbell, J .-Y. and Shiller,
Cointegrabo·d Models''. Journal of
vol. 12, PP- 505-522.
R. J.
Economie
Dickey, D. A. and Fulle,~, W. A. (1981).
S t a t i s t i c for Autoregressive Time Series
Econornetrica, Vol. 49, PP. 1057-72.
( 1988) . "Int e1~p,~et ing
Dynami es and Control,
"Trie like l ihood Ratio
with a Unit Root".
Dr·onne, Y. and Tavera. C. (1988). "Dynamic Price relationships in
the EC sector for o i l and protein". An expanded information
causality analysis. INRA Discussion caper. 33P.
Granger-, Economie
vol. 48,
C.W.J. (1986). "Developrnents in the Study of Cointegr'ated
va,~iables", Oxford Bulletin of Economies and Statistics,
n~3, PP. 213-228.
Granger, C. W. J . ( 1988) . "Sorne recent
causality", Jou,~nal of Econometrics,
developrnents vol. 39, PP-in a concept 199-211. of G ,~ c:l n g e r , C . W . J . and En g l e , R . F . ( 198 7 ) . " Co - i nt e gr a t i on and
Err--or~-Corre-ct ion r•epr·esent a t ion, estimation and Test ing",
Econometrica, vol.55, n°2. pp. 251-276.
Hend,~y, O.F.
Econometrics",
Par.:-ers 1.
( 1986). "Empir·ical Modelling in Dynamic
Uni ver s i ty of Oxford Appl ied Economies Discussion
Sa,~gan, J . D. and Bhargava, A. ( 1983) . "Test ing Residual s frorn
Least Squares Regression for being generated by the Gaussian
ANNEXA
Table Al. Sear'ch for~ an equilibriurn relationship from
cointegrating regression
Estimated coefficients Test Statistics
DeP. Var. est PC F'O PS R2 CRDW DF ADF(4)
PS 70. 67 0.87 0.57 0.031 -1.24 -1.69 (8.31) (21.4-1 ) P'3 1.50.21 0.20 0.51 0.060 -2.35 -2.28 (27.31) (18.91) PO 397. 48 0.51 0.01 0.040 -1.22 -1.51 (8.49) (2.27) PS 0. 93 0.78 0.175 0.97 0. 65 -5.50 -4.21 (0.38) (74. 07) (68. 90) PO 21.32 -4.13 5.32 0.93 0. 66 -5.52 -4. 14 PC 9 . 88. -0.21 1. 20 0.94 0.62 -5.27 -4.01 (3. 36) (-4.6. 56) (7( .. ,07)
Table A2. Critical values for the CRDW. DF and ADF tests
1 % 5 ?'ê) 10 %