HAL Id: hal-02123339
https://hal.archives-ouvertes.fr/hal-02123339
Submitted on 15 Nov 2020HAL is a multi-disciplinary open access archive for the deposit and dissemination of sci-entific research documents, whether they are pub-lished or not. The documents may come from teaching and research institutions in France or abroad, or from public or private research centers.
L’archive ouverte pluridisciplinaire HAL, est destinée au dépôt et à la diffusion de documents scientifiques de niveau recherche, publiés ou non, émanant des établissements d’enseignement et de recherche français ou étrangers, des laboratoires publics ou privés.
Neutron-rich
20O Isotope from Experiment with the
AGATA+PARIS+VAMOS Setup
M. Ciemala, S. Ziliani, F. Crespi, S. Leoni, B. Fornal, A. Maj, P. Bednarczyk,
G. Benzoni, A. Bracco, C. Boiano, et al.
To cite this version:
M. Ciemala, S. Ziliani, F. Crespi, S. Leoni, B. Fornal, et al.. Determination of Lifetimes of Excited States in Neutron-rich 20O Isotope from Experiment with the AGATA+PARIS+VAMOS
Setup. Zakopane Conference on Nuclear Physics, Aug 2018, Zakopane, Poland. pp.615, �10.5506/APhysPolB.50.615�. �hal-02123339�
Vol. 50 (2019) Acta Physica Polonica B No 3
DETERMINATION OF LIFETIMES OF EXCITED STATES IN NEUTRON-RICH
20O ISOTOPE FROM EXPERIMENT WITH
THE AGATA+PARIS+VAMOS SETUP∗
M. Ciemałaa, S. Zilianib,c, F. Crespib,c, S. Leonib,c, B. Fornala A. Maja, P. Bednarczyka, G. Benzonic, A. Braccob,c, C. Boianoc
S. Bottonib,c, S. Brambillab, M. Bastd, M. Beckersd T. Braunrothd, F. Camerab,c, N. Cieplicka-Oryńczaka E. Clémente, O. Dorvauxf, S. Ertürkg, G. De Francee A. Goldkuhled, J. Grębosza, M.N. Harakehh, Ł.W. Iskraa
B. Jacquote, A. Karpovi, M. Kicińska-Habiorj, Y. Kime M. Kmiecika, A. Lemassone, H. Lie, I. Mateak, K. Mazureka
C. Michelagnolil, B. Millonc, C. Müller-Gatermannd P. Napiorkowskim, V. Nanaln, M. Matejska-Mindam M. Rejmunde, B. Sowickia, Ch. Schmittf, M. Stanoiuo, I. Stefank
B. Wasilewskaa, M. Zielińskap, M. Zięblińskia
aInstitute of Nuclear Physics Polish Academy of Sciences, 31-342 Kraków, Poland bUniversità degli Studi di Milano, Via Celoria 16, 20133, Italy
cINFN, sezione di Milano, Italy dIKP Cologne, Cologne, Germany
eGANIL, CEA/DSAM and CNRS/IN2P3, CAEN Cedex 05, France fCNRS/IN2P3, IPHC UMR 7178, F-67037 Strasbourg, France
gNigde University, Turkey
hKVI — Center for Advanced Radiation Technology, Groningen, The Netherlands iJINR, Dubna, Russia
jFaculty of Physics, Warsaw University, Warszawa, Poland kIPN Orsay Laboratory, Orsay, France
lInstitut Laue-Langevin (ILL), Grenoble, France mHeavy Ion Laboratory, University of Warsaw
Pasteura 5A, 02-093 Warszawa, Poland
nDepartment of Nuclear and Atomic Physics
Tata Institute of Fundamental Research, Mumbai 400005, India
oIFIN-HH, Bucharest, Romania
pIRFU, CEA/DRF, Centre CEA de Saclay, 91191 Gif-sur-Yvette Cedex, France
(Received January 23, 2019)
∗
Presented at the Zakopane Conference on Nuclear Physics “Extremes of the Nuclear Landscape”, Zakopane, Poland, August 26–September 2, 2018.
An experiment aiming at measuring lifetimes of the second 2+ excited states in neutron-rich C and O isotopes was recently performed at the GANIL laboratory, in France. In these nuclei, recent ab initio calculations provide a detailed description of the nuclear excited states, predicting a strong sensitivity of the electromagnetic transition probabilities to the de-tails of the nucleon–nucleon interactions, especially in connection with the role played by the three-body (NNN) forces. Thus, the measurement of 2+ states lifetimes in this region will be a stringent test of the importance of including the NNN forces in describing the electromagnetic properties of selected nuclear states. This contribution reports on the status of the experimental analysis for the case of lifetimes in20O.
DOI:10.5506/APhysPolB.50.615
1. Introduction
Aim of the measurement was to determine the lifetimes (in the range of hundreds of femtoseconds) of the excited states in neutron-rich C and O isotopes, in particular in 16C and 20O. For these nuclei, ab initio cal-culations predict a strong sensitivity of selected electromagnetic transition probabilities to the details of the nucleon–nucleon interactions, especially to the three-body term. Strong sensitivity is expected, in particular, in the case of the second excited 2+ state, in each nucleus of interest. For exam-ple, the calculated value of the 2+2 state lifetime in O20 is equal to 320 fs
(with NN interactions), compared to 200 fs, obtained including NN + NNN interactions [1,2].
The experiment was performed in the GANIL laboratory, with a com-bined detector setup including the segmented HPGe detectors of the AGATA tracking array [3, 4], the VAMOS spectrometer [5] and the PARIS scintil-lator-based calorimeter [6]. In order to cover the lifetime range of interest (below 500 fs), the technique involving the γ-ray lineshape analysis (DSAM — Doppler-Shift Attenuation Method) was used.
2. Experimental details
The nuclei of interest were populated in the deep inelastic processes in-duced by an18O beam at 126 MeV (7.0 MeV/u) on a181Ta target, 6.64 mg/cm2 thick (4 µm). The beam energy at the center of the target was ∼ 116 MeV, i.e. 50% above the Coulomb barrier, and the projectile-like products had v/c ∼ 10%. The experimental setup contained 31 AGATA crystals placed at backward angles with respect to the entrance of the VAMOS spectrome-ter (from ∼ 120◦ to ∼ 175◦) and two PARIS clusters (one with LaBr3
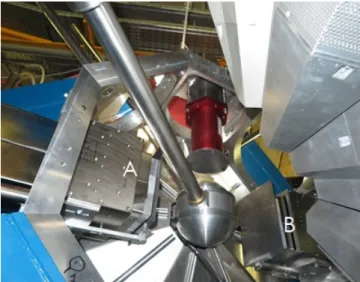
:NaI-and the second with CeBr:NaI-type phoswiches) with two additional large volume LaBr3 detectors at ∼ 90◦ (Fig.1).
Determination of Lifetimes of Excited States in Neutron-rich20O Isotope . . . 617
Fig. 1. Photograph of the experimental setup. The letters A and B mark the PARIS clusters containing LaBr3:NaI and CeBr:NaI phoswiches, respectively. Above (and
below) the reaction chamber, there are placed two large volume (3.500× 800) LaBr 3
detectors. On the right-hand side photo, there are visible the AGATA modules.
The VAMOS spectrometer was placed at the maximum (45◦) angle with respect to the beam axis. Its focal plane contains:
— four drift chambers, which give information on xf, yf position for the
reconstruction of the θf, φf angles;
— segmented (six columns, four rows) ionization chambers measuring the ion energy loss ∆E;
— plastic scintillator at the end of the focal plane, which gives: trigger signal, particle energy E and time with respect to the radio frequency (RF).
Moreover, two additional pairs of drift chambers were put at the entrance of VAMOS (20 cm from the target) for a better determination of the ions en-trance θ, φ, which was done to improve the γ-ray Doppler correction [7]. The γ decay of the identified reaction products was measured with the AGATA array and the PARIS detectors. Using the velocity vector ~v reconstructed in VAMOS, a Doppler correction was applied to the γ-ray spectra. Calibration and fine tuning of the AGATA detectors is presented in [8].
3. Data analysis
In order to apply the DSAM method in the present experiment, it is very important to precisely determine ~v of the ions which emitted γ rays. For this purpose, all of the VAMOS focal plane detectors were calibrated and tuned. These are the main adjustments that have been performed:
— gain matching for the drift chamber wires;
— energy calibration of the ionization chambers and check of their sta-bility during the time of the experiment;
— time and energy calibration of the plastic detector. Then, one can obtain ions velocity v by
v = D/T ,
where D is the ion path length from the target to the plastic detector and T is the time of flight calculated as a difference between the RF signal of the cyclotron and the plastic detector time-signals (time between following beam pulses was equal to 102 ns).
To be sure that the ions time-of-flight value is correct, one has to check if the masses obtained using this time are reconstructed in the proper way. Unfortunately, the masses are calculated using (M/Q) × Q, which is corre-lated to both time and energy. Therefore, one has to simultaneously check time and energy calibrations. Firstly, (M/Q) is calculated
M/Q = Bρ
3.105γβ,
where Bρ is reconstructed using the dedicated library (libVAMOS) from the θf, φf values, Bρref (which was equal to 0.75 Tm for this experiment) and
the VAMOS response function. Then
M0 =
Etot
931.5016(γ − 1), Q = M0/(M/Q) ,
where Etot is total energy (sum of ∆E measured by ionization chambers and E from plastic detector) and M0 is mass extracted from total energy.
Finally, the reconstructed mass Mr is Mr= M/Q × Qint,
Determination of Lifetimes of Excited States in Neutron-rich20O Isotope . . . 619
To choose ion’s atomic number Z, one has to select the corresponding region in the ∆E–Etot matrix (Fig.2, with gate on the Z = 8 region). Using
the technique described above, the plot of Q versus Mr can be obtained.
Such a plot for Z = 8 is shown in Fig. 3 — here, two oxygen ions charge states are visible, with Q = 8 and 7.
Fig. 2. ∆E–Etot plot with region corresponding to Z = 8 selection (part of data).
Fig. 3. Plot of ions’ charge Q versus their mass A reconstructed using the VAMOS focal plane detectors (part of data). (For better readability, the formula Mr =
M/Q × 8 was used, so masses for Q = 7 are shifted.)
By checking product intensity as a function of mass for Z = 5 to 9, very good agreement with the expected mass distribution was observed: this means that the time and energy calibration of the VAMOS focal plane are done properly. Figure4shows the populations intensity of the ions identified in this experiment.
Fig. 4. Graph presenting the population of detected and identified ions during the experiment.
Check of the stability of the reconstructed masses values (Mr) in the course of measurement was also performed. The upper panel of Fig.5shows the evolution of the reconstructed 18O ion mass with respect to the time of the experiment. A drift is visible with the same pattern as drift of the PARIS time-signal with respect to RF (middle panel of Fig.5). In consequence, by applying a correction to the ion T extracted from PARIS time vs. RF, one can obtain a better stability of the reconstructed masses (bottom panel of Fig.5).
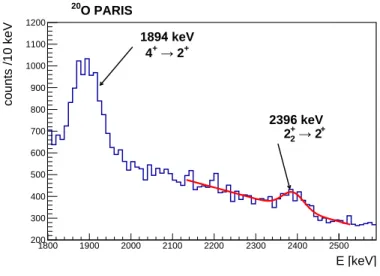
For PARIS detectors, the energy calibration was done with the use of standard 60Co,137Cs,152Eu γ-ray sources as well as AmBe–Fe for calibra-tion points in the high-energy region (up to 7 MeV). Gating on the 20O ions and the proper PARIS time with respect to RF signal, the Doppler-corrected spectrum in Fig. 6 was obtained, with 2+2 → 2+1 (line of interest) and 4+ → g.s. transitions visible. PARIS data will be used for measuring the γ-ray angular distributions, providing a reference point for the angle around 90◦.
Finally, in Fig. 7, the Doppler-corrected AGATA γ-ray spectrum gated on20O is presented: the transition of interest, 2+2 → 2+1 2396 keV, is clearly displayed. The potential of the present measurement in accessing the lifetime of the transition of interest is shown in Fig.8. Here, the relative differences between the measured and the tabulated γ-ray energy for 2+1 → 0+ and
2+2 → 2+1 transitions in 20O, detected at three emission angles (120◦–140◦, 140◦–160◦and 160◦–180◦), are presented. For the 2+1 → g.s. line, the average difference is 0, since its emission occurs outside the target, while for the 2+2 → 2+1 line, a deviation from tabulated energy, increasing with increase of the angle, is visible. The same trend is observed for the 18O transition with known lifetime of 27 fs [8, Fig. 4], and other short (below ∼ 300 fs) transitions in the O region (for example, for the 7/2+ level in 19O with lifetime of 92 fs).
Determination of Lifetimes of Excited States in Neutron-rich20O Isotope . . . 621
Fig. 5. Upper panel: reconstructed 18O mass drift during the experimental time.
Middle panel: PARIS detectors time-signal with respect to the RF, with the same drift pattern. Bottom panel: reconstructed18O mass with the RF drift corrected
1800 1900 2000 2100 2200 2300 2400 2500 E [keV] 200 300 400 500 600 700 800 900 1000 1100 1200 counts /10 keV 20 O PARIS 2396 keV + → 2 2 + 2 1894 keV 4+→ 2+
Fig. 6. PARIS Doppler-corrected γ-ray spectrum for20O ions.
Fig. 7. 20O Doppler-corrected γ-ray energy spectrum measured with AGATA
(inset – 2+2 → 2+1 transition).
To extract the value of the lifetime from the experimental data, simula-tions with variable lifetime and γ-ray energy are needed. Varying the γ-ray energy is necessary because of the lack of precise determination of its value for the 20O 2+2 → 2+1 transition in literature [9,10].
The simulation process is divided into five stages: — Event generator:
The beam is passing through the target decreasing its energy.
Multi-nucleon transfer is taking place with linear probability in the target.
Determination of Lifetimes of Excited States in Neutron-rich20O Isotope . . . 623
After the reaction, the kinetic energy of the fragments is calculated assuming the excitation of both fragments (tuned by experimentally measured ions velocity distribution).
An excited level is let to decay with fixed lifetime τ , emitting γ rays isotropically, with a Doppler shift calculated using the current ion velocity. If the emission occurs inside the target, the ion is processed to the end of target.
γ-ray and ion energies and directions are written to the output file. — AGATA simulation:
The data produced in the previous step are used as input to the AGATA simulation package [11], which is being configured for the GANIL 31 AGATA crystals detector geometry. As output, the energy deposited in the AGATA crystals, together with the velocity vector of every γ-ray emitter, is written.
— AGATA tracking:
AGATA simulated data are tracked (the same as experimental data) and Doppler corrected. The output is written as: γ-ray energy, detec-tor_ID, relative theta between γ-ray and ion and ion velocity.
— Adding detector response:
Experimentally extracted energy resolutions for the AGATA crystals and differences in counting rates are being included in the simulated data.
— Comparison:
Simulated data are compared to experimentally measured γ-ray spec-tra calculating χ2.
4. Conclusions and outlook
Gamma-ray energy shifts of the 2+2 → 2+1 transition in20O, displayed as a function of the angle between the γ-ray direction and the ion velocity, showed sensitivity of these shifts to the lifetime of the 2+2 excitation (Fig. 8) and indicated that it is below ∼ 300 fs. It has also been verified that the statistics collected for the 2+2 → 2+1 transition in 20O is sufficient to determine the lifetime of the second 2+ state by using the line-shape technique.
Simulations of the line-shape as a function of lifetime and transition energy have been developed. Finally, two-dimensional (lifetime and γ-ray energy) minimization of χ2 constructed as comparison of experimental and simulated 20O γ-ray lineshapes will be performed. This will lead to the determination of the lifetime value of the second 2+ state in 20O.
110 120 130 140 150 160 170 180 −0.1 0 0.1 0.2 0.3 0.4 Theta [◦] Eg (tabulated) − Eg (measured) Eg (tabulated) [% ] 1674 keV: 2+ 1→g.s. t = 10..5 ps 239 6 keV: 2+2→2+1
Fig. 8. Relative differences between measured and tabulated energies as a function of the emission angle for 2+1 → g.s. and 2+2 → 2
+
1 20O γ-rays.
We acknowledge the important technical contributions of J. Goupil and the GANIL accelerator staff. The authors acknowledge support from the Eu-ropean Union’s Horizon 2020 through ENSAR2 grant agreement No. 654002, the National Science Centre, Poland (NCN) Contract No. 2013/08/M/ST2/ 00257, 2014/14/M/ST2/00738 and 2016/22/M/ST2/00269 and COPIN-IN2P3 collaboration.
REFERENCES
[1] G. Hagen et al.,Phys. Rev. Lett. 108, 242501 (2012).
[2] C. Forssen et al.,J. Phys. G: Nucl. Part. Phys. 40, 055105 (2013). [3] S. Akkoyun et al.,Nucl. Instrum. Methods Phys. Res. A 668, 26 (2012). [4] E. Clèment et al.,Nucl. Instrum. Methods Phys. Res. A 855, 1 (2017). [5] M. Rejmund et al.,Nucl. Instrum. Methods Phys. Res. A 646, 184 (2011). [6] A. Maj et al.,Acta Phys. Pol. B 40, 565 (2009).
[7] M. Vandebrouck et al.,Nucl. Instrum. Methods Phys. Res. A 812, 112
(2016).
[8] S. Ziliani et al.,Acta Phys. Pol. B 50, 625 (2019), this issue. [9] M. Wiedeking et al.,Phys. Rev. Lett. 94, 132501 (2005). [10] M. Stanoiu et al., Phys. Rev. C 69, 034312 (2004).