HAL Id: cea-01722723
https://hal-cea.archives-ouvertes.fr/cea-01722723
Preprint submitted on 5 Mar 2018
HAL is a multi-disciplinary open access
archive for the deposit and dissemination of
sci-entific research documents, whether they are
pub-lished or not. The documents may come from
teaching and research institutions in France or
abroad, or from public or private research centers.
L’archive ouverte pluridisciplinaire HAL, est
destinée au dépôt et à la diffusion de documents
scientifiques de niveau recherche, publiés ou non,
émanant des établissements d’enseignement et de
recherche français ou étrangers, des laboratoires
publics ou privés.
room temperature
S. Zhao, J. Lavie, L. Rondin, L. Orcin-Chaix, C. Diederichs, Ph. Roussignol,
Y. Chassagneux, C. Voisin, K. Müllen, A. Narita, et al.
To cite this version:
S. Zhao, J. Lavie, L. Rondin, L. Orcin-Chaix, C. Diederichs, et al.. Single photon emission from
graphene quantum dots at room temperature. 2018. �cea-01722723�
S. Zhao,1 J. Lavie,2 L. Rondin,1 L. Orcin-Chaix,1, 2 C. Diederichs,3 Ph. Roussignol,3 Y. Chassagneux,3 C. Voisin,3 K. M¨ullen,4 A. Narita,4 S. Campidelli,2 and J.S. Lauret1, ∗
1
Laboratoire Aim´e Cotton, CNRS, Univ. Paris-Sud, ENS Cachan, Universit´e Paris Saclay bat 505 campus d’Orsay, 91405 Orsay cedex France
2
LICSEN, NIMBE, CEA, CNRS, Universit´e Paris-Saclay
3
Laboratoire Pierre Aigrain, D´epartement de physique de l’ENS, ´
Ecole normale sup´erieure, PSL Research University,
Universit´e Paris Diderot, Sorbonne Paris Cit´e, Sorbonne Universit´es, UPMC Univ. Paris 06, CNRS, 75005 Paris, France
4
Max Planck Institute for Polymer Research, Ackermannweg 10, 55128 Mainz, Germany
In the field of condensed matter, graphene plays a central role as an emerging material for nanoe-lectronics. Nevertheless, graphene is a semimetal, which constitutes a severe limitation for some fu-ture applications. Therefore, a lot of efforts are being made to develop semiconductor materials whose structure is compatible with the graphene lattice. In this perspective, little pieces of gra-phene represent a promising alternative [1, 2]. In particular, their electronic, optical and spin properties can be in principle controlled by de-signing their size, shape and edges [3–6]. As an example, graphene nanoribbons with zigzag edges have localized spin polarized states [7, 8]. Like-wise, singlet-triplet energy splitting can be chosen by designing the structure of graphene quantum dots [9]. Moreover, bottom-up molecular synthe-sis put these potentialities at our fingertips [3, 5]. Here, we report on a single emitter study that di-rectly addresses the intrinsic properties of a single graphene quantum dot. In particular, we show that graphene quantum dots emit single photons at room temperature with a high purity, a high brightness and a good photostability. These re-sults pave the way to the development of new quantum systems based on these nanoscale pieces of graphene.
To date, graphene quantum dots (GQDs) have been mostly synthesized by ”top-down” approaches, such as the oxidation of carbon fibers or graphene [10, 11]. These methods present important drawbacks that make them not suitable to produce emitters with well defined pro-perties. In particular, they do not allow to control nei-ther the size nor the chemical nature of the edges of the dots. Therefore, their optical properties are dominated by defect states instead of the intrinsic quantum confi-ned states of the nanographene [12]. Fortunately, over the last two decades, ”bottom-up” synthesis have been deve-loped opening the way to a precise control of the GQD structure [2]. Several sizes and shapes of GQDs have been already synthesized [1]. However, to date these materials often face problems that hinder the possibility to make
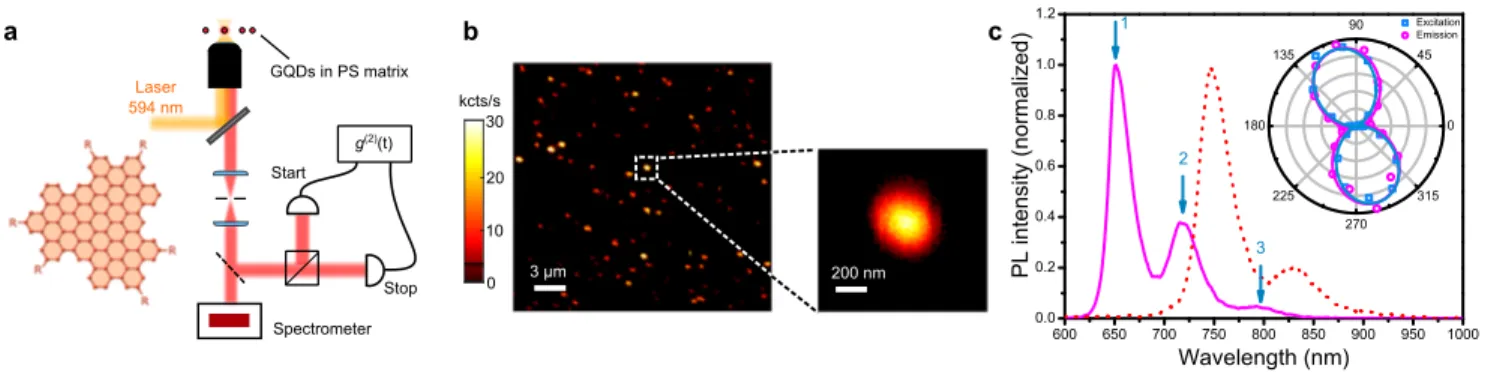
the link between their structure and their intrinsic pro-perties, especially in solid state or at the singemitter le-vel [1, 13]. In this paper, we study the photoluminescence of single GQDs synthesized by this bottom-up approach. We demonstrate the access to their intrinsic properties. Notably, we highlight that all the measured GQDs emit single photons at room temperature with a high purity, a high brightness and a good photostability putting them in the foreground of the research on new single emitters. The chemical structure of the GQD studied here is dis-played on Fig. 1a. It is made of 96 sp2 carbon atoms arranged in a triangular shape which leads to lateral sizes of ∼2 nm. Six alkyl chains (R=C12H25) were in-troduced at the edges to enhance the solubility of the GQDs. The details of the synthesis have been already reported [3]. Briefly, the C96 GQD is synthesized in two steps from the 1,3,5-triethynylbenzene and 2,5-diphenyl-3,4-di(4-dodecylphenyl)-cyclopentadien-1-one via Diels-Alder cycloaddition followed by oxidative cyclodehydro-genation in the presence of FeCl3 (See Extended Data Fig. 1). The intermediate compounds are fully charac-terized and the GQD is characcharac-terized by MALDI-TOF spectrometry to confirm its complete dehydrogenation (See Extended Data Fig. 2). The GQDs are dispersed in 1,2,4-trichlorobenzene and then mixed with a solution of polystyrene (PS). The mixture is subsequently spin-coated on a coverslip to perform the optical experiments, using the experimental setup described in Fig. 1a. Com-plementary details about the sample preparation can be found in the Methods section.
Fig. 1b shows an example of a photoluminescence (PL) map of GQDs embedded in PS matrix for the highest di-lution used in this study. One can observe bright spots (30 kcounts/s with a 200 nW excitation) with diffraction limited size. The PL spectrum acquired on such a spot is displayed on Fig. 1c. For this particular GQD, the spec-trum is composed of three lines, noted 1, 2 and 3, cente-red at 653 nm, 719 nm and 797 nm, respectively. The full width at half maximum of the main line is of the order of 27 nm (80 meV). Note that the wavelength as well as the relative intensity of the PL lines slightly vary from one GQD to another, which is certainly due to differences in
8 Laser 5948nm Spectrometer GQDs8in8PS8matrix gd2WdtW Start Stop 30 0 20 10 8 kcts/s 38µm 2008nm a b c 0 45 90 135 180 225 270 315 Excitation Emission 600 650 700 750 800 850 900 950 1000 0.0 0.2 0.4 0.6 0.8 1.0 1.2 3 2 P L8i nte nsity8d normal iz edW Wavelength8dnmW 1
Figure 1: Photoluminescence of single GQDs. a, Chemical structure of the C96GQD. R stands for C12H25. Scheme of the
microphotoluminescence setup. b, 20×20 µm2 PL map of GQDs in polystyrene matrix. The color bar represents the number of counts per second on the APD. The zoom shows a diffraction limited spot that can be fitted with a 2D Gaussian function leading to a 1/e2diameter of ∼600 nm. c, Room temperature PL spectra of a single C
96GQD (solid line) and of a single C96Cl
GQD (dotted line). Inset : polarization diagram in excitation (blue) and emission (red).
their local environments. Also, averaging over 25 GQDs gives an energy splitting of 170 ± 5 meV between lines 1 and 2, and 165 ± 10 meV between lines 2 and 3. Moreo-ver, as mentioned in the introduction, one of the great potential of GQDs lies in the precise tuning of their elec-tronic properties through the control of their structure. As a first example, the dotted curve in Fig 1c shows the PL spectrum of a single C96GQD whose emission wave-length has been tuned by precise chemical functionaliza-tion of the edges with chlorine atoms (see Extended Data Fig.3 for the chemical structure). Here the functionaliza-tion leads to an almost 100 nm rigid redshift of the main PL line. This observation is in agreement with theoreti-cal predictions that show a decrease of the optitheoreti-cal gap of C96 GQD due to the electronegativity of the chlorine atoms [14]. This result illustrates how the intrinsic pro-perties of GQDs can be controlled by the synthesis, and opens the way to even finer tunning.
In the following, we focus on C96 GQDs with the
C12H25 alkyl chains. The exact nature of the quantum states at the origin of the three PL lines is still an open question that needs a specific study. To comment on the likely mechanisms that could be responsible for these spectra, we performed photoluminescence excita-tion (PLE) experiments in soluexcita-tion (See Extended Data Fig. 4). The PLE curves detected on the two highest energy PL lines of GQD superimpose well with the ab-sorption spectrum of the solution. Besides, the PLE high-lights the existence of two states at 580 nm and 630 nm with small oscillator strengths in comparison with the main absorption line centered at 475 nm. This obser-vation is in good agreement with calculated absorption spectra. Indeed, theoretical works on this family of ob-jects show an intense line at high energy called β band in the Clar’s notation, accompanied by lower lying dark states, the so-called α and p bands [15, 16]. The cou-pling of the α and p bands with the vibrations of the lattice can then lead to a brightening of these low energy
states [17]. Therefore, the two PLE bands at 580 nm and 630 nm can tentatively be attributed to the intrinsic α and p bands while the main one at 475 nm would be assi-gned to the β band. However, both PLE and PL spectra are more complex than this first description. Especially, the PL spectrum of single GQDs is composed of seve-ral lines. The almost 170 meV energy splitting between each PL line suggests potential vibronic effects. It can be seen here that further studies, including calculations, are necessary for a full understanding of the electronic struc-ture. An interesting point will be for instance to search for signatures of the band diagram of graphene, such as valley structure. Finally, the polarization response of a single GQD is shown on the inset of Fig. 1c. Here, the emission polarization profile is recorded on the line 1 at ∼650 nm. It is linearly polarized at a fixed direction certainly related to the geometry of the GQD. Likewise the excitation diagram is also linearly polarized in the same direction than the emission one. Therefore, it can be concluded that absorption and main emission dipoles are parallel. Further investigations, including theoretical modeling, are also needed to explain this experimental observation.
In order to identify the number of emitters associa-ted with such diffraction limiassocia-ted spot and spectrum, we measured the second order correlation function (g(2)(τ )) at room temperature on photons from the entire spec-trum. As displayed in Fig. 2a, the strong antibunching observed at zero delay, g(2)(0) < 0.5, is a proof that a single emitter is detected. This is in strong contrast with the results of such experiments performed on ”top-down” GQDs where no antibunching is observed [12]. In these earlier studies, the absence of antibunching is interpre-ted as a consequence of the extrinsic nature of the states at the origin of the luminescence [12]. We have perfor-med measurements on 30 GQDs, all of them leading to g(2)(0) < 0.1 (see examples on Extended Data Fig. 5). Moreover, these correlation measurements being
perfor-P L (kcount s/ s) 20 15 10 5 0 time (min) 0 20 40 60 80 100 20 P L (kcount s/ s) 30 10 10 s 20 P L (kcount s/ s) 30 10 10 s 20 P L (kcount s/ s) 30 10 10 s P L (Mcou nt s/ s) d b a 40 0 20 60 80 100 0 1 2 3 8 4 5 7 6 time (ns) Norm . P L 0.1 1.0 c g (2) time (ns) 0 5 10 15 0 20 40 -40 -20 0.2 0.4 0.6 0.8 1.0 1.2 1.4 0.0 Iexc (kW/cm2)
Figure 2: Photophysics of a single GQD. a, Second order correlation function g2(τ ) recorded from a diffraction limited
spot such as the one of Fig. 1 (black dots), showing a strong antibunching. A fit (red line) with a function 1 − (1 − b)e−|τ |/τ1
yields g2(0) = 0.05±0.05 and a characteristic time of τ
1∼ 3.5 ns (FWHM of the IRF of the detector ∼ 0.9 ns). b, Time-resolved
PL of a single GQD (black dots) detected on the whole spectrum, fitted by a monoexponential decay (red line) with a time constant τ = 5.37 ns. c, Saturation curve of a single GQD (black dots) as a function of the pump power. A fit by eq. (1) (red line) leads to a saturation power density of 28 kW·cm−2and a saturation intensity Isat∼ 9.7 Mcounts/s. d, PL time trace of a
stable GQD over 100 minutes with a binning time of 200 ms. Fluctuations are due to setup instabilities. Zooms are shown on shorter timescale with a binning time of 10 ms.
med by integrating all the wavelengths on the detector, it implies that the spectrum described above indeed arises from a single GQDs and not from several objects. Mo-reover, the weak value observed for the g(2)(0) is an in-dication of the good purity of single photons emission associated with single GQD. This result enforces GQD as an interesting alternative to other single emitters in 2D materials, such as defects in WSe2 [18–21] or in h-BN [22–24].
The assurance that we are observing single objects al-lows us to characterise other important properties. First, another figure of merit of a single quantum emitter is its brightness. A saturation curve of a single GQD is dis-played on Fig. 2c. The intensity is fitted by
R = Rsat/(1 + Isat Iexc
) , (1)
with Rsat the count rate at saturation, Isat the incident power at saturation and Iexc the incident power. The fit leads to Rsat∼ 9.7 Mcounts/s, and Isat= 28 kW·cm−2.
This value of count rate at saturation has to be compa-red to other quantum emitters. For instance, the wide use of single NV center in bulk diamond, with a well-documented count rate, make it a good point of com-parison for new quantum emitters [23]. In the present case, we measured a Rsat ≈ 0.3 Mcounts/s for a single NV center in a 111-diamond (see Extended Data Fig. 6), in good agreement with the literature [25]. The intensity at saturation of GQDs is thus ∼ 30 times higher. The-refore, it puts GQDs in the highest values of brightness among other quantum emitters [23, 24]. Secondly, the question of the photostability of the quantum emitter is also an important issue. In this perspective, GQDs have also good properties. Indeed, photostability up to hours have been observed for an incident power of 200 nW (0.12 kW.cm−2) and an emission rate of ∼20 kcounts/s (see Fig. 2d). This is very encouraging since no particular care has been taken for the preparation of the sample. Moreover, Fig. 2d shows that no blinking is occurring on the time trace of the luminescence of this GQD, the
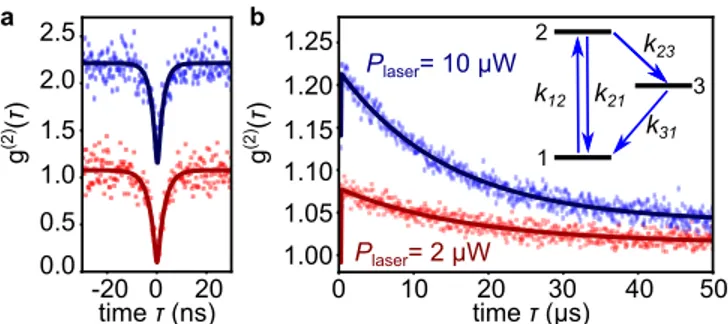
time τ (µs) 0 10 20 30 40 50 1.00 1.05 1.10 1.15 1.20 g (2) (τ ) 2 1 3 1.25 k12 k21 k23 k31 0 20 -20 0.0 0.5 1.0 1.5 time τ (ns) g (2)(τ ) Plaser= 10 µW Plaser= 2 µW 2.0 2.5 a b
Figure 3: Photons bunching of a single GQD. a-b g(2)
functions of a single GQD, for two different excitation po-wers, 2 µW (red square) and 10 µW (blue diamond). The curves have been shifted for clarity.a Zoom on short delays ; b Full timescale observation. A fit (solid line) by the function 1 − (1 + a)e−λ1|τ |+ ae−λ2|τ |, convolved by the time response
of the detector allows extracting the relevant photophysical parameters. The three level system used as a model is shown in the inset.
histogram of intensity fitting well to a normal distribu-tion (see Extended Data Fig. 7). This observadistribu-tion is in strong contrast with numerous single emitters that un-dergo quantum jumps between different states due, for instance, to quantum confined stark effect [26]. Never-theless, the luminescence of GQDs end up disappearing. Extended Data Fig. 8 shows two different time traces around the time of bleaching. In the first one the lumines-cence drops down to zero sharply. On the contrary, the second one goes through an intermediate ”grey” state before ending up to zero. These two behaviors are re-presentative of what we observed on all the GQDs. The discrete intensity jumps are also characteristic of single emitter experiments. Further work is needed to unders-tand the mechanisms behind such behaviors. In parti-cular, it would be interesting to investigate whether the GQD emission is irreversibly quenched or if they are able to reemit light after a certain time. This could lead to a better control of the local environment of GQDs in the view of optimizing their long term photostability. Fur-thermore, we have measured the luminescence lifetime on a single GQD. Fig 2b shows the time-resolved photo-luminescence (TR-PL) curve for a single GQD. Here, the signal can be fitted by a mono-exponential decay with a time constant τ ∼ 5.37 ns. We have performed such ex-periments on several GQDs. The TR-PL signal is always mono-exponential with relaxation times ranging from 3 to 5.5 ns.
Finally, as a first step toward probing the potential of GQDs for spin physics [27], and in analogy with observa-tions in single molecules experiments, we chose to study the g(2)function on a longer timescale. Indeed, such mea-surement allows highlighting intersystem crossing (ISC) dynamics between singlet and triplet states [28]. This ap-proach is also supported by calculations showing that at
least one triplet state is lying few hundreds of meV be-low the singlet state [9, 29]. Finally, this experiment is particularly suitable to extract details about GQDs’ pho-tophysics. The g(2)functions recorded under different ex-citation density both at short and long time delays are shown respectively in Fig. 3a and 3b. At short delays, one observes a reduction of the dynamics of the g(2) function when the pump is increased. Likewise, at longer delays photon bunching (g(2)> 1) is observed with a relaxation down to g(2)= 1 within tens of microseconds. Assuming a three-level system model, as shown in the inset of Fig. 3b, we can fit these data set to extract relevant photo-physical parameters. In particular, the relaxation rates k21∼ 0.28 ns−1 and k31∼ 0.057 µs−1 have been extrac-ted (see Methods section for the details of the photophy-sics). Note that the latter characteristics rate (k31) is of the same order of what is typically observed for small molecules in the context of ISC. Therefore, it is reaso-nable to attribute this metastable state to a triplet state of C96. Finally, the modelization leads also to an esti-mation of the absorption cross section of the C96 GQD (σ ' 1.0 × 10⁻¹⁴ cm2) as well as of the PL quantum efficiency ηQ above 35% (see Methods section).
To conclude, the outstanding properties of GQDs : single photon emission, brightness and photostability show that they are very promising materials for appli-cations requiring single emitters. More generally, the re-sults reported here demonstrate that the high potential of GQDs revealed by theory is now accessible experi-mentally. In particular, the fact that the emission of a single GQD is observable and tunable pave the way to studies linking their properties to their structure. These results show that the tuning of the properties through the control of the structure is indeed achievable. There-fore, one can now really imagine to perform engineering of other properties such as the spin structure in order to rend it optically detectable and controllable.
∗
Electronic address: lauret@ens-paris-saclay.fr
[1] M¨ullen, K. Evolution of Graphene Molecules : Structu-ral and Functional Complexity as Driving Forces behind Nanoscience. ACS Nano 8, 6531–6541 (2014).
[2] Wu, J., Pisula, W. & M¨ullen, K. Graphenes as Poten-tial Material for Electronics. Chem. Rev. 107, 718–747 (2007).
[3] Tomovi´c, Z.,ˇ Watson, M. D. & M¨ullen, K. Superphenalene-Based Columnar Liquid Crystals. Angew. Chem. Int. Ed. 43, 755–758 (2004).
[4] Debije, M. G. et al. The optical and charge transport properties of discotic materials with large aromatic hy-drocarbon cores. J. Am. Chem. Soc. 126, 4641–4645 (2004).
[5] Yan, X., Cui, X. & Li, L.-S. Synthesis of Large, Stable Colloidal Graphene Quantum Dots with Tunable Size. J. Am. Chem. Soc. 132, 5944–5945 (2010).
[6] Konishi, A. et al. Synthesis and characterization of te-ranthene : A singlet biradical polycyclic aromatic hydro-carbon having kekul structures. J. Am. Chem. Soc. 132, 11021–11023 (2010).
[7] Son, Y.-W., Cohen, M. L. & Louie, S. G. Energy Gaps in Graphene Nanoribbons. Phys. Rev. Lett. 97, 216803 (2006).
[8] Ruffieux, P. et al. On-surface synthesis of graphene nano-ribbons with zigzag edge topology. Nature 531, 489–492 (2016).
[9] Li, Y., Shu, H., Wang, S. & Wang, J. Electronic and Op-tical Properties of Graphene Quantum Dots : The Role of Many-Body Effects. J. Phys. Chem. C 119, 4983–4989 (2015).
[10] Li, L. et al. Focusing on luminescent graphene quantum dots : Current status and future perspectives. Nanoscale 5, 4015–4039 (2013).
[11] Bacon, M., Bradley, S. J. & Nann, T. Graphene Quantum Dots. Part. Part. Sys. Charac. 31, 415–428 (2014). [12] Xu, Q. et al. Single-Particle Spectroscopic Measurements
of Fluorescent Graphene Quantum Dots. ACS Nano 7, 10654–10661 (2013).
[13] Zhao, S. et al. Fluorescence from graphene nanoribbons of well-defined structure. Carbon 119, 235–240 (2017). [14] Tan, Y.-Z. et al. Atomically precise edge chlorination of
nanographenes and its application in graphene nanorib-bons. Nat. Commun. 4, 2646 (2013).
[15] Rieger, R. & M¨ullen, K. Forever young : Polycyclic aro-matic hydrocarbons as model cases for structural and optical studies. J. Phys. Org. Chem. 23, 315–325 (2010). [16] Cocchi, C., Prezzi, D., Ruini, A., Caldas, M. J. & Mo-linari, E. Anisotropy and Size Effects on the Optical Spectra of Polycyclic Aromatic Hydrocarbons. J. Phys. Chem. A 118, 6507–6513 (2014).
[17] Sprafke, J. K. et al. Belt-shaped -systems : Relating geo-metry to electronic structure in a six-porphyrin nanoring. J. Am. Chem. Soc. 133, 17262–17273 (2011).
[18] Koperski, M. et al. Single photon emitters in exfoliated WSe2 structures. Nat. Nanotechnol. 10, 503–506 (2015). [19] Srivastava, A. et al. Optically active quantum dots in monolayer WSe2. Nat. Nanotechnol. 10, 491–496 (2015). [20] Chakraborty, C., Kinnischtzke, L., Goodfellow, K. M., Beams, R. & Vamivakas, A. N. Voltage-controlled quan-tum light from an atomically thin semiconductor. Nat. Nanotechnol. 10, 507–511 (2015).
[21] He, Y.-M. et al. Single quantum emitters in monolayer semiconductors. Nat. Nanotechnol. 10, 497–502 (2015). [22] Li, X. et al. Nonmagnetic Quantum Emitters in Boron
Nitride with Ultranarrow and Sideband-Free Emission Spectra. ACS Nano 11, 6652–6660 (2017).
[23] Mart´ınez, L. J. et al. Efficient single photon emission from a high-purity hexagonal boron nitride crystal. Phys. Rev. B 94, 121405 (2016).
[24] Tran, T. T., Bray, K., Ford, M. J., Toth, M. & Aharono-vich, I. Quantum emission from hexagonal boron nitride monolayers. Nat. Nanotechnol. 11, 37 (2016).
[25] Lesik, M. et al. Perfect preferential orientation of nitrogen-vacancy defects in a synthetic diamond sample. Appl. Phys. Lett. 104, 113107 (2014).
[26] Empedocles, S. A. & Bawendi, M. G. Quantum-Confined Stark Effect in Single CdSe Nanocrystallite Quantum Dots. Science 278, 2114–2117 (1997).
[27] Li, L.-S. & Yan, X. Colloidal graphene quantum dots. J. Phys. Chem. Lett. 1, 2572–2576 (2010).
[28] Bernard, J., Fleury, L., Talon, H. & Orrit, M. Photon bunching in the fluorescence from single molecules : A probe for intersystem crossing. J. Chem Phys. 98, 850– 859 (1993).
[29] Schumacher, S. Photophysics of graphene quantum dots : Insights from electronic structure calculations. Phys. Rev. B 83, 081417 (2011).
[30] Wehmeier, M., Wagner, M. & M¨ullen, K. Novel perylene chromophores obtained by a facile oxidative cyclodehy-drogenation route. Chem. Eur. J. 7, 2197–2205 (2001). [31] Novotny, L. & Hecht, B. Principles of Nano-Optics
(Cambridge University Press, 2012), 2 edn.
[32] Reynaud, Serge. La fluorescence de r´esonance : Etude par la m´ethode de l’atome habill´e. Ann. Phys. 8, 315– 370 (1983).
[33] Huang, C.-H., Wen, Y.-H. & Liu, Y.-W. Measuring the second order correlation function and the coherence time using random phase modulation. Opt. Express 24, 4278– 4288 (2016).
[34] Wu, E. et al. Narrow-band single-photon emission in the near infrared for quantum key distribution. Opt. Express 14, 1296–1303 (2006).
Acknowledgements The authors are grateful to D. Beljonne, J.-F. Roch and V. Jacques for discussions. The authors thank C. Allain for her help on the PLE experiments. This work was partly funded by the JST-ANR program TMOL ”Molecular Technology” project MECANO (ANR-14-JTIC-0002-01) and the ANR projet MAGMA (ANR-16-CE29-0027-01) and by a public grant overseen by the French National Research Agency (ANR) as part of the ”Investissements d’Avenir” program (Labex NanoSaclay, reference : ANR-10-LABX-0035) and by the GDR-I GNT. J.S.L is partially funded by ”Institut Universitaire de France”.
Authors contributions
SZ and LR have performed the optical experiments. JL and LOC have performed the synthesis of GQDs. SC have supervised the synthesis. LR and JSL have supervised the optical experiments and the analysis of the data. All the authors have discussed on the results and participated to the writing of the paper.
Methods
Techniques. MALDI-OF spectra were performed with a Perspective Biosystems Voyager DE-STR at the I.C.S.N. (CNRS of Gif-sur-Yvette). 1H-NMR spectra were recorded on Bruker AC-300 spectrometer (300MHz) with CDCl3 as reference solvent.
Materials. Chemicals were purchased from Aldrich and were used as received. The 3,4-bis(4-dodecylphenyl)-2,5-diphenylcyclopentadienone was prepared according to the method described in the literature [30]. Solvents were purchased from Aldrich, VWR or ThermoFisher and were used as received.
Synthesis. Dendrimer 3. 3,4-bis(4-dodecylphenyl)-2,5-diphenylcyclopentadienone (450 mg, 0.62 mmol) and the 1,3,5-triethynylbenzene (25 mg, 0.17 mmol) were introduced in a dry Schlenck flask. After two vacuum-argon cycles, o-xylene (2 mL) were added and the reaction was left at 180˚C overnight. The suspension was diluted in dichloromethane (2 mL) and the solu-tion was precipitated in cold ethanol (200 mL). After filtration on PTFE membrane (0.2 µm), the product was redispersed in hot methanol to solublize the excess of cyclopentadienone, filtered on PTFE membrane and washed with methanol. Finally, 220 mg of yellowish powder were obtained (57% yield). 1H NMR (300MHz, CDCl3) : 7.10-6.60 (60H, m, Ar-H) ; 2.37 (12H, q, J=5.6 Hz, 6CH2(Ar)dodecyl) ; 1.27 (120H, s, 60CH2-dodecyl) ;
0.90 (18H, t, J=5.6 Hz, 6CH3-dodecyl). MS
(MALDI-TOF) : m/z (%) calcd for C168H210 : 2227.64 ; found : 2227.60 (M+).
C96 quantum dot. Dendrimer 3 (50 mg, 22.4 µmol) was dispersed in non-stabilized dichloromethane (40 mL) in a two-necked round bottom flask of 100 mL. Separetly,
FeCl3 (458 mg, 2.8 mmol) was dissolved in anhydrous
nitromethane in a gloves box (2 mL) and then added to the solution of dendrimer. The solution was left 18 hours under argon coming from a two necked round bottom flask filled with dichloromethane in which argon was bubbling. The evolution of the reaction was followed with MALDI-TOF mass spectroscopmetry after quenching of an aliquot with methanol. When the reaction was finished, the solution was quenched with methanol (40 mL) and then filtered on PTFE membrane (0.2 µm). 46 mg of a black powder were obtained as the pure product (95% yield). MS (MALDI-TOF) : m/z (%) calcd for C168H174: 2191.36 ; found : 2191.87 (M+).
Sample preparation. GQDs powder was dispersed in 1,2,4-trichlorobenzene (TCB) by stirring at least 24h at room temperature. For single-molecule measurements,
a 2 mL diluted GQDs solution (0.001 mg.mL−1) was
mixed with a 2 mL 1,2,4-trichlorobenzene solution (0.08 mg/mL) of polystyrene (PS). Approximately 20 µL of the GQD-PS-TCB solution was spin-coated on an oxygen-plasma-treated glass coverslip for 180 s at 2000 r.p.m. The sample was dried by heating to 90 0C for 1 h on a hot plate.
Optical measurements. Optical experiments were performed on a home-built micro-PL setup under ambient conditions, as shown in Fig. 1a. The excitation source was a continuous-wave diode laser at 594 nm (Cobolt, Mambo 100) with linear polarization. The excitation laser was focused onto the sample with a high numerical aperture oil-immersion microscope objective (NA = 1.42, Olympus PLAPON 60XO) mounted on a piezoelectric XYZ scanner (Mad City Labs Inc.). The
lu-minescence light was collected by the same objective and filtered from the residual excitation laser using a dichroic mirror (zt 594 RDC, Chroma) and a long-pass filter (FELH0600, Thorlabs). The collected luminescence was then focused on a 50-µm-diameter pinhole and finally directed either into a spectrometer (SP-2358, Prince-ton Instruments) coupled with a cooled CCD camera (PyLoN :100BR eXcelon, Princeton Instruments) or into two silicon avalanche photodiodes (SPCM-AQR-13, PerkinElmer) mounted in a Hanbury Brown and Twiss
(HBT) configuration. Short-time-scale second-order
photon correlation measurements were done using a time-correlated single photon counting module
(Pico-Harp300, PicoQuant). Long-time-scale second-order
photon correlation measurements were done using a wide-range time digitizer (P7887, FastComtec). For time-resolved PL measurements, the sample was excited using a supercontinuum laser (Fianium) tuned at 580 nm by an acousto-optic tunable filter systems with a 6 ps pulse width and a 60 MHz repetition rate.
Three-level system. We now model the GQD res-ponse within the framework of a three-level system : ground state (level 1), excited state (level 2) and me-tastable state (level 3) as shown in Fig. 3 of the main text. The transition rate from level n to level m is given by knm (with n, m = 1, 2, 3). Assuming that k23 and k31 are very small compared to k21, the normalized second-order auto-correlation function g(2)(t) can be expressed as [31] :
g(2)(t) = 1 − (1 + a)e−λ1t+ ae−λ2t (1)
with following expressions for the parameters a, λ1, and λ2 :
λ1= k12+ k21
λ2= k31+ k23k12/(k12+ k21) (2) a = k23k12/ [k31(k12+ k21)]
Note that the usual “start-stop”setup that serves to measure the g(2) function is only valid on timescale smal-ler than R−1, where R is the counting rate [32]. In or-der to capture the full dynamics of the GQD photophy-sics, and especially the long bunching characteristics time
(λ2−1 ∼ µs), we used the Hanbury Brown and Twiss
(HBT) setup to measure J (t) which is the histogram of photons detected at time t provided that a photon is de-tected at time t = 0. To this end, a photon detection event on detector D1 was used to trigger the acquisition of a PL time trace on detector D2 using a wide-range time digitizer (P7887, FastComtec). After N repetitions of the measurement, the resulting histogram J (t) is di-rectly linked to the g(2)(t) function through [23, 33] :
g(2)(t) = J (t) N wR2 (3)
where w is the time bin width and R2is the photon count rate on detector D2.
Extended Data Fig. 11a represents a typical recorded g(2)(t) function over 50 µs with an excitation power of 10 µW. We observe that the g(2)(0) at zero time delay has a non-negligible residual value for excitation power larger than a few µW. This deviation from g(2)(0) = 0 is due to the shortening of the antibunching characteristic time λ1−1 with the incident power bringing it closer to the instrument response [34]. Using 6 ps supercontinuum laser pulses, the instrument response function (IRF) was independently measured as a 0.9 ns FWHM Gaussian function (Extended Data Fig. 11b). The measured g(2) function is then well fitted by the convolution of the IRF with Eq. (1).
To gain insights into the transition rates, we measu-red the g(2) function of a GQD at different excitation powers. By fitting the g(2) functions, we obtain the va-lues of λ1, λ2 and a. We plot these values as a function of excitation power (Extended Data Fig 11c, d and e, respectively). From these plots, we can deduce all of the transition rates.
The population rate of excited state k12 is linked to the excitation power P by the relation :
k12= σP/hν
where σ is the absorption cross-section and ν is the ex-citation frequency. Combining this relation with Eq .2, we fit the λ1values with a linear function (see Extended Data Fig. 11c). From this fit, we obtained the absorption cross-section σ ' 1.0 × 10⁻¹⁴ cm2. By extrapolating the linear fit to zero excitation power, we also obtain the re-laxation rate of the excited state k21= 0.28 ± 0.02 ns−1. The lifetime of excited state k21−1 is thus calculated to be 3.55 ± 0.24 ns. This value is compatible with our
time-resolved PL measurements leading to life times ranging from 3 to 6 ns depending on the GQD.
Using Eq. 3 and 4, the relaxation rate of metastable state k31 is given by
k31= 1+aλ2 = 0.053 ± 0.001 µs−1
We then fit the λ2by combining Eq. 3 and 6. Treating k23 as a constant, we obtain k23= 0.025 ± 0.005 µs−1.
We now estimate the quantum yield of GQD. Using the transition rates, the detected fluorescence rate can be expressed as [34]
R = ηdetηQ(k k21 21/k12+k23/k31+1)
where R is the sum of count rates on the two APDs, ηdet is the overall detection efficiency and ηQ is the fluores-cence quantum yield. By fitting the fluoresfluores-cence satura-tion curve, together with the deduced transisatura-tion rates, we obtain ηdet×ηQ≈ 0.05. In Tab. 1 we list the transmission or collection efficiency of each optical component in the detection path, leading to an overall collection efficiency expected to be lower than 15%. Therefore, a lower bound of the fluorescence quantum yield is ∼ 35%.
objective lens mirrors dichroic mirror beamsplitter
30% 92% 98% 95%
lenses optical filters APD ηdet
97% 88% 70% ∼ 15%
Data availability The data that support the findings of this study are available from the corresponding author upon reasonable request.
+ O C12H25 C12H25 C12H25 C12H25 C12H25 C12H25 C12H25 C12H25 C12H25 C12H25 C12H25 C12H25 C12H25 C12H25 Diels-Alder reaction FeCl3, MeNO2 CH2Cl2, Ar C96GQD 1 2 3 o-xylene,
Extended Data Figure 1: Reaction route to the production of C96GQD.
2180 2200 2220 2240 2260 -50 0 50 100 150 200 250 300 2192,801 Intensit y (a.u.) m/z C168H174 (M+H)
Extended Data Figure 2: MALDI-TOF mass spectrum of C96 GQD. The spectrum shows the absence of starting or
incompletely oxidized materials.
-60 -40 -20 0 20 40 60 0 10 20 30 g (2 ) Time delay (ns)
Extended Data Figure 3: g(2) curve of the C
96Cl GQD whose spectrum is displayed on Fig.1c. Here the edge chlorination
leads to an almost 100 nm redshift of the main PL line while maintaining a single photon emission. Inset : Schematic chemical structure of the C96Cl GQDs.
3 5 0 4 0 0 4 5 0 5 0 0 5 5 0 6 0 0 6 5 0 7 0 0 7 5 0 0 . 0 0 0 . 2 5 0 . 5 0 0 . 7 5 1 . 0 0 1 . 2 5 O p ti c a l D e n s it y / P L E i n te n s it y ( a rb . u n it ) W a v e l e n g t h ( n m ) O p t i c a l a b s o r p t i o n P L E d e t e c t e d a t 6 4 8 n m P L E - d e t e c t e d a t 7 1 0 n m
Extended Data Figure 4: Optical absorption spectrum of C96 GQDs in solution in trichlorobenzene (blue) and PLE
spectra (green and red). The absorption spectrum is composed of a main line at ∼475 nm and of some shoulder on the low energy tail. Likewise, both PLE spectra recorded on the two main PL lines follow the trend of the absorption spectrum. Moreover, PLE lines are much more structured than the absorption spectrum. This may be an indication that some aggregates still remain in the suspension. Their PL quantum yield would be much lower than the one of monomers, explaining why the PL spectrum is dominated by the monomers.
- 1 5 0 - 1 0 0 - 5 0 0 5 0 1 0 0 1 5 0 0 . 0 0 . 5 1 . 0 1 . 5 g 2 T i m e ( n s ) 0 . 0 1 - 1 5 0 - 1 0 0 - 5 0 0 5 0 1 0 0 1 5 0 0 . 0 0 . 5 1 . 0 1 . 5 g 2 T i m e ( n s ) 0 . 0 4 - 1 5 0 - 1 0 0 - 5 0 0 5 0 1 0 0 1 5 0 0 . 0 0 . 5 1 . 0 1 . 5 g 2 T i m e ( n s ) 0 . 1 0 - 1 5 0 - 1 0 0 - 5 0 0 5 0 1 0 0 1 5 0 0 . 0 0 . 5 1 . 0 1 . 5 g 2 T i m e ( n s ) 0 . 0 3 - 1 5 0 - 1 0 0 - 5 0 0 5 0 1 0 0 1 5 0 0 . 0 0 . 5 1 . 0 1 . 5 g 2 T i m e ( n s ) 0 . 0 1 - 1 5 0 - 1 0 0 - 5 0 0 5 0 1 0 0 1 5 0 0 . 0 0 . 5 1 . 0 1 . 5 g 2 T i m e ( n s ) 0 . 0 4 - 1 5 0 - 1 0 0 - 5 0 0 5 0 1 0 0 1 5 0 0 . 0 0 . 5 1 . 0 1 . 5 g 2 T i m e ( n s ) 0 . 0 8 - 1 5 0 - 1 0 0 - 5 0 0 5 0 1 0 0 1 5 0 0 . 0 0 . 5 1 . 0 1 . 5 0 . 0 4 g 2 T i m e ( n s )
0 . 1 1 1 0 1 0 0 1 1 0 1 0 0 1 0 0 0 1 0 0 0 0 S i n g l e N - V S i n g l e C 9 6 P L ( k c o u n ts /s ) Ie x c ( k W / c m 2)
Extended Data Figure 6: Saturation curves of a GQD (red dots) and a single NV center in diamond (blue dots). Both were fitted with the saturation functions described in the main text.
100 110 120 130 140 150 160 150 200 250 PL (cou nts per 10 ms) time (s) Occurence 0 500 1000 4000 4010 4020 4030 4040 4050 4060 150 200 250 PL (cou nts per 10 ms) Time (s) Occurence 0 500 1000 6000 6010 6020 6030 6040 6050 6060 150 200 250 PL (cou nts per 10 ms) Time (s) Occurence 0 500 1000
Extended Data Figure 7: Intensity histograms PL time traces (the same as shown in the zooms of Fig. 2d of main text) and corresponding count rate histograms. The histograms were fitted by normal functions (blue curves)
0 10 20 30 0 20 40 60 PL intensity (kcou nts/s) Time (s) 0 10 20 30 0 10 20 30 PL intensity (kcou nts/s) Time (s)
Extended Data Figure 8: PL time traces recorded from different GQDs around the time of bleaching. Bin size : 10 ms.
T i m e ( n s ) - 1 0 0 - 5 0 0 5 0 1 0 0 0 2 5 5 0 g (2 )
Extended Data Figure 9: g2(τ ) trace under pulsed excitation (580 nm) on the same GQD as the one corresponding to
single GQDs 0 10 30 PL intensity (kcts/s) 20 10-5 mol/L GQD + PS
a
0 10 30 PL intensity (kcts/s) 20 10-6 mol/L GQD + PSb
0 10 30 PL intensity (kcts/s) 20 10-7 mol/L GQD + PSc
0 10 30 PL intensity (kcts/s) 20 PS onlyd
typical single GQDExtended Data Figure 10: PL maps of GQDs in a polystyrene matrix spin-coated from solutions at different concentrations of C96 GQD : a 10−5mol.L−1; b 10−6mol.L−1; c 10−7mol.L−1. d PL map of polystyrene film without GQDs. Map size :
20 × 20 µm2. When a highly concentrated solution is used to make the thin film, luminescence is observed everywhere on the
sample. When the concentration decreases, the spatial distribution of PL is more and more localized. It ensures that the bright luminescence spots do arise from GQDs. Moreover, the d panel shows a map of a polystyrene film without GQDs. It shows very weak PL signal in comparison with the GQD samples. The localized weak PL spots that are still observed bleach quasi instantaneously, in strong contrast with the GQDs spots that are stable for hours.
0 5 10 15 20 0.06 0.07 excitation power P (µW) ~ 0.2 time delay (ns) g (2) (τ ) IRF (a.u.) time (ns) a b λ2 (µs -1) 0 5 10 15 20 0.3 0.4 0.5 0.6 λ1 (ns -1) excitation power P (µW) 0 5 10 15 20 0.05 0.10 0.15 0.20 a excitation power P (µW) c d e
Extended Data Figure 11: Photophysics of a single GQD. a, Long-time-scale g(2) function recorded with an excitation
power of 10 µW. Bin width : 250 ps. A time delay is introduced for log-scale display. The red line is a fit by the convolution of Eq.1 and the measured instrument response function (IRF). b, Impulse Response Function of the detector measured using 6-ps laser pulses. The Gaussian fit (red line) gives a FWHM of 0.9 ns. c-e, Intensity dependence of the fit parameters λ1 (c),