HAL Id: hal-01294306
https://hal.archives-ouvertes.fr/hal-01294306
Submitted on 29 Mar 2016
HAL is a multi-disciplinary open access
archive for the deposit and dissemination of sci-entific research documents, whether they are pub-lished or not. The documents may come from teaching and research institutions in France or abroad, or from public or private research centers.
L’archive ouverte pluridisciplinaire HAL, est destinée au dépôt et à la diffusion de documents scientifiques de niveau recherche, publiés ou non, émanant des établissements d’enseignement et de recherche français ou étrangers, des laboratoires publics ou privés.
PROPERTIES: HOW TO DEFINE A GOOD
FLOCCULATION ?
Pascal Ginisty, Jérémy Olivier, Jean Vaxelaire, Vincent Lafitte
To cite this version:
Pascal Ginisty, Jérémy Olivier, Jean Vaxelaire, Vincent Lafitte. CORRELATIONS BETWEEN
FLOC CHARACTERISTICS AND DRAINABILITY PROPERTIES: HOW TO DEFINE A GOOD FLOCCULATION ?. 11th World Filtration Congress, Apr 2012, Graz, Austria. �hal-01294306�
CORRELATIONS BETWEEN FLOC CHARACTERISTICS AND
DRAINABILITY PROPERTIES: HOW TO DEFINE A GOOD
FLOCCULATION ?
Pascal GINISTY*(1), Jeremy OLIVIER(2), Jean VAXELAIRE(2), Vincent LAFITTE(2)
1 IFTS, BP 292, 47007 Agen, France
2 Laboratoire de Thermique Energétique et Procédé, ENSGTI, Université de Pau et
des Pays de l’Adour, BP 7511, Rue Jules Ferry, 64075 Pau Cedex (e-mail : [email protected], [email protected];
ABSTRACT
Sludge conditioning is a pre-treatment to improve the removal of water during the thickening process with a wide range of commercially available products. Laboratory tests are usually needed to make the selection of a conditioner and its dosage, but mixing control is required during flocculation to obtain quantitative, repeatable and comparable data. A specific device (bootest) was developed to optimize sludge flocculation at lab scale and combines a sludge reactor for flocculation and a drainage cell. Experiments made with this device enabled to propose a “drainability index”, a useful tool to qualify a “good flocculation” for a drainage process.
KEYWORDS
Flocculation& Mixing systems, sludge dewatering, thickeners, laboratory filters, pretreatment chemicals
1. Introduction
It is usually recognized that sludge management is a major problem in water and wastewater treatment, as it can account for up to 50% of total operating costs. The effectiveness and cost of sludge treatment and disposal operations are strongly affected by its volume and, consequently, by its water content or solids concentration, so thickening and dewatering are important steps in the total sludge processing train and has serious impact on subsequent operations.
Thickening devices enable to remove free water from sludge. Amongst devices, gravity belt thickeners are a relative, cheap, simple and efficient technology which enables to increase the sludge dry solids content from 1-3% to 6-10% [1]. Sludge conditioning is a mean to improve the removal of water during the thickening process. Chemical products are classically used to neutralize or destabilize the chemical or physical forces acting on colloidal and particulate matters, suspended in
and dosage of polymers but also on the mixing conditions between sludge and chemicals [4].
Laboratory tests are described in literature for selecting conditioner type and optimal dosage and for predicting machine performance. They consist in sludge flocculation in quantitative, repeatable and comparable conditions and in a filtration under gravity of conditioned sludge on the filter cloth of a belt thickener. Recent development enables to carry out these two operations in a single device called “bootest” [5]. The drainability of the flocculated sludge could be a parameter, easily and quickly obtainable. A recent published standard (EN 14701-4, 2010) showed specifically the repeatability and reproductibility of this characterization method. Results obtained with classical filtration cell may be used for scaling up belt thickeners [6][7] and correlations were proposed to link (linearly) the final quantity of sludge with the solids content of the raw sludge by parameters depending on floc properties [8][9].
Few studies results have been published concerning the relationship between floc characteristics and their drainability. Large, loose or bulky flocs with great proportion of free filtrate are often required for thickening [10]. They are generally obtained with structured high molecular weight emulsion polymers or high cross-linked polymers with a higher dosage [11].
Nevertheless, the characterization of a good flocculation for a drainage process in an industrial equipment has never been well defined. As drainage tests are easy to carry out quickly at lab scale, we proposed in this paper to define a “drainability index” allowing to qualify a good separation in a belt thickener. The sludge drainability has to be linked to flocs characteristics which strongly depend on the operating conditions applied for their formation. The aim of this work is to correlate floc characteristics with their drainability.
2. Materials and methods
2.1 Sludge flocculation
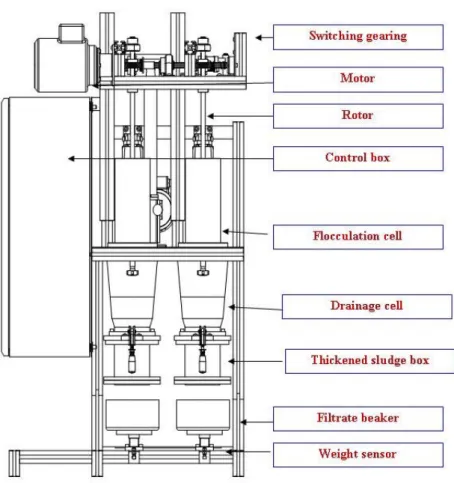
Sludge flocculation experiments were carried out in a new kind of device called “bootest” developed by IFTS. It is composed of two sludge flocculators (diameter: 90 mm) and two drainage cells with automatic transfer from one to another (Figure 1). The two flocculators are stirred in the same conditions. Mixing time and impeller speed and position (depending on the volume of sludge) are measured and controlled. Drainage cells are equipped with filter cloth reference Si030904 from Rai-Tillières (French manufacturer). The mass of filtrate is recorded during the test by a weight sensor connected to a computer. The parameters for drainage kinetics are the ratio of the filtrate mass over the sludge initial mass (M/M0) at different times as
recommended in EN 14701-4. Preliminary work pointed out excellent repeatability of flocculation obtained with this equipment [5].
Figure 1: Sludge flocculation device (“bootest”)
2.2 Flocculation kinetics control device
Optimum mixing time for sludge flocculation at a given speed (700 tr/min) was obtained with a torque rheometer (Thermo Scientific Haake Mars III) described as an efficient tool to control floc growth / breakage [12]. The principle is illustrated on figure 2.
Activated sludge (3.5% DS), sampled at a municipal wastewater treatment plant near Agen (47, France).
Water supply treatment sludge (2.05% DS) sampled at Nerac plant (47, France)
Digested sludge (2.63% DS) sampled at Cergy plant (95, France)
Drilling sludge (21.4% DS) sampled at a Parisian highway site (95, France) Synthetic mineral sludge (11.6% DS) composed of a mixture of kaolin (10%
DS) and calcium chloride (1.65% DS) 2.4 Polyelectrolytes
Cationic polymer of different charge density, molecular weight, physico-chemical form (powder, emulsion) and structure (linear chain, crosslinked backbone, structured) were supplied by French manufacturer SNF FLOERGER. Quantity of polyelectrolyte solution was fixed according to the required dose of polyelectrolyte by quantity of dry sludge (kg/T DS).
3. Results and discussion
3.1 Definition of a drainability index
A good drainage process requires three goals to be achieved: A high solids content factor (increase of sludge dryness) A fast kinetic of filtrate release
A high capture rate
3.1.1 Dryness characterization
Solids concentration factor can be assessed by the ratio of the thickened sludge dryness and the initial solids content of the sludge.
The thickened sludge dryness was measured according EN 14701-4 when the curve M / M0 = f (t) reaches a horizontal asymptote.
3.1.2 Kinetics characterization
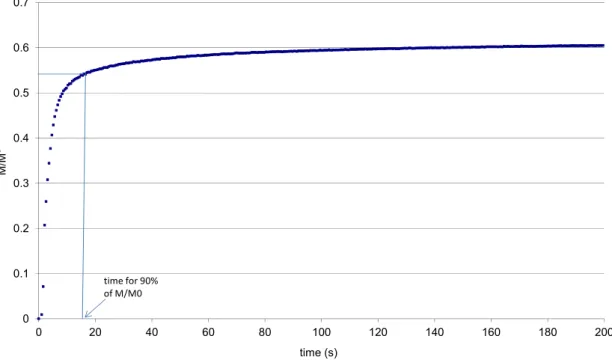
Drainage kinetics can be assessed by the measurement of the time required to recover 90% of the total mass of filtrate as illustrated figure 3. An adimensional number was defined by dividing this time by a sizing parameter of belt thickener which is equal to 60 seconds for classical industrial machines.
Figure 3: Determination of t90 with a classical drainage curve 3.1.3 Characterization of capture rate
A good capture rate is characterized by a low concentration of suspended matters in the filtrate. Consequently, a filtrate quality parameter (P3) was defined, as the ratio
between the residual concentration of suspended matters in the filtrate and the initial solids content of the sludge.
3.1.4 Drainability index
A good drainage is simultaneously characterized by a high value of P1 and low
values of P2 and P3. That is why the following equation has been considered to
define the drainability index:
Indexes α and β were defined by analyzing 92 experiments carried out on 5 different sludges (activated, digested, water supply treatment, drilling, mineral synthetic) flocculated by polymers of different nature and dosage. They were determined for P2 -α and P
3-β contribution to be equivalent to P1 in most of analyzed cases. A good
drainage requires a P value between 3 (case of concentrated sludges) and 10 (case
0 0.1 0.2 0.3 0.4 0.5 0.6 0.7 0 20 40 60 80 100 120 140 160 180 200 M/M ° time (s) time for 90% of M/M0
In order to limit the variation range the expression of the drainability index was modified as follows:
ln ln
60 3.2 Definition of a good drainage
For a good drainage, following values of parameters are required:
a) For P1, a value between 3 and 10 is usually required. Consequently, the
parameter is rejected for P1 < 3
b) For P2, the reference is 60 seconds for industrial equipment of big size. The
parameter is rejected for t90 > 60 s (or P2 > 1). Consequently, the minimum
value of P2-α is equal to 1. In the best drainage test, we observed a t90 equal to
5 seconds and the corresponding value of P2-α was equal to 1730.
c) For P3, the maximal value of SMr/Si0 was fixed at 0.01 to obtain a correct
capture ratio. The parameter is rejected for Sio/SMr < 100. Consequently, the
minimum value of P3-β is equal to 3.2.
The compilation of all the data enable to specify the following limit cases:
Limit case n°1: parameters are simultaneously equal to the minimum and maximum values which were previously specified :
P1 = 3, P2 = 1, P3 = 0.01 → Eg = 2.2
Limit case N°2: Owing to a bad flocculation, sludge flow through the filter cloth without solids retention :
P1 = 1 (no sludge concentration), P2 = 0.017 (instantaneous flowing through the filter
cloth : t90 = 1s) , P3 = 1 (no solids retention) → Eg = 12.2
Analysis of data points out that a drainage is good when the three parameters are simultaneously accepted and are characterized by a drainability index between 6 and 10.5. Table 1 summarizes the different cases and corresponding drainability index values.
Table 1: Correspondence of values for drainability index
Rejected drainage Eg < 2.2 Bad drainability kinetics
Medium drainage 2.2 < Eg < 6 1 or 2 parameters not accepted
Good drainage 6 < Eg < 10.5 All parameters values are accepted
Limit drainage 10.5 < Eg < 12.3 To be analyzed carefully according the case
Rejected drainage Eg > 12.3 No flocculation
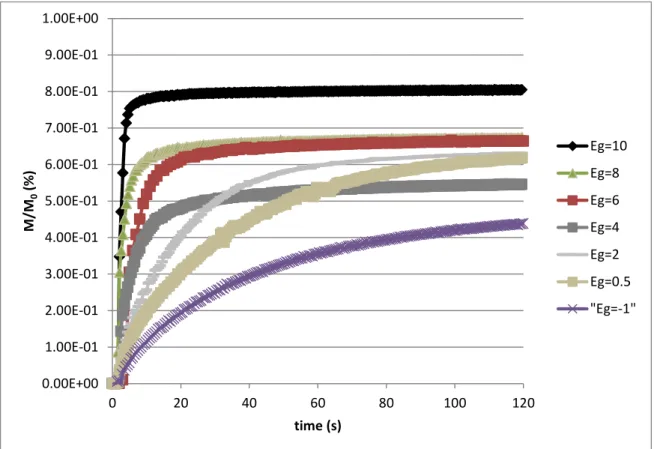
Figure 4 illustrates drainage curves corresponding to different values of the drainability index.
Figure 4: Drainage curves for different drainability index
obtained in various flocculation conditions 3.3 Influence of flocculation conditions on the drainability index
It is well known that flocculation conditions influences strongly the efficiency of a drainage process [4] [5] [10] [11]. Figure 5 gives an example for the influence of one of the flocculation parameters (P2) and consequently on the drainability index. An
increase of mixing time modifies particle size distribution and then alters the drainage kinetics. Nevertheless, an optimal mixing time for flocculation can be obtained regarding to the fact that a too long mixing leads to flocs shearing.
0.00E+00 1.00E‐01 2.00E‐01 3.00E‐01 4.00E‐01 5.00E‐01 6.00E‐01 7.00E‐01 8.00E‐01 9.00E‐01 1.00E+00 0 20 40 60 80 100 120 M/M 0 (%) time (s) Eg=10 Eg=8 Eg=6 Eg=4 Eg=2 Eg=0.5 "Eg=‐1" y = 0.0847x2‐ 3.0691x + 42.537 R² = 0.9129 5 10 15 20 25 30 35 40 t90 (s)
Figure 5: Influence of mixing time during flocculation on t90
Experiments were carried out on activated sludges by varying the flocculation operating conditions in the following ranges:
Mixing time : 15 to 35 s
Sludge concentration : 2 to 3.4%
Sludge mass by unit area of filter cloth : 1 to 2 kg/m2
Polymer dosage : 5 to 10 kg/T DS
Polymer charge density : 40 to 80% of cationicity degree
Polymer structure : linear chain, crosslinked backbone or structured chain. The most significant parameters on drainability index were found to be (by decreasing order of importance): polymer structure, sludge mass by unit area and mixing time. In the ranges specified previously, sludge concentration, polymer charge density and polymer dosage have a minor influence. For polymer dosage, this result was unexpected. However, in another work, Olivier has already [9] observed that equivalent drainage kinetics can be obtained in a wide range of polymer dosage.
4. Conclusion
This work proposes a new methodology to qualify drainage process and define a drainability index which includes the 3 most important aspects of drainage: concentration ratio, kinetics of water release and quality of filtrate. It highlights the importance of flocculation conditions on the value of drainability index and identifies the most significant parameters.
Nevertheless, opposite effects of flocculation conditions on each parameter can be hidden in the drainaibility index and further work is needed to study separately their effect on each parameter and to broaden the range of their variation.
5. Acknowledgements
The authors gratefully acknowledge the financial support received for this research from the Agence Nationale de la Recherche (ANR-08-ECOT-018-004).
6. Nomenclature
Eg: drainability index
M: mass of filtrate after drainage (g) Mo: mass of sludge before drainage (g)
P1: concentration factor
P2: kinetic parameter
P3: filtrate quality parameter
Sif: final solids content (after drainage process) (%)
Si0: initial solids content (% or g/kg)
SMr: residual concentration of suspended matters (g/kg)
t: drainage time (s)
7. References
1. Bogner R. (2007) “Mechanical sludge treatment and drying methods as process steps for sewage sludge disposal” Facing sludge diversities: Challenge, risks and
opportunities”. Proceedings IWA, 28-30 March 2007, Antalya, pp 619-628
2. Lottito V., Minninni G., Spinosa L. (1990) “Models of sewage sludge conditioning”
Wat. Sci. Tech. , 22, pp 163-172
3. Moody G., Norman P. (2006) “Optimising usage of pre-treatment chemicals”,
Filtration, 6(2), pp 119-127
4. Ginisty P., Peuchot C. and Premel A. (2007) “Role of flocculent injection and mixing conditions in sludge flocculation”. Filtration, Vol. 7, (4).
5. Ginisty P., Peuchot C. (2011) “New Laboratory Developments for sludge flocculation” Journal of Residuals Science & Technology, Vol.8, N°2, April 2011, pp 95-100
6. Severin B.F., Collins J., (1992) “Advances in predicting belt press performance from Lab data”. Wat. Env. Fed., 65th
Ann. Conf. Expo., New Orleans, Louisiana, Sept 20-24, pp 205-216
7. Severin B.F., Nye J.V. and Kim B.J., (1999). “Model and analysis of belt drainage thickening” J. Env. Eng. 125, pp 807-815.
8. Olivier J.,Vaxelaire J., Ginisty P.(2004) “Gravity drainage of activated sludge : from laboratory experiments to industrial process” J. Chem. Technol. Biotechnol. 79, 461-467
9. Olivier J., (2003), “Etudes des filtres à bandes pour la déshydratation mécanique des boues résiduaires urbaines” Université de Pau et des Pays de l’Adour, France.
10. Spinosa L., Santori M. and Lotito V. (1985) “Effect of polyelectrolyte characterization on equipment Performance” Fundamental Aspects of sludge
characterization and dewatering. Engineering Foundation Conferences. July 7-12, 1985, pp 85-100
11. Ginisty P., Peuchot C. (2011) “New laboratory developments for belt thickener optimization” Filtech 2011 – International Conference&Exhibition for F&S
Technology, March 22-24 Wiesbaden, Germany
12. Ginisty P., Peuchot C. (2010) “A review of laboratory devices to control sludge flocculation kinetics” FPS’10 – European Conference on Fluid Particle Separation, Lyon, France, October 5-7