HAL Id: hal-02190790
https://hal.archives-ouvertes.fr/hal-02190790v2
Submitted on 8 Jun 2020
HAL is a multi-disciplinary open access
archive for the deposit and dissemination of
sci-entific research documents, whether they are
pub-lished or not. The documents may come from
teaching and research institutions in France or
abroad, or from public or private research centers.
L’archive ouverte pluridisciplinaire HAL, est
destinée au dépôt et à la diffusion de documents
scientifiques de niveau recherche, publiés ou non,
émanant des établissements d’enseignement et de
recherche français ou étrangers, des laboratoires
publics ou privés.
Towards Sustainable Dairy Management - A Machine
Learning Enhanced Method for Estrus Detection
Kevin Fauvel, Véronique Masson, Elisa Fromont, Philippe Faverdin,
Alexandre Termier
To cite this version:
Kevin Fauvel, Véronique Masson, Elisa Fromont, Philippe Faverdin, Alexandre Termier. Towards
Sustainable Dairy Management - A Machine Learning Enhanced Method for Estrus Detection. In
Proceedings of the 25th ACM SIGKDD Conference on Knowledge Discovery and Data Mining, Aug
2019, Anchorage, United States. pp.3051-3059, �10.1145/3292500.3330712�. �hal-02190790v2�
Towards Sustainable Dairy Management - A Machine Learning
Enhanced Method for Estrus Detection
Kevin Fauvel
Univ Rennes, Inria, CNRS, IRISA [email protected]
V´
eronique Masson
Univ Rennes, Inria, CNRS, IRISA´
Elisa Fromont
Univ Rennes, Inria, CNRS, IRISA [email protected]
Philippe Faverdin
PEGASE, INRA, AGROCAMPUS OUEST
Alexandre Termier
Univ Rennes, Inria, CNRS, IRISAABSTRACT
Our research tackles the challenge of milk production resource use efficiency in dairy farms with machine learning methods. Reproduction is a key factor for dairy farm performance since cows milk production begin with the birth of a calf. Therefore, detecting estrus, the only period when the cow is suscepti-ble to pregnancy, is crucial for farm efficiency. Our goal is to enhance estrus detection (performance, interpretability), especially on the currently undetected silent estrus (35% of total estrus), and allow farmers to rely on automatic estrus detection solutions based on affordable data (activity, tem-perature). In this paper, we first propose a novel approach with real-world data analysis to address both behavioral and silent estrus detection through machine learning methods. Second, we present LCE, a local cascade based algorithm that significantly outperforms a typical commercial solution for estrus detection, driven by its ability to detect silent estrus. Then, our study reveals the pivotal role of activity sensors deployment in estrus detection. Finally, we propose an ap-proach relying on global and local (behavioral versus silent) algorithm interpretability (SHAP) to reduce the mistrust in estrus detection solutions.
CCS CONCEPTS
• Computing methodologies → Machine learning; • Applied computing→ Agriculture.
KEYWORDS
Sustainable Dairy Management; Machine Learning; Classifi-cation; Interpretability
Publication rights licensed to ACM. ACM acknowledges that this contribution was authored or co-authored by an employee, contractor or affiliate of a national government. As such, the Government retains a nonexclusive, royalty-free right to publish or reproduce this article, or to allow others to do so, for Government purposes only.
KDD ’19, August 4–8, 2019, Anchorage, AK, USA
© 2019 Copyright held by the owner/author(s). Publication rights licensed to ACM.
ACM ISBN 978-1-4503-6201-6/19/08. . .$15.00 https://doi.org/10.1145/3292500.3330712
ACM Reference Format:
Kevin Fauvel, V´eronique Masson, ´Elisa Fromont, Philippe Faverdin, and Alexandre Termier. 2019. Towards Sustainable Dairy Man-agement - A Machine Learning Enhanced Method for Estrus Detection. In The 25th ACM SIGKDD Conference on Knowl-edge Discovery and Data Mining (KDD ’19), August 4–8, 2019, Anchorage, AK, USA. ACM, New York, NY, USA, 9 pages. https://doi.org/10.1145/3292500.3330712
1
INTRODUCTION
As underlined in the report Creating A Sustainable Food Future [28], ruminant livestock (cattle, sheep, and goats), used for dairy and meat production, occupy two-thirds of global agricultural land and contribute roughly half of agriculture’s production-related emissions. Increased efficiency of resource use in farms is one of the most important steps toward meeting both food production and environmental goals. As a response, precision livestock farming (PLF) is a promising way to improve farm performance [30]. PLF is the use of continuous information to optimize an individualized animal management.
Nowadays, data (e.g. temperature, activity, body weight, milk production) is collected in dairy farms through different types of sensors to support farmers’ decision making in various aspects of management (e.g. reproduction, diseases, feeding, environment). Machine learning methods can help to exploit the value of this ever-growing volume of data.
Reproduction is a key factor for dairy farm performance. It directly impacts milk production as cows start to produce milk after giving birth to a calf; and milk productivity declines after the first 3 months. The most prevalent reason for cow culling, the act of slaughtering a cow, is reproduction issue (e.g. long interval between 2 calves) [3]. So, it is crucial to detect estrus, the only period when the cow is susceptible to pregnancy, to timely inseminate cows and therefore increase farm efficiency.
Traditionally, estrus detection relies on visual observation of animal behaviors. Activity usually increases markedly in cows during estrus [15] unless the cow is experiencing a silent estrus (estrus without obvious behavioral signs - 35% of total estrus). In practice, less than 50% of estruses are detected visually [25] due to two main reasons: first silent estrus can-not be detected visually and second, sexual behaviors are
mostly expressed at night. Different methods have been devel-oped to aid visual detection. The reference method is estrus estimation using automated progesterone analysis in milk [9]. However, the cost of this solution prohibits its extensive implementation.
As a result, affordable activity and body temperature sensor data are considered having potential for automatic estrus detection [27]. Some solutions based on activity data are available. However, their adoption rate remain moderate [30]. These commercial detection solutions face two major shortcomings. First, solutions based on activity cover only behavioral estruses (estruses associated with obvious behav-ioral signs - 65% of total estrus). Second, false alerts and lack of explanation behind detections generate solutions mistrust from farmers. Therefore, aside from an enhanced performance, key justifications for estrus alerts are also needed to expand automatic detection solution adoption.
1.1
Our Contributions
Our research tackles the challenge of milk production re-source use efficiency in dairy farms with machine learning methods. We aim to enhance estrus detection, especially on the currently undetected silent estrus, and allow farmers to rely on automatic estrus detection solutions based on afford-able data (e.g. activity, temperature). With our real world data analysis and an exhaustive estrus labeling (behavioral, silent) approach, this study will:
∙ Present LCE, a local cascade based algorithm for estrus detection;
∙ Show that LCE significantly outperforms a commercial reference in estrus detection;
∙ Evaluate the relevance of deploying a combination of 2 affordable sensors (activity and temperature); ∙ Identify the key drivers supporting estrus alerts at
global and local level (behavioral versus silent) based on algorithm interpretability and propose an approach to reduce solution mistrust.
2
RELATED WORK
Multivariate time series (MTS) collected from activity and temperature sensors are labeled as either estrus or anestrus, the period of sexual inactivity between two periods of estrus. Estrus detection can be formulated as a binary classifica-tion problem. In this secclassifica-tion, we first discuss the classifiers suited to our study. Then, we examine literature on classifier interpretability. Finally, we present existing work on estrus detection through machine learning methods.
2.1
Classification
Among state-of-the-art binary classifiers for numerical data and in the context of our problem, we can exclude the use of classifiers dedicated to MTS. MTS classifiers do not fit our needs for different reasons. First, current literature in animal science does not provide information to make assumption about a particular physiological model. Second, intervals [5] and shapelets [17] classification algorithms are excluded due to the short time windows we consider. Data from sensors are
24hr aggregated (the relevant period for estrus evaluation); and according to animal scientists, data on day of estrus and the day before estrus could be sufficient for estrus detection (time window size of two). Finally, dictionary representation approaches do not allow us to exploit temporal interactions between variables due to the aggregated representation of series on time [4]. Our dataset has the same frequency among variables, we manage the time aspect by setting the different timestamps as column variables.
Accordingly, we explore state-of-the-art classifiers in the following classes: k-nearest neighbors, regularized logistic regressions, support vector machines, neural networks and ensemble methods.
Firstly, we consider elastic net [31], the logistic regres-sion combining L1 and L2 regularization methods, which constitutes the reference in regularized logistic regression.
Then, given the lower number of features than the number of samples in our dataset, we test a support vector machine with a radial basis function kernel.
Among categories of neural networks (multilayer percep-tron - MLP, convolutional neural network - CNN and recur-rent neural network - RNN), we consider small MLPs. Deep MLPs, without convolutional layers, are difficult to train due to the large number of parameters and the vanishing gradient problem [23]. Moreover, our dataset size (18,000 samples) and the inexistence of a pretrained CNN network on a comparable problem do not allow us to use CNNs. Then, RNNs are not suited to the short time windows we consider. Lastly, the explicit (bagging and boosting) and implicit (negative correlation learning and mixture of experts) ap-proaches exhibit respective strengths and limitations there-fore a hybrid ensemble method is encouraged [20]. The strengths and limitations of explicit and implicit approaches concern their ability to generalize beyond the training dataset. Generalization performance depends on the balance found between an algorithm which is not capturing the underlying structure of the training dataset (underfitting - high bias) and an algorithm which is learning too closely the training dataset (overfitting - high variance). This challenge is called the bias-variance tradeoff. Negative Correlation Learning (NCL) attempts to train individual classifiers in an ensemble and combines them in the same learning process. On the entire training set, individual classifiers are trained simul-taneously and interactively through the correlation penalty terms of their error functions to adjust the bias-variance tradeoff. The disadvantage is that all individual classifiers are concerned with the whole ensemble error. Mixture of Ex-perts (ME) is an ensemble method based on the divide and conquer principle in which the problem space is divided be-tween few experts (e.g. classifiers), supervised by a dynamic weighted average scheme (gating network). It allows each expert to learn a part of the training data with its correspond-ing individual error. However, there is no control over the bias-variance tradeoff. Combinations of NCL and ME implicit approaches exist [1, 12]. These methods integrate an error function correlation penalty term to encourage different clas-sifiers (NCL), through a divide and conquer approach (ME),
to learn using different parts of the training data. However, implicit approaches combinations do not benefit from the improved generalization ability of explicitly creating different training sets by probabilistically changing the distribution of the original training data (bagging, boosting). A method combining the explicit boosting approach with implicit ME divide and conquer approach exists [13]. Nonetheless, the low bias distribution change of boosting does not ensure a bias-variance tradeoff.
Therefore, given the lower performance of small MLPs compared to ensemble methods in average (confirmed by our experiments), we propose a new hybrid ensemble method. It combines an explicit bagging-boosting approach to handle the bias-variance tradeoff and an implicit ME divide and conquer approach to learn different parts of the training data.
As previously mentioned, we cannot separate classifiers detection performance from interpretability. This will be explored in the next section.
2.2
Interpretability
There is no mathematical definition of interpretability. A definition proposed by [21] states that the higher the inter-pretability of a machine learning algorithm, the easier it is for someone to comprehend why certain decisions or predictions have been made.
Our problem requires insights into the type of estrus (be-havioral versus silent), which suggests local explanations. Morevover, we need a method able to work for the differ-ent classifiers iddiffer-entified (model-agnostic). State-of-the-art methods meeting these requirements (local, model-agnostic) are Local Interpretable Model-agnostic Explanations (LIME) [26] and SHapley Additive exPlanations (SHAP) [19]. SHAP values come with the black box local estimation advantages of LIME, but also with theoretical guarantees. Therefore, we use SHAP in order to interpret the output of our machine learning algorithm. This technique is inspired by game theory, which is used to determine how much each player in a col-laborative game has contributed to its success. In our study, SHAP values measure how much an activity or temperature variable impacts estrus predictions. A higher absolute SHAP value of a variable compared to other variables means that this variable has a higher predictive or discriminative power in detection algorithm. SHAP values are calculated by the average marginal contribution of a feature value towards the prediction over all possible coalitions. SHAP interaction values, an extension of SHAP values based on Shapley in-teraction index [14], capture pairwise inin-teraction effects. In addition, SHAP values are available at local level. We analyze it to compare the impact of variables on algorithm predictions in behavioral and silent estrus.
2.3
Automatic Estrus Detection
There are a couple of studies about the application of machine learning methods on estrus detection [11, 18, 22]. None of them uses the currently recognized method for behavioral and silent estrus identification as labels (progesterone profiles), so their estrus labeling methods are not exhaustive. Moreover,
two studies use different variables (milk volume, milking order, days since last estrus) rather than the affordable activity or temperature measurements. Finally, none of them gives insights on algorithm predictions based on its interpretability.
[22] bases the study on time series data of milk volume and milking order, using visual detection as the ground truth. Two learning schemes were tested - FOIL and C4.5. Algorithms detected 69% of estruses identified by visual method and a large number of false positives occurred (74%).
[18] learns a MLP on time series data of activity and the number of days since last estrus, using successful insemina-tion as the ground truth. The model showed a sensitivity, a specificity and an error rate of 77.5, 99.6 and 9.1% on 373 estrus.
And lastly, [11] bases the study on time series data of activity, using visual detection as the ground truth (65.6% of all estruses). Three machine learning techniques were tested - random forest, linear discriminant and MLP. Algorithms showed 91%-100% accuracy on a limited dataset of 18 cows.
3
LCE: LOCAL CASCADE ENSEMBLE
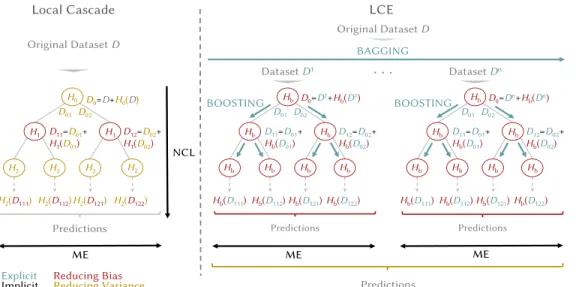
As mentioned previously, we propose a new hybrid ensem-ble method which combines an explicit bagging-boosting approach to handle the bias-variance tradeoff and an implicit ME divide and conquer approach to individualize classifier error on different parts of the training data. We have decided to start from an existing combined implicit (NCL and ME) stacking-based approach (cascade generalization [29]): local cascade [16]. The bagging/boosting potential of local cascade decision tree divide and conquer method motivates our choice. In this section, we first introduce local cascade, the initial implicit stacking-based approach. Next, we explain LCE, our augmented (explicit and implicit) version of local cascade, and then compare LCE performance to local cascade. Figure 1 illustrates the presentation of local cascade and LCE.
3.1
Local Cascade
First of all, cascade generalization uses a set of classifiers sequentially and at each step adds new attributes to the original dataset [29]. The new attributes are derived from the class probabilities given by a base classifier (e.g. 𝐻0(𝐷),
𝐻1(𝐷01) in Figure 1). The bias-variance tradeoff is obtained
by negative correlation learning: at each stage of the sequence, classifiers with different behaviors are selected. It is recom-mended in cascade generalization to begin with a low variance algorithm to draw stable decision surfaces (𝐻0 in Figure 1)
and then use a low bias algorithm to fit more complex ones (𝐻1 in Figure 1). Local cascade [16] applies cascade
general-ization locally following a divide and conquer strategy based on mixture of experts principle. The objective of this ap-proach is to capture new relations that cannot be discovered globally. The local cascade divide and conquer method is a decision tree. When growing the tree, new attributes (class probabilities from a classifier - base classifier) are computed at each decision node and propagated down the tree. In order to be applied as a predictor, local cascade stores, in each node, the model generated by the base classifier.
Reducing Bias Reducing Variance NCL ME Original Dataset D Predictions ME LCE BAGGING Original Dataset D Predictions H0 D0=D+H0(D) H1 H1 H2 H2 H2 H2 D11=D01+ H1(D01) D12=D02+ H1(D02) H2(D111) H2(D112) H2(D121) H2(D122) D01D02 Implicit Explicit Predictions DatasetD1 Predictions DatasetDn ME
. . .
Local Cascade Hb D0=D1+Hb(D1) Hb Hb Hb Hb Hb Hb D11=D01+ Hb(D01) D12=D02+ Hb(D02) Hb(D111) Hb(D112) Hb(D121) Hb(D122) D01 D02 BOOSTING Hb D0=Dn+Hb(Dn) Hb Hb Hb Hb Hb Hb D11=D01+ Hb(D01) D12=D02+ Hb(D02) Hb(D111) Hb(D112) Hb(D121) Hb(D122) D01 D02 BOOSTINGFigure 1: Local Cascade versus LCE
3.2
LCE: Local Cascade Ensemble
Our contribution intervenes in our explicit manner of han-dling the bias-variance tradeoff whereas local cascade ap-proach is implicit, alternating between base classifiers behav-iors (bias, variance) at each level of the tree.
LCE reduces bias across decision tree through the use of boosting as base classifier (𝐻𝑏 in Figure 1). Boosting
base classifier iterative data distribution change (reweighting) decreases the bias at each tree level. In addition, boosting is propagated down the tree by adding class probabilities of the base classifier to the training dataset (new attributes). Class probabilities contain information about the ability of the base classifier to correctly classify a sample. At the next tree level, class probabilities added to the dataset are exploited by the base classifier as a weighting scheme to focus more on previously misclassified samples.
Then, the overfit generated by the decision tree divide and conquer bias reduction approach is mitigated by the use of bagging. Bagging provides variance reduction by cre-ating multiple decision trees from different subsamples of the original dataset (random sampling with replacement, see 𝐷1. . . 𝐷𝑛 in Figure 1). Trees are aggregated with a simple
majority vote.
LCE new hybrid ensemble method enables to balance the bias-variance tradeoff without the need for an interactive learning between individual classifiers (NCL), while benefiting from the improved generalization ability of explicitly creating different training sets (bagging, boosting). Furthermore, LCE divide and conquer method ensures that classifiers learn on different parts of training data without the need for a supervision scheme (gating network).
We present LCE pseudocode in Algorithm 1. A function (LCE Tree) builds a tree and the second one (LCE) the forest
of trees through bagging.
There are 2 stopping criteria during a tree building phase: when a node has an unique class or when the tree reaches the maximum depth. We set the range of tree depth from 0 to 3 in
Algorithm 1 LCE: Local Cascade Ensemble
Require: A dataset 𝐷, a set of classifiers 𝐻, maximum depth of a tree 𝑚𝑎𝑥 𝑑𝑒𝑝𝑡ℎ, number of trees 𝑛 𝑡𝑟𝑒𝑒𝑠 1: function LCE(𝐷, 𝐻, 𝑛 𝑡𝑟𝑒𝑒𝑠, 𝑚𝑎𝑥 𝑑𝑒𝑝𝑡ℎ)
2: 𝐹 ← ∅
3: for each 𝑖 in [1, 𝑛 𝑡𝑟𝑒𝑒𝑠] do
4: 𝑆 ← A bootstrap sample from 𝐷 5: 𝑡 ← LCE Tree(𝑆, 𝐻, 𝑚𝑎𝑥 𝑑𝑒𝑝𝑡ℎ, 0) 6: 𝐹 ← 𝐹 ∪ 𝑡
7: return 𝐹
8: function LCE Tree(𝐷, 𝐻, 𝑚𝑎𝑥 𝑑𝑒𝑝𝑡ℎ, 𝑑𝑒𝑝𝑡ℎ) 9: if 𝑚𝑎𝑥 𝑑𝑒𝑝𝑡ℎ or uniform class then 10: return leaf
11: else
12: 𝐷′← Concatenate(𝐷, 𝐻𝑑𝑒𝑝𝑡ℎ(𝐷))
13: Split 𝐷′on attribute maximizing Gini criterion 14: 𝑑𝑒𝑝𝑡ℎ ← 𝑑𝑒𝑝𝑡ℎ + 1
15: for 𝐷′(𝑗)∈ 𝒫(𝐷′
) do
16: 𝑇 𝑟𝑒𝑒𝑗 = LCE Tree(𝐷′(𝑗), 𝐻, 𝑚𝑎𝑥 𝑑𝑒𝑝𝑡ℎ,
𝑑𝑒𝑝𝑡ℎ)
17: return tree containing a decision node, stor-ing classifier 𝐻𝑑𝑒𝑝𝑡ℎ(𝐷) and descendant subtrees
𝑇 𝑟𝑒𝑒𝑗
LCE instead of 0 to 5 in local cascade. This hyperparameter is used to control overfitting. Our choice of low bias boosting base classifiers justifies the maximum depth adjustment to 3. In this study, the set of low bias base classifiers is limited to the state-of-the-art boosting algorithm (extreme gradient boosting - XGB [8]).
In addition, we removed two rules implemented in local cascade to reduce variance: the maximum base classifier error rate and the minimum class representation in a node. The first rule requires the stopping of propagation down the tree to prevent overfitting if the base classifier, in a node, had an error rate below a certain threshold (0.5). Our approach
suggests a variance reduction through bagging, and not during a tree construction; so we did not keep this rule. In order to restrict the attention to well populated classes, the second rule requires considering a class in a node if the number of examples belonging to this class is greater than 𝑁 times (3) the number of attributes. We did not keep the second rule for the same reason.
3.3
Performance Comparison: Local
Cascade versus LCE
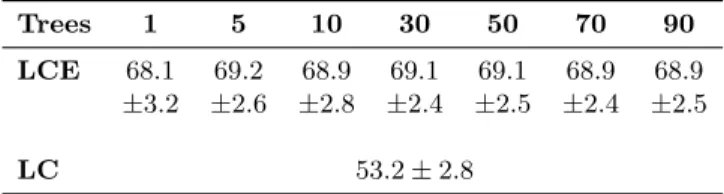
Our comparison aims to underline the superior performance of LCE compared to a local cascade on our real-world dataset, in-duced by their different approaches of handling bias-variance tradeoff (explicit versus implicit approach). LCE is imple-mented according to the description given in the previous section. Local cascade implementation corresponds to the description of the original paper and as recommended, we use naive bayes for low variance base classifier. In order to be comparable, the low bias base classifier is XGB. Depth is set to 1 for LCE and the local cascade. Results are presented in Table 1.
Table 1: F1 score with 95% confidence interval of LCE versus local cascade (LC) on our dataset
Trees 1 5 10 30 50 70 90 LCE 68.1 69.2 68.9 69.1 69.1 68.9 68.9
±3.2 ±2.6 ±2.8 ±2.4 ±2.5 ±2.4 ±2.5
LC 53.2 ± 2.8
As expected, results show a higher variability across folds of LCE compared to the local cascade when the number of tree is set to 1 due to its low bias orientation (standard error of 1.6% versus 1.4% on F1 score, performance calculation detailed in section Experiments). However, LCE on 1 tree exhibits a higher detection performance than local cascade (F1 score: 68.1% versus 53.2%).
Additionally, through bagging, we observe LCE variability reduction to a lower level than local cascade as well as an increase of detection performance (F1 score 95% confidence interval: 68.1 ± 3.2 with 1 tree versus 68.9 ± 2.4 with 70 trees versus 53.2 ± 2.8 with local cascade).
Therefore, this comparison affirms the superiority of our explicit bias-variance tradeoff approach compared to the im-plicit NCL approach of local cascade on our dataset. The intrinsic different behavior of LCE and local cascade is con-firmed in the results and discussions section.
4
EXPERIMENTS
In this section, we present the composition of our real-world dataset, the preprocessing performed and the experimental setting.
4.1
Dataset
Our dataset is offline. From 2014 to 2017, an experiment was conducted at the INRA M´ejusseaume dairy farm (4806’
N, 147’ W, Brittany, France). This experiment enrolled 125 Holstein cows housed in free stalls representing 153 lactations. Each cow was equipped with a collar-mounted activity meter (HeatPhone - Medria Technologies, Chˆateaubourg, France) and a temperature sensor in first stomach (Thermobo-lus - Medria Technologies, Chˆateaubourg, France). Based on its good performance compared to other solutions [7] and its international market presence, we hold that Medria es-trus detection system is a reasonable basis of comparison. In the following sections, Medria is called the commercial solution (CS). The dataset consists of visual estrus alerts, Medria estrus alerts and Medria numeric variables with a 5-minute frequency (rumination, ingestion, rest, standing up, overactivity, other activity, temperature, and temperature cor-rected ). Temperature corcor-rected takes into account the cooling effect of water ingestion by the cows. Concerning the visual estrus alerts, visual observation was conducted by farm staffs. Staff also checked the commercial solution alerts before in-putting their visual records, thus these visual estrus alerts are shown as Visual&CS in the study. The preprocessing applied on the data collected is a 24hr aggregation (activity: sum, temperature: mean) which corresponds to the relevant win-dow for both estrus detection and, from an alert standpoint, farmers’ needs. We assume that the treatment operated by Medria on raw data to generate variables is stable during our experiment.
Our novel approach addresses both estrus categories detec-tion (behavioral and silent). Therefore, we labeled estrus by measuring the progesterone concentration in whole milk, the current reference for an exhaustive estrus identification. This time-effective and non-invasive method for the cow induces commonly accepted errors (progesterone measurements, pro-files analysis [2]). We mark an estrus as behavioral estrus when either a visual detection or a Medria alert occurred. An estrus is considered silent when neither visual detection or a Medria alert occurred. Our dataset is composed of 671 estruses with 37% of silent estrus which is aligned with the rate of 35% observed in literature [24].
Days preceding estrus are a valuable source of information for estrus detection, we set it as a hyperparameter. Every value in the range from 1 to 21 days, the length of a regular ovarian cycle, are tested. Past days of variables are added as feature columns.
4.1.1 Feature Selection. We perform feature selection in this study because of the sensitivity of the method chosen to in-terpret the detection algorithm (SHAP) to high correlations among features. We conduct a subset selection on pairs of collinear features based on the Pearson correlation coefficient (threshold 0.8). One pair of features is above the threshold (0.9: temperature corrected, temperature). Since temperature is affected by the cooling effet of water ingestion, the variable temperature corrected is selected. From this point onwards, temperature corrected is named temperature. After this fea-ture selection, no Pearson pairwise correlation in the case of the 21 past days dataset is above the threshold.
4.1.2 Dataset Structure. We make a 5-fold cross validation. Dataset split is presented in Table 2.
Table 2: Dataset Split
Fold1 Fold2 Fold3 Fold4 Fold5 All Estrus 126 136 118 141 153 671 Silent % 33 40 24 40 46 37
The split has kept the same number of days in estrus in each fold (1,144 days). We made this choice to avoid overfitting on a particular animal. We discuss the impact of a split keeping the same number of animals per fold in the detection performance section. Moreover, we do not observe any structural imbalance on silent estrus percentage across the folds.
4.2
Experimental Setting
We present in this section algorithms and methods used in our experiments.
4.2.1 Algorithms. We tested our hybrid ensemble LCE (ex-plicit - im(ex-plicit approaches) versus the initial im(ex-plicit ap-proach (local cascade) and the state-of-the-art algorithm for each explicit approach (bagging: random forest, boosting: extreme gradient boosting). K-nearest neighbors, elastic net, support vector machines and small MLPs are also tested.
∙ k-nearest neighbors - KNN: we use the implementa-tion neighbors.KNeighborsClassifier in the scikit-learn package for Python1
∙ Elastic net - EN: we use the implementation linear model SGDClassifier in the scikit-learn package for Python1
∙ Support Vector Machine - SVM: we use the implemen-tation svm.SVC in the scikit-learn package for Python1 ∙ Random Forest - RF: we use the implementation ensem-ble.RandomForestClassifier in the scikit-learn package for Python1
∙ Extreme Gradient Boosting - XGB: we use the imple-mentation in the xgboost package for Python2
∙ Local cascade - LC: algorithm has been reimplemented in Python 2.7 based on the description of the paper since no public version available.
∙ LCE: algorithm implemented in Python 2.7
∙ Multilayer Perceptron - MLP: we use the implementa-tion available in the package Keras for Python3 and limit the neural network architecture to 3 layers 4.2.2 Optimization of Hyperparameters. Hyperparameters of classifiers are set by hyperopt, a sequential model-based opti-mization using a tree of Parzen estimators search algorithm [6]. Hyperopt chooses the next hyperparameters decision from the previous choices and a tree-based optimization algo-rithm. Tree of Parzen estimators meet or exceed grid search and random search performance for hyperparameters setting.
1https://scikit-learn.org/stable/
2https://xgboost.readthedocs.io/en/latest/python/ 3https://keras.io/
We use the implementation available in the Python package hyperopt4 and hyperas wrapper for keras. Optimization is undertaken to maximize F1 score. The choice of this metric is driven by 2 reasons. First, we do not make assumption about the dairy management style; farmers can favor a higher es-trus detection rate (higher recall) or fewer false alerts (higher precision) according to their needs. Second, we face a class imbalance (33% of estrus days) which renders irrelevant the accuracy metric.
4.2.3 Classification Performance. Our experiments use pro-gesterone profiles as ground truth for exhaustive estrus identi-fication. The levels of progesterone allow us to identify a time window of 3 days for estrus with a duration of less than 24 hours, in the standard scheme. Adopting a conservative ap-proach, we decided to aggregate by the maximum of our daily predictions on estrus/anestrus period to calculate the classi-fication performance. In addition, we observe that for high thresholds (threshold > 0.95), classifiers performances are unstable with a significant decrease in estrus detection rate (recall below 70%). In addition, for low thresholds (threshold < 0.1), classifiers are equivalent to a random classifier. So, we decided to adopt a F1 score calculation based on the average of F1 score on threshold range 0.1-0.95. This calcu-lation does not modify the classifier selection results or the comparison result with the commercial solution. Nonetheless, it corresponds to the plausible range of calibration for dairy management and shows a detection performance closer to real conditions.
4.2.4 Algorithm Selection. Based on a 5-fold cross-validation 60/20/20 train/validation/test split, the best classifier is selected based on the highest F1 score on validation sets. 4.2.5 Statistical Test. As recommended by [10], we have used a 5 × 2 cross validation t-test for statistical significance of machine learning algorithms on one dataset.
4.2.6 Interpretability. As mentioned in the related work sec-tion, we use the SHAP implementation available in the Python package shap5.
5
RESULTS AND DISCUSSIONS
This section is structured into two parts: performance and interpretability. The detection performance part compares LCE to other detection methods (classifiers, commercial so-lution) and evaluates the relevance of deploying 2 sensors. Then, we identify the key drivers (variables impact, tempo-ral interactions) behind the estrus detection alerts at global and local level (behavioral versus silent) based on algorithm interpretability (SHAP) and propose an approach to reduce the solution mistrust.
5.1
Detection Performance
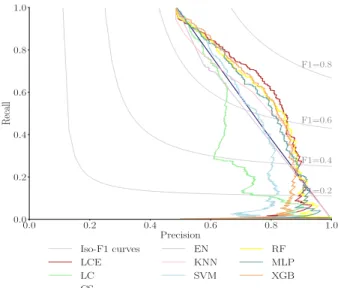
Classification results on test sets are presented in Figure 2.
4https://github.com/hyperopt/hyperopt 5https://github.com/slundberg/shap
0.0 0.2 0.4 0.6 0.8 1.0 Precision 0.0 0.2 0.4 0.6 0.8 1.0 Recall F1=0.2 F1=0.4 F1=0.6 F1=0.8 Iso-F1 curves LCE LC CS EN KNN SVM RF MLP XGB
Figure 2: Precision recall curves on test sets of the classifiers versus the commercial solution
The best classifier on validation sets is LCE with the following hyperparameters: 3 past days, depth equals to 1 and 70 trees. We do not observe an overfit of LCE, the performance observed on test sets (F1 score: 68.9) is stable compared to the one of the validation sets (F1 score: 68.1). Furthermore, the performance of LCE responds to the objective of an increase in performance in both estrus detec-tion rate and fewer false alerts compared to the commercial solution (CS). At the same precision, LCE recall is constantly higher than commercial solution recall. At a precision of 78%, the precision rate of the commercial solution in this study, our algorithm detects 22% more estrus.
5.1.1 Comparative Analysis. We compare the error rate cor-relation of LCE to those of other detection methods. This comparison allows us to:
∙ gain insights into the shortcomings of the commercial solution and LCE detections
∙ identify limitations of our approach for deployment A low correlation indicates that classifiers err in differ-ent regions of the instance space. Table 3 presdiffer-ents Pearson correlations of LCE prediction errors with other detection methods (classifiers and commercial solution) on test sets. In order to be comparable, we have set the threshold of each classifier with the same precision as the commercial solution (78%).
Table 3: Pearson pairwise correlations of LCE pre-diction errors with other detection methods on test sets
KNN EN SVM MLP RF XGB LC CS 0.61 0.19 0.57 0.69 0.73 0.8 0.41 0.37 First, the commercial solution shows an intrinsic differ-ent behavior from that of LCE (correlation: 0.37). This low
correlation is mainly explained by the null performance of the commercial solution on silent estrus detection across the herd. On 67% of the cows, composed of a slighlty higher proportion of silent estrus compared to average (40% versus 37%), predictions correlation of the commercial solution with LCE is 0.21 ± 0.03.
Next, the low correlation between LCE and local cascade (0.41) confirms the value added by the explicit bias-variance tradeoff of the LCE approach. This low correlation is ex-plained by the low recall (11%) of the local cascade for a precision of 78%. The stable decision surface drawn by naive bayes at the root of the local cascade decision tree substan-tially limits the range of performance of the algorithm on our dataset (recall drops with a precision higher than 66%). We observe this performance drop for precision above 66% in Figure 2.
Finally, the classifier with the closest behavior to LCE is XGB (0.8). However, the correlation difference remains sub-stantial and is explained by some divergence among few cows. The divergence, an error rate correlation below 0.6, concerns 12% of the cows comprising a proportion of silent estrus aligned with average (35%). Therefore, our bias-variance ap-proach enhances XGB performance on standard cases (cows with 35% of silent estrus). Nevertheless, we observe a poor performance of LCE on 11% of the cows exhibiting a high proportion of silent estrus (F1 score < 55%, silent estrus proportion: 54%). Silent estrus are not equally distributed among cows. In our dataset, 16% of the cows represent 40% of the silent estrus. LCE performance per cow is exposed to the animal estrus type proportion. It is confirmed by the LCE performance drop when assessed on the activity and tem-perature dataset generated by a stratified 5-fold on animals (66.3 ± 3.4). LCE performance per cow variability according to the animal estrus type proportion is a limitation of our solution for deployment; meanwhile it is also a driver for detection improvement. We suggest further investigation to incorporate additional animal individual features.
5.1.2 One or Two Sensors? In order to answer this question, we compare the detection performance on test sets of LCE on the temperature, the activity and both variables. We also compare LCE detection results to the commercial solution and visual method.
First, the results confirm the potential of data science techniques for automatic estrus detection versus visual de-tection as concluded by [11]. We observe that LCE for both behavioral and silent estrus detection, trained on activity and temperature data, manifests significantly better performance (F1 score and lower variability) than Visual&CS (68.9 ± 2.4 versus 60.4 ± 4.6, 𝑃 < 0.05). Our Visual&CS performance is aligned with the state-of-the-art [25]; the detection rate is slightly below 50% (47%).
Second, we observe a better performance (higher F1 score and lower variability) with our algorithm trained on ac-tivity and temperature than acac-tivity or temperature alone (68.9 ± 2.4 versus 67.0 ± 3.0 versus 55.9 ± 2.3). The perfor-mance difference is only significant when compared to the
Figure 3: Average impact of the attributes on algorithm predictions for estrus and anestrus. Abbreviations: DOE - Day Of Estrus; DBE - Day Before Estrus
algorithm trained using the temperature. We infer that, in the conditions of our experiment, only activity sensor should be deployed: the performance is not significantly lower than that trained with two sensors (activity and temperature).
Nonetheless, temperature information cannot be excluded. We observe a markedly lower variability of the algorithm based on temperature across folds which allows the algorithm based on activity and temperature to reduce its variability. It means that the algorithm based on temperature is consistent on different data. It implies a possible higher discriminative and generalizing power. We propose to further study the potential of temperature data for estrus detection with a broader data heterogeneity (cows breed, environment). The next step would consist of a partnership with an automatic detection solution provider to have access to a more diverse dataset.
5.2
Interpretability of our Solution
In this section, we firstly present the relative impact of vari-ables in LCE predictions and their temporal interactions. Then, we propose an approach to give insights on estrus detection to the farmers based on these elements.
Figure 3 shows the average impact of each variable on algorithm predictions for estrus and anestrus by decreasing order.
These results confirm the discriminative power of the tem-perature and its potential for improving estrus detection performance. The variable with the strongest impact to algo-rithm predictions is the temperature on the day of estrus for both estrus and anestrus classes.
Next, we observe that the ranking of all activity variables are different with a significant rank change between estrus and anestrus. Therefore, the relative impact of each activ-ity variable in LCE predictions differs between estrus and anestrus. Overactivity on the day of estrus, a typical char-acteristic of most estrus (65%), appears as the third most
impactful variable after temperature estrus and does not appear on the top 20 of variables for anestrus.
By taking the same impact ranking approach locally for behavioral versus silent estrus, we also observe a significant change on the ranking of activity variables (75% of rank change). Rumination 2 days before estrus is a key variable in silent estrus detection. It is the third most impactful activity variable for silent estrus and appears at the 19th position for behavioral estrus.
Finally, temporal relations among variables differ between behavioral and silent estrus. SHAP interaction values reveal that algorithm predictions are more impacted by activity variables further to the day of estrus for silent estrus than behavioral estrus. For example, the variable of highest inter-action with rumination on the day of estrus is the rest 3 days before estrus for silent estrus versus the rest 2 days before estrus for behavioral estrus. This observation holds true for over activity, standing up and ingestion (two third of activity variables).
Therefore, in order to support LCE estrus alerts and ease solution adoption, we propose an approach based on LCE interpretability (activity sensor only). First, communicate to the farmer the relatedness of the estrus detection to historical cases through a confidence indicator and the amplitude of differences in the 3 most impactful activity variables (rest 3 days before estrus, over activity 2 days before estrus and over activity on the day of estrus). The confidence indicator corresponds to the weighted average of absolute SHAP values differences by the ranking of impact variables for estrus from our reference presented above. Second, in case of estrus, in-form the farmer about the type of estrus (behavioral/silent) with a confidence level and which temporal interactions are satisfied. The information about the type of estrus aims to reassure farmers when they are not able to verify the estrus alert by visual behavioral signs, therefore reduce potential
mistrust. Confidence level is calculated like the previous one but using ranking of variables impact of silent estrus as a ref-erence. In addition, temporal interactions are communicated in decreasing order of variable impact.
6
CONCLUSION
Our study confirms the significant performance improve-ment of LCE on estrus detection compared to commercial solutions, a result driven by silent estrus detection. It also proves the pivotal role of activity sensors deployment in these detections. The interpretability of LCE offered by SHAP, dis-closing information about the relatedness of the predictions to historical cases and the possibility of visually verifying the estrus (behavioral versus silent), promises mistrust reduction from farmers. Concerning the deployment of our solution, the homogeneity (cows breed, environment) of our dataset is a limitation. The next step would consist of a partnership with an automatic detection solution provider to have access to a heterogeneous dataset.
ACKNOWLEDGMENTS
We thank all technical staff of INRA M´ejusseaume dairy farm who helped managing and monitoring this long-term experimentation. We also thank Medria for its collaboration by providing activity and temperature sensor data. This work was supported by the French National Research Agency under the Investments for the Future Program (ANR-16-CONV-0004), French national project Deffilait (ANR-15-CE20-0014) and APIS-GENE.
REFERENCES
[1] E. Abbasi, M. Shiri, and M. Ghatee. 2016. Root-Quatric Mixture of Experts for Complex Classification Problems. Expert Systems with Applications 53 (2016).
[2] I. Adriaens, W. Saeys, T. Huybrechts, C. Lamberigts, L. Franois, K. Geerinckx, J. Leroy, B. De Ketelaere, and B. Aernouts. 2018. A Novel System for On-Farm Fertility Monitoring Based on Milk Progesterone. Journal of Dairy Science 101, 9 (2018). [3] S. Bascom and A. Young. 1998. A Summary of the Reasons Why
Farmers Cull Cows. Journal of dairy science 81, 8 (1998). [4] M. Baydogan and G. Runger. 2014. Learning a Symbolic
Represen-tation for Multivariate Time Series Classification. Data Mining and Knowledge Discovery 29, 2 (2014).
[5] M. Baydogan, G. Runger, and E. Tuv. 2013. A Bag-of-Features Framework to Classify Time Series. IEEE Transactions on Pat-tern Analysis and Machine Intelligence 35, 11 (2013). [6] J. Bergstra, R. Bardenet, Y. Bengio, and B. K´egl. 2011.
Algo-rithms for Hyper-Parameter Optimization. In Advances in Neural Information Processing Systems 24, J. Shawe-Taylor, R. S. Zemel, P. L. Bartlett, F. Pereira, and K. Q. Weinberger (Eds.). Curran Associates, Inc.
[7] A. Chanvallon, S. Coyral-Castel, J. Gatien, J. Lamy, D. Ribaud, C. Allain, P. Cl´ement, and P. Salvetti. 2014. Comparison of Three Devices for the Automated Detection of Estrus in Dairy Cows. Theriogenology 82, 5 (2014).
[8] T. Chen and C. Guestrin. 2016. XGBoost: A Scalable Tree Boost-ing System. In ProceedBoost-ings of the 22Nd ACM SIGKDD Interna-tional Conference on Knowledge Discovery and Data Mining. [9] E. Cutullic, L. Delaby, Y. Gallard, and C. Disenhaus. 2011. Dairy
Cows’ Reproductive Response to Feeding Level Differs According to the Reproductive Stage and the Breed. Animal 5, 5 (2011).
[10] T.G. Dietterich. 1998. Approximate Statistical Tests for Com-paring Supervised Classification Learning Algorithms. Neural Computation 10, 7 (1998).
[11] K.A. Dolecheck, W.J. Silvia, G.Jr Heersche, Y.M. Chang, D.L. Ray, A.E. Stone, B.A. Wadsworth, and J.M. Bewley. 2015. Behav-ioral and Physiological Changes Around Estrus Events Identified Using Multiple Automated Monitoring Technologies. Journal of Dairy Science 98, 12 (2015).
[12] R. Ebrahimpour, S. Arani, and S. Masoudnia. 2013. Improving Combination Method of NCL Experts Using Gating Network. Neural Computing and Applications 22, 1 (2013).
[13] R. Ebrahimpour, N. Sadeghnejad, S. Arani, and N. Mohammadi. 2013. Boost-Wise Pre-Loaded Mixture of Experts for Classification Tasks. Neural Computing and Applications 22, 1 (2013). [14] K. Fujimoto, I. Kojadinovic, and J.L. Marichal. 2006. Axiomatic
Characterizations of Probabilistic and Cardinal-Probabilistic In-teraction Indices. Games and Economic Behavior 55, 1 (2006). [15] C. Gaillard, H. Barbu, M.T. Sørensen, J. Sehested, H. Callesen,
and M. Vestergaard. 2016. Milk Yield and Estrous Behavior During Eight Consecutive Estruses in Holstein Cows Fed Stan-dardized or High Energy Diets and Grouped According to Live Weight Changes in Early Lactation. Journal of Dairy Science 99, 4 (2016).
[16] J. Gama and P. Brazdil. 2000. Cascade Generalization. Machine Learning 41, 3 (2000).
[17] I. Karlsson, P. Papapetrou, and H. Bostr¨om. 2016. Generalized Random Shapelet Forests. Data Mining and Knowledge Discov-ery 30, 5 (2016).
[18] J. Krieter. 2005. Oestrus Detection in Dairy Cows Using Control Charts and Neural Networks. In Proceedings of 56th Annual Meeting of the European Association for Animal Production. Commission on Cattle Production.
[19] S. Lundberg and S. Lee. 2017. A Unified Approach to Inter-preting Model Predictions. In Advances in Neural Information Processing Systems 30, I. Guyon, U. V. Luxburg, S. Bengio, H. Wallach, R. Fergus, S. Vishwanathan, and R. Garnett (Eds.). Curran Associates, Inc.
[20] S. Masoudnia and R. Ebrahimpour. 2014. Mixture of Experts: A Literature Survey. Artificial Intelligence Review 42, 2 (2014). [21] T. Miller. 2017. Explanation in Artificial Intelligence: Insights
from the Social Sciences. ArXiv (2017).
[22] R.S Mitchell, R.A. Sherlock, and L.A. Smith. 1996. An Investiga-tion Into the Use of Machine Learning for Determining Oestrus in Cows. Computers and Electronics in Agriculture 15, 3 (1996). [23] M.A. Nielsen. 2015. Neural Networks and Deep Learning.
Deter-mination Press.
[24] M.A. Palmer, G. Olmos, L.A. Boyle, and J.F. Mee. 2010. Estrus Detection and Estrus Characteristics in Housed and Pastured Holstein-Friesian Cows. Theriogenology 74, 2 (2010).
[25] O.A. Peralta, R.E. Pearson, and R.L. Nebel. 2005. Comparison of Three Estrus Detection Systems During Summer in a Large Commercial Dairy Herd. Animal Reproduction Science 87, 1 (2005).
[26] M.T. Ribeiro, S. Singh, and C. Guestrin. 2016. “Why Should I Trust You?”: Explaining the Predictions of Any Classifier. In Pro-ceedings of the 22Nd ACM SIGKDD International Conference on Knowledge Discovery and Data Mining.
[27] M. Saint-Dizier and S. Chastant-Maillard. 2012. Towards an Automated Detection of Oestrus in Dairy Cattle. Reproduction in Domestic Animals 47, 6 (2012).
[28] T. Searchinger, R. Waite, C. Hanson, J. Ranganathan, P. Dumas, and E. Matthews. 2018. Creating a Sustainable Food Future. World Resources Institute.
[29] M. Sesmero, A. Ledezma, and A. Sanchis. 2015. Generating En-sembles of Heterogeneous Classifiers Using Stacked Generalization. Wiley Interdisciplinary Reviews: Data Mining and Knowledge Discovery 5, 1 (2015).
[30] W. Steeneveld and H. Hogeveen. 2015. Characterization of Dutch Dairy Farms Using Sensor Systems for Cow Management. Journal of Dairy Science 98, 1 (2015).
[31] H. Zou and T. Hastie. 2005. Regularization and Variable Selection via the Elastic Net. Journal of the Royal Statistical Society. Series B (Statistical Methodology) 67, 2 (2005).