HAL Id: hal-00956695
https://hal.archives-ouvertes.fr/hal-00956695
Submitted on 7 Mar 2014
HAL is a multi-disciplinary open access
archive for the deposit and dissemination of sci-entific research documents, whether they are pub-lished or not. The documents may come from
L’archive ouverte pluridisciplinaire HAL, est destinée au dépôt et à la diffusion de documents scientifiques de niveau recherche, publiés ou non, émanant des établissements d’enseignement et de
diffraction studies in the Paris-Edinburgh cell using a
laboratory X-ray source
Pierre Toulemonde, Céline Goujon, Laetitia Laversenne, Pierre Bordet, Rémy
Bruyère, Murielle Legendre, Olivier Leynaud, Alain Prat, Mohamed Mezouar
To cite this version:
Pierre Toulemonde, Céline Goujon, Laetitia Laversenne, Pierre Bordet, Rémy Bruyère, et al.. High pressure and high temperature in situ X-ray diffraction studies in the Paris-Edinburgh cell using a laboratory X-ray source. High Pressure Research, Taylor & Francis, 2014, 34 (2), pp.167-175. �10.1080/08957959.2013.873425�. �hal-00956695�
To appear in High Pressure Research Vol. 00, No. 00, Month 20XX, 1–9
HP-HT in-situ X-ray diffraction studies in Paris-Edinburgh cell using a laboratory X-ray source
P. Toulemondea ∗, C. Goujona , L. Laversennea , P. Bordeta , R. Bruy`erea , M. Legendrea , O. Leynauda , A. Prata and M. Mezouarb a
Univ. Grenoble Alpes, Inst NEEL, F-38042 Grenoble, France. CNRS, Inst NEEL, F-38042 Grenoble, France;b
European Synchrotron Radiation Facility, Grenoble F-38043 France. (sept.2013)
We have developed a new laboratory experimental setup to study in-situ the pressure-temperature phase diagram of a given pure element or compound, its associated phase tran-sitions, or the chemical reactions involved at high pressure and high temperature (HP-HT) between different solids and liquids. This new tool allows laboratory studies before conducting further detailed experiments using more brilliant synchrotron x-ray sources or before kinetic studies.
This device uses the diffraction of x-rays produced by a quasi-monochromatic micro-beam source operating at the silver radiation (λ(Ag)Kα1,2 ≈ 0.56 ˚A). The experimental setup is based on a VX Paris Edinburgh cell equipped with WC or sintered diamond anvils and uses standard B-epoxy 5 mm or 7 mm gaskets. The diffracted signal coming from the compressed (and heated) sample is collected on an image plate. The pressure and temperature calibrations were performed by diffraction, using conventional calibrants (BN, NaCl, MgO) for determi-nation of the pressure, and by crossing isochores of BN, NaCl, Cu or Au for determidetermi-nation of the temperature.
The first examples of studies performed with this new laboratory setup are presented in the article: determination of the melting point of germanium and magnesium under HP-HT, synthesis of MgB2 or C-diamond, partial study of the P,T phase diagram of MgH2.
Keywords:X-ray diffraction; laboratory setup; Paris-Edinburgh cell; high pressure crystallography; phase diagram; phase transitions.
1. Introduction
The recent development of synchrotron radiation sources has made easier the study of pressure-temperature phase diagrams of pure elements or compounds by in-situ x-ray diffraction. In addition to this development of brilliant x-ray sources, the use of diamond anvil cells (DAC) in such experiments has permitted, for example, the measurement of melting curves of pure elements at very high temperature and pressure. DAC are also sometimes used in setups using laboratory x-ray sources ([1] and references therein).
In synchrotron and neutron sources large volume cells are also used, i.e. multi-anvil presses and Paris-Edinburgh cells. One obvious advantage of using a PE cell compared to a DAC is the sample volume probed, typically 1-5 mm3: phase transitions observed
in PE cells really characterize the main phase and not minor phases or impurities. In addition, considering the acquisition time with laboratory x-ray sources, the thermody-namic equilibrium is more likely to be achieved. PE cells are well adapted for moderate
temperature range (700-1200˚C) experiments at HP where setups based on DAC and conventional laser heating do not provide a constant and homogeneous heating of the sample. The most significant application using a large volume cell is the study of HP-HT in-situ reactions between different products. For instance, HP in-situ hydrogenation has been carried out using an internal hydrogen source (anthracen for example) that decomposes upon heating in a Conac setup [3]. Such experiments require that the gasket contains the sample plus the hydrogen source and diffusion barriers (BN). Such assembly is only achievable with a large volume cell.
The use of a large volume press coupled with a laboratory x-ray source is rare. Such development has been made for example by the group of Di Cicco et al. in Italy [2]. Their setup is made up of a 4 columns Paris-Edinburgh cell coupled to a rotating Mo anode generator and operates in an energy dispersive x-ray diffraction mode. In this article, we describe a new setup developed at Institut N´eel, CNRS, Grenoble, in France.
2. Experimental
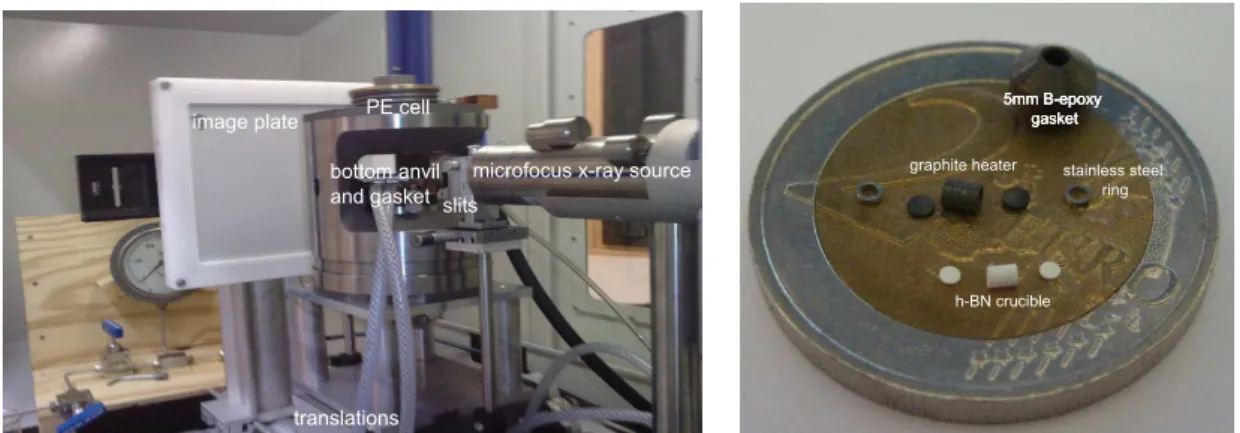
Our new setup operates a Paris-Edinburgh cell (PE-cell), of the VX type with two columns [4]. It works in the angular dispersive diffraction mode. This new equipment is inspired by the setup developed earlier at the id30 beamline of the ESRF and now improved at the id27 beamline (see drawing fig. 1 in [5]). The figure 1 (a) shows a picture of our setup comprising three main components aligned together on a common track: the x-ray source, the PE-cell and the detector. Our VX PE-cell is mounted on two translation stages (a vertical and an horizontal one, both perpendicular to the x-ray beam) to allow the alignment of the sample in the x-ray beam. The detector, a photosensitive Fuji image plate, can be easily removed from its holder for reading on an off-line reader. After being erased, the image plate can be reproductively repositioned for a new acquisition. We have chosen an x-ray source which produces a quasi-monochromatic micro-beam source from Incoatec operating at the 22.2 keV silver radiation (λ(Ag)Kα1,2 ≈ 0.56 ˚A). With Ag
radi-ation, the x-ray beam transmission through the HP assembly and sample is higher than with Mo radiation (17.5 keV), 2 times better for a silicon (Z=14) sample for instance and higher than 4 orders of magnitude for samples with high atomic number (germanium for example, Z=32). The huge absorption at the copper Kα radiation (8.05 keV), i.e. far above 4 orders of magnitude compared to the one for Ag radiation, makes defini-tively impossible to run such an experiment with this low energy source. The Incoatec 30 W air cooled Ag radiation source is equipped with Montel focusing optics. The image plate is placed at the focal distance of 600 mm. The x-ray beam, collimated by vertical and horizontal slits positioned few centimeters next to the optics, shows a divergence of 2.7 mrad and a size of 90 µm at the focus point (on the image plate). Then, the beam size is typically around 200 − 250 µm at the sample position. The sample itself is placed in compression, in its gasket, between the anvils of the PE-cell which can be placed at a variable position between the x-ray source and the image plate.
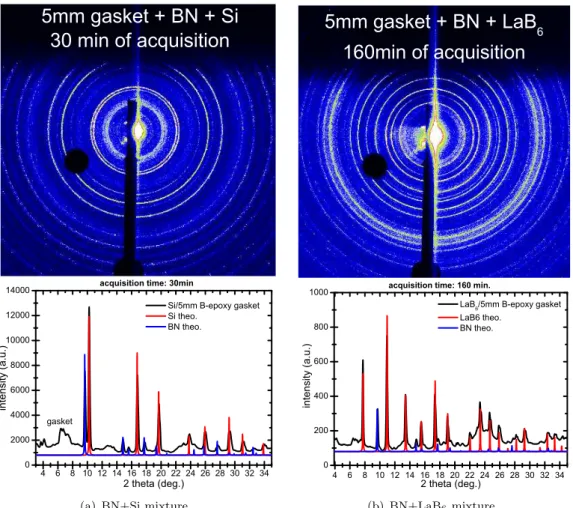
As preliminary check of the setup, we have acquired images on different samples (di-ameter: 1.5 mm) loaded in the standard 5 mm (in diameter) B-epoxy gasket. For diluted or low to moderate absorbing materials we obtained good quality diffraction images after only 0.5-2 h of counting time. Figure 2(a) and (b) show respectively the image obtained from mixtures of BN + Si and BN + LaB6 powders and the corresponding intensity
versus 2-theta pattern. For samples with large absorption, no usable diffraction signal is obtained through the gasket: this was the case for a mixture Bi2O3:Mn2O3 1:1 (%
mol) for example (XRD image not shown). Note the width of the Bragg peaks, typically around 0.1-0.2deg.(2-theta FWHM). The x-ray beam is not fully monochromatized, then at ambient pressure it is possible to distinguish the XRD signal coming from both Kα1,2
translations
microfocus x-ray source
slits bottom anvil
and gasket PE cell
image plate
(a) Overview of the angular dispersive x-ray diffraction setup. From left to right: the image plate for acquisition of diffraction patterns, the VX Paris-Edinburgh cell mounted on motorized translation stages, and the microfocus x-ray beam source.
stainless steel ring h-BN crucible 5mm B-epoxy gasket 5mm B-epoxy gasket 5mm B-epoxy gasket graphite heater
(b) The main components of the standard high pressure cell based on a 5 mm B-epoxy gasket.
Figure 1. Pictures of the setup that consists on a Paris-Edinburgh cell and a laboratory x-ray source for in-situ x-ray diffraction at high pressure and high temperature.
radations at large angle.
We have used two types of anvils: tungsten carbide anvils (2 different pairs compatible with 2 different diameters of B-epoxy gaskets: the 5 mm and the 7 mm ones) and sintered diamond (SD) anvils designed for 5 mm gaskets. The high pressure assembly used in all experiments was the standard one [6]. Figure 1(b) shows the main components of the HP assembly. Each sample (diameter: 0.8 mm and 1.2 mm, then typically 1 mm3 and
3-4 mm3 for respectively 5 mm and 7 mm gasket), composed of a mixture of powders, was placed in a crucible made of hexagonal BN. After pressurization it was heated at HP by Joule effect induced by the injection of a current in the cylindrical graphite heater. The alignment of the sample in the x-ray beam was performed by measuring the transmission profile of the beam in the vertical plane and in the horizontal plane, in the direction perpendicular to the beam. The acquired images were azimuthally integrated with respect to the beam center using the Fit2D software. Lattice parameters of each phase were determined by adjusting the theoretical XRD pattern of each compound, calculated with PowderCell software (or Fullprof software), with the observed pattern. The precision of these values was better than 0.1%.
3. Results
The experimental setup was first calibrated to adjust for the applied temperature and pressure on samples before conducting XRD measurements. On one hand, we established the relationship between the oil pressure applied to the anvils and the pressure obtained on the sample. On the other hand, we also investigated the dependence between the power injected in the graphite heater and the temperature obtained at the sample position for several applied pressures. For this purpose we used the diffracted signal of h-BN, MgO, NaCl and gold calibrants (i.e. their lattice volume obtained from the lattice parameters calculated from the position of Bragg peaks) and their associated equations of state (EOS). The typical lattice parameters uncertainty of our calibrants was in the order of 0.001-0.005 ˚A depending on the P,T conditions (± 0.002 ˚A for MgO at 7-8GPa for example).
4 6 8 10121416182022242628303234 0 2000 4000 6000 8000 10000 12000 14000 i n t e n si t y ( a . u . ) 2 theta (deg.)
Si/5mm B-epoxy gasket
Si theo.
BN theo. acquisition time: 30min
gasket
5mm gasket + BN + Si
30 min of acquisition
(a) BN+Si mixture.
4 6 8 10121416182022242628303234 0 200 400 600 800 1000
acquisition time: 160 min.
i n t e n si t y ( a . u . ) 2 theta (deg.) LaB 6 /5mm B-epoxy gasket LaB6 theo. BN theo. 5mm gasket + BN + LaB 6 160min of acquisition (b) BN+LaB6 mixture.
Figure 2. Transmission XRD images and corresponding integrated patterns for two 5 mm B-epoxy gasket filled with two different mixtures.
3.1 Pressure calibration
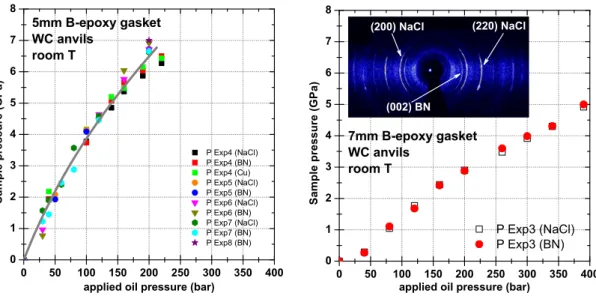
Figure 3(a) and (b) shows the pressure calibration curves obtained for WC anvils and related to 5 mm and 7 mm gaskets. SD anvils calibration curve up to 12 GPa is not shown but is in accordance with the one previously obtained in a standard 5 mm gasket (see fig.1 in [7]). Our WC anvils calibration are also in agreement with previous ones obtained in similar HP assemblies [7]. Both graphs have been drawn with the same vertical and horizontal scales to better show the higher conversion of applied oil pressure in the case of smaller 5 mm gasket. A pressure around 6.5 GPa is reached for an applied nominal oil pressure of 200 bar in the 5 mm gasket while only 3 GPa is obtained for the larger 7 mm gasket. We have observed that old B-epoxy gasket stored in air are less efficient to properly transmit the pressure to the sample than new ones. To have always the same efficiency, gaskets have to be stored under inert gas or vacuum.
3.2 Temperature calibration
Figure 4 shows one example of a temperature calibration curve obtained with 5 mm gaskets compressed in WC anvils at two different nominal pressures: 5 GPa and 6.5 GPa (at room temperature (RT)). The four calibrants used in a set of three experiments are indicated: BN, NaCl, Cu and MgO. The P and T cross-calibration was obtained from the EOS of a couple of calibrants (NaCl and Cu in experiment number 4 (labeled exp4 in fig. 4) and MgO and BN in exp9 respectively). For this purpose, we have considering
0 50 100 150 200 250 300 350 400 0 1 2 3 4 5 6 7 8 P Exp4 (NaCl) P Exp4 (BN) P Exp4 (Cu) P Exp5 (NaCl) P Exp5 (BN) P Exp6 (NaCl) P Exp6 (BN) P Exp7 (NaCl) P Exp7 (BN) P Exp8 (BN) S a m p l e p r e s s u r e ( G P a )
applied oil pressure (bar) 5mm B-epoxy gasket
WC anvils
room T
(a) Pressure calibration curve for 5 mm gasket (from 5 experiments); the different calibrants (h-BN, NaCl and Cu) are indicated.
0 50 100 150 200 250 300 350 400 0 1 2 3 4 5 6 7 8 (220) NaCl P Exp3 (NaCl) P Exp3 (BN) S a m p l e p r e s s u r e ( G P a )
applied oil pressure (bar) 7mm B-epoxy gasket
WC anvils
room T (002) BN (200) NaCl
(b) Pressure calibration curve for 7 mm gasket; the two calibrants (NaCl and BN) are indicated. Inset: typical XRD image acquired at 1.5GPa.
Figure 3. Calibration curves of the sample pressure versus the oil pressure applied to the piston for both sizes of WC anvils (respectively adapted for 5 mm and 7 mm B-epoxy gaskets).
0 20 40 60 80 100 120 140 160 180 200 300 400 500 600 700 800 900 1000 1100 1200 1300 1400 1500 1600 6 .5 G P a ( + / -0 .2 G P a ) T Exp4 (NaCl) T Exp4 (Cu) T Exp5 (NaCl) T Exp9 (MgO) T Exp9 (BN) T e m p e r a t u r e ( K ) Pow er (W) 5mm B-epoxy gasket WC anvils 5 G P a + / -0 .2 G P a
Figure 4. Temperature calibration curves for a 5 mm B-epoxy gasket compressed at 5 GPa and 6.5 GPa using WC anvils.
that the pressure and the initial (ambient) slight difference between calculated pressures for both calibrants do not change significantly in this range of heating. We observe that the higher the applied pressure is, the lower the heating efficiency. For instance, a power of 125 W applied to the carbon resistive element allows to reach a temperature around 600˚C and 1100˚C at 6.5 GPa and 5 GPa, respectively. We believe that this large difference is more related to a large difference in thermal conductivity of the calibrants constituting the sample rather than the pressure-induced change of the geometry and resistivity of the graphite heater, or a consequence of the approximation made in the calibration procedure (pressure is considered as constant).
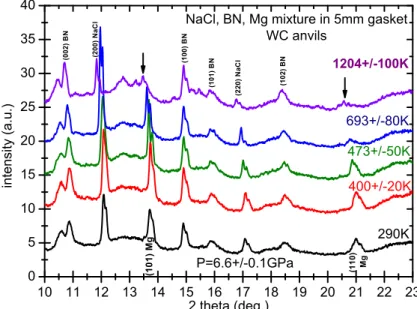
10 11 12 13 14 15 16 17 18 19 20 21 22 23 0 5 10 15 20 25 30 35 40 P=6.6+/-0.1GPa 1204+/-100K 693+/-80K 473+/-50K 400+/-20K ( 1 0 1 ) B N ( 1 1 0 ) M g ( 1 0 2 ) B N ( 2 2 0 ) N a C l ( 1 0 0 ) B N ( 1 0 1 ) M g ( 2 0 0 ) N a C l ( 0 0 2 ) B N i n t e n si t y ( a . u . ) 2 theta (deg.)
NaCl, BN, Mg mixture in 5mm gasket
WC anvils
290K
Figure 5. XRD patterns of Mg mixed with BN and NaCl, compressed at 6.6GPa, and heated successively at different temperatures.
3.3 First application: detection of the melting points of pure elements In this section we show two examples of melting point determination under high pressure: magnesium (at 6.6 GPa) and germanium (at 5 GPa). For both cases, a mixture of fine Mg or Ge with NaCl and BN powders in a weight ratio 1:1:1 was introduced in the BN crucible, then pressurized and heated at different temperatures using progressive power steps. XRD patterns were successively acquired during 1 h to 2 h at each power plateau. Figure 5 shows the integrated patterns of the experiment performed on Mg upon heating after pressurization at 6.6 GPa. As expected, we clearly see the shift of the Bragg peaks towards lower angles due to the increase of lattice parameters associated with thermal expansion. The step heating experiment was stopped when a drastic decrease of the intensity of the Mg Bragg peaks occurred which is the signature of melting (arrows in fig. 5). The estimated temperature was 1200K ± 100K, in quite good agreement with the melting point reported around 1300K at 6.6 GPa in the literature (see fig.3 in [8]).
Germanium has a melting point which decreases under pressure with an initial value of 1210 K at ambient pressure and a rate of 35 ± 3K/GPa (determined experimentally, see related references in ref. [9]). In our experiment performed at 5 GPa (not shown here), the Ge Bragg peaks disappeared at around 1100 ± 100K which is in agreement with literature, in particular with our previous experiment of differential thermal analysis performed under pressure in a Conac large volume cell (see fig.5 in ref. [9]).
3.4 Second application: P,T phase diagram of MgH2
Magnesium hydride and related phases are interesting materials for potential hydrogen storage applications. Nevertheless the P,T diagram of MgH2 is not established and even
at room temperature pressure induced phase transformation are subject of controversy. We have started the MgH2 P,T phase diagram study using our new setup. XRD
exper-iments performed during the compression at RT have allowed us to determine that the ambient tetragonal (rutile type) form of MgH2transforms into the orthorhombic form at
2.15 ± 0.25 GPa. An incomplete conversion was observed up to 10 GPa. The third MgH2
listed polymorph, the cubic one [10, 11], predicted to appear at 3.9 GPa [12], 7 GPa [13] and 9.7 GPa [14] from calculations is not found.
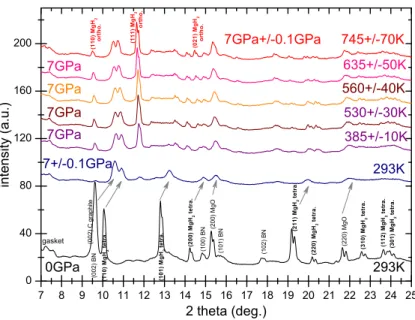
7 8 9 10 11 12 13 14 15 16 17 18 19 20 21 22 23 24 25 0 40 80 120 160 200 293K o r t h o . ( 0 2 1 ) M g H 2 745+/-70K 635+/-50K 385+/-10K 560+/-40K 530+/-30K 293K 7GPa+/-0.1GPa 7GPa 7GPa 7GPa 7GPa 7+/-0.1GPa ( 3 0 1 ) M g H 2 t e t r a . ( 0 0 2 ) C g r a p h it e i n t e n si t y ( a . u . ) 2 theta (deg.) ( 2 2 0 ) M g O ( 2 0 0 ) M g O ( 1 0 2 ) B N ( 1 0 1 ) B N ( 1 0 0 ) B N ( 1 1 2 ) M g H 2 t e t r a . ( 3 1 0 ) M g H 2 t e t r a . ( 2 2 0 ) M g H 2 t e t r a . ( 2 1 1 ) M g H 2 t e t r a . ( 2 0 0 ) M g H 2 t e t r a . ( 1 0 1 ) M g H 2 t e t r a . ( 1 1 0 ) M g H 2 t e t r a . gasket ( 0 0 2 ) B N 0GPa ( 1 1 0 ) M g H 2 o r t h o . o r t h o . ( 1 1 1 ) M g H 2
Figure 6. XRD patterns of MgH2mixed with BN and NaCl and compressed at 7GPa versus temperature.
A second set of in-situ XRD experiments was performed upon heating at different nominal pressures to establish the P,T phase diagram up to 8 GPa and 1400 K. Fig. 6 illustrates one of these experiments performed at 7 GPa. In this case BN and MgO were used to determine P and T. The shift of the Bragg peaks and their broadening during the compression at 7 GPa is visible by comparison of the two first XRD patterns. At 7 GPa, as previously observed, the tetragonal towards orthorhombic transformation is not fully completed at RT. However, we observe that a temperature increase of 100˚C is sufficient to fully transform the remaining rutile phase into the orthorhombic phase (see the indicated main 110, 111 reflections). By further heating above 745K a new phase transition is observed towards a another phase which is still under characterization. A detailed study of the P-T phase diagram will be published elsewhere.
3.5 Third application: HP-HT synthesis of MgB2 and C-diamond
As another example, we have followed the in-situ synthesis of MgB2and carbon diamond,
i.e. the chemical reactions between the different starting precursors.
For magnesium diboride we have compressed at 5PGa and heated up to 800˚C a mixture of 1:2 Mg:B powders placed in a BN crucible. A slight amount of NaCl powder was added to the mixture as a P,T calibrant. The corresponding XRD patterns are shown in fig. 7(a). We observe that Mg starts to react with B from 350˚C (see the (101) main Bragg peak of MgB2 in fig. 7(a)), far below its melting point at 5 GPa (above
950˚C [8]). The reaction between Mg and B starts in a solid state under pressure, as already observed in an energy dispersive diffraction study using synchrotron radiation [15, 16]. This experiment shows that this new XRD setup is well adapted to follow in-situ the synthesis of low Z materials, for instance borides.
The diamond synthesis has already been studied in the past, for example by energy dispersive XRD starting from a HP-HT treatment of a Fe60Ni40C20 alloy mixed with
graphite [17]. In our case, we have conducted experiments at two different pressures, starting from carbon graphite and using nickel as a catalyst. P and T were determined from the EOS of NaCl and BN calibrants. The melting of nickel (1455˚C at ambient pressure) was reached during the heating in the 5-7 GPa range, marked by the loss of the diffraction peaks of Ni, but no diffraction peaks from C-diamond were detected at
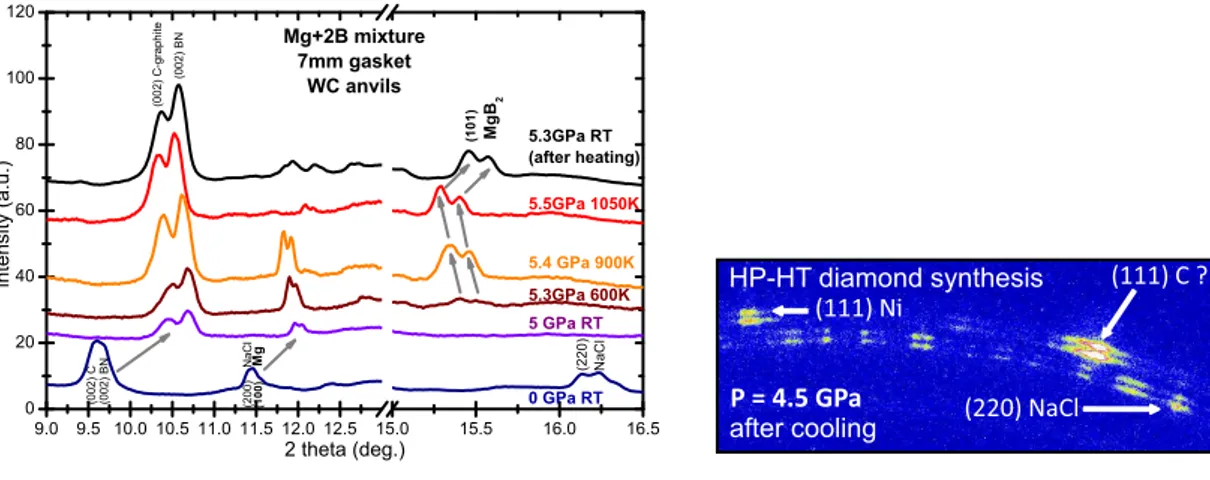
9.0 9.5 10.010.511.011.512.012.5 15.0 15.5 16.0 16.5 0 20 40 60 80 100 120 ( 0 0 2 ) C ( 1 0 1 ) ( 0 0 2 ) B N 5.3GPa RT (after heating) 5.5GPa 1050K 5.4 GPa 900K 5.3GPa 600K 5 GPa RT 0 GPa RT ( 2 0 0 ) N a C l ( 2 2 0 ) N a C l ( 1 0 0 ) M g i n t e n si t y ( a . u . ) 2 theta (deg.) ( 0 0 2 ) B N ( 0 0 2 ) C -g r a p h ite M g B 2 Mg+2B mixture 7mm gasket WC anvils
(a) XRD patterns of Mg + 2B powders mixed with NaCl and compressed at 5 GPa acquired upon heating up to 1050 K.
(111) C ? (220) NaCl P = 4.5 GPa after cooling HP-HT diamond synthesis (111) Ni
(b) Partial XRD image of Ni+C-graphite powders mixed with NaCl acquired after the heat treat-ment performed under a 5-7GPa pressure range.
Figure 7. In-situ XRD HP-HT study of MgB2and C-diamond syntheses.
high temperature, due to the overlapping of those potential peaks with the ones of the sample environment (BN, graphite furnace, NaCl). After quenching, we observe Bragg spots which could be assigned to diamond in the XRD image acquired at a slightly smaller pressure of 4.5 GPa (see fig. 7(b)). However due to the partial overlapping with Bragg peaks/diffraction rings of recrystallized NaCl and Ni ((220) NaCl and (111) Ni reflections with the (111) C-diamond one for example) further characterizations of the recovered sample (Raman spectroscopy for example) are necessary.
4. Conclusion
The phase transformations under extreme conditions of pressure and temperature are an original way for obtaining new compounds with unique physical properties like ultra-hardness. Synchrotron x-ray diffraction is now become a precious tool to explore the pressure phase diagram of a pure element or a compound, in particular its melting curve under pressure, or to determine the optimal P,T conditions for the synthesis of new metastable (HP) phases. To cope with the limited beam time access in large facilities we have developed a similar in-situ XRD experimental setup based on a laboratory microbeam monochromatic x-ray source working in an angular dispersive mode.
In this article we describe in details this new scientific instrument which is now fully operating up to 12 GPa and 1500 K. It is also a complementary tool to differential thermal analysis under HP-HT setup recently developed in our laboratory. The feasibility of in situ HP-HT XRD experiments by use of this laboratory setup is demonstrated through three types of applications. This field of materials science remains still largely unexplored because the HP-HT study of a combination of elements or compounds are infinite. In the future, such kind of new laboratory setup will help the prospective search and discovery of new materials with interesting properties recovered after HP-HT treatment.
Acknowledgements
The authors thank the master students V. Valenti (2011), Le T.N. Huynh (2012) and A. Vauthelin (2013) who participated actively to the related experiments during their internship. This work was supported by Agence Nationale de la Recherche (ANR), project
”CrystalPress” No. ANR-07-JCJC-0030 (CSD4). Part of this work was supported by the Pole SMINGUE of Universit´e Joseph Fourier Grenoble.
References
[1] Popescu C, Pinsard-Gaudart L and Gragoe N. High Press. Res. 31 (2011), pp. 611-619. [2] Di Cicco A, Gunnella R, Marassi R, Minicucci M, Natali R, Pratesi G, Principi E and Stizza
S, Journal of Non-Crystalline Solids 352 (2006), pp. 41554165.
[3] Azambuja V, Miraglia S, Fruchart D et al., J. of All. and Comp. 404-406 (2005), pp. 77-81. [4] Klotz S, Hamel G, Frelat G, High Press. Res. 24 (2004), pp. 219-224.
[5] Toulemonde P, Le Floch S, Bordet P, Capponi JJ, Mezouar M and Odier P, Supercond. Sci. Technol. 13 (2000), pp. 1129-1134.
[6] M. Mezouar, T. Le Bihan, H. Libotte et al., J. Synch. Rad. 6 (1999), pp. 1115-1119. [7] Morard G, Mezouar M, Rey N, Poloni R, Merlen A, Le Floch S, Toulemonde P, Pascarelli S,
San-Miguel A, Sanloup C and Fiquet G, High Press. Res. 27 (2007), pp. 223-233
[8] Errandonea D, Meng Y, H¨ausermann D and Uchida T, Journal of Physics: Condensed Matter 15 (2003), pp. 1277-1283.
[9] Goujon C, Legendre M, Plaindoux P, Prat A and Bruy`ere R, High Press. Res. 31 (2011), pp. 375-387.
[10] Bastide JP, Bonnetot B, Letoffe JM, Claudy P, Materials Research Bulletin. 15 (1980), pp. 1215-24.
[11] Bastide JP, Bonnetot B, Letoffe JM, Claudy P, Materials Research Bulletin. 15 (1980), pp. 1779-87.
[12] Vajeeston P, Ravindran P, Kjekshus A, Fjellvag H, Physical Review Letters 89 (2002) 175506. [13] Moser D, Baldissin G, Bull DJ, Riley DJ, Morrison I, Ross DK, et al, Journal of Physics:
Condensed Matter 23 (2011) 305403.
[14] Cui S, Feng W, Hu H, Feng Z, Wang Y, Solid State Communications 148 (2008), pp. 403-405. [15] Baranov A N, Solozhenko V L, Lathe C, Turkevich V Z and Park Y W, Supercond. Sci.
Technol. 16 (2003), pp. 1147-1151.
[16] Toulemonde et al., ESRF experimental report HS1889 (2003), unpublished. [17] Solozhenko V L et al., J. Phys. Chem. B 106 (2002), pp. 6634-6637.