HAL Id: insu-00460515
https://hal-insu.archives-ouvertes.fr/insu-00460515
Submitted on 1 Mar 2010HAL is a multi-disciplinary open access archive for the deposit and dissemination of sci-entific research documents, whether they are pub-lished or not. The documents may come from teaching and research institutions in France or abroad, or from public or private research centers.
L’archive ouverte pluridisciplinaire HAL, est destinée au dépôt et à la diffusion de documents scientifiques de niveau recherche, publiés ou non, émanant des établissements d’enseignement et de recherche français ou étrangers, des laboratoires publics ou privés.
Methodological re-evaluation of the electrical
conductivity of silicate melts
Anne Pommier, Fabrice Gaillard, Mohammed Malki, Michel Pichavant
To cite this version:
Anne Pommier, Fabrice Gaillard, Mohammed Malki, Michel Pichavant. Methodological re-evaluation of the electrical conductivity of silicate melts. The American Mineralogist, 2010, 95, pp.284-291. �10.2138/am.2010.3314�. �insu-00460515�
Revised ms
1
2
3
4
METHODOLOGICAL RE-EVALUATION OF THE ELECTRICAL
5CONDUCTIVITY OF SILICATE MELTS
67
8
9
A. Pommier
1*, F. Gaillard
1,M. Malki
2,3and M. Pichavant
1 1011 12
1
CNRS/INSU, Université d’Orléans, Université François Rabelais-Tours,
13
Institut des Sciences de la Terre d’Orléans (ISTO), UMR 6113, Campus
14
Géosciences, 1A rue de la Férollerie, 45071 Orléans cedex 2, France
15 2
CNRS, Conditions Extrêmes et Matériaux : Haute Température et Irradiation
16
(CEMHTI), UPR 3079, 1D avenue de la Recherche Scientifique,
17
45071 Orléans cedex 2, France
18
3
Polytech’Orléans-Université d’Orléans. 8, Rue Léonard de Vinci,
19
45072 Orléans cedex 2, France
20 21
*Corresponding author:
22anne.pommier@cnrs-orleans.fr
23Tel. +33 2 38 25 53 94
24Fax +33 2 38 63 64 88
25Abstract 26
Electrical impedance measurements in laboratory on silicate melts are used to interpret 27
magnetotelluric anomalies. On the basis of two- and four-electrode measurements, we show 28
that the influence of the electrodes of the 2-electrode system on the measured resistivity can 29
be of significant importance for low-resistivity melts and increases with temperature. At 30
1400°C, the resistivity of very conductive melts measured with two electrodes can reach six 31
times the resistivity value measured with four electrodes. A short-circuit experiment is needed 32
to correct the 2-electrode data. Electrodes contribution is also estimated for samples from 33
other studies, for which the resistance of the electrical cell can be as high as the resistance of 34
the sample. A correction of the resistivity data from the literature is proposed and values of 35
the corresponding Arrhenian parameters are recommended. 36
37
Keywords: impedance measurements, resistivity, melts. 38 39 40 41 42 43 44 45 46 47 48 49 50 51
INTRODUCTION 52
The knowledge of the electrical properties of melts is needed for the interpretation of 53
magnetotelluric profiles (Wannamaker et al. 2008; Yoshino et al. 2006; Tarits et al. 2004; 54
Müller and Haak 2004; Roberts and Tyburczy 1999). For example, both magnetotelluric data 55
and electrical measurements in laboratory allowed the identification of partial melt in the 56
asthenosphere below the East Pacific Rise (Yoshino et al. 2006). The information provided by 57
electrical measurements in laboratory is of significant interest to the interpretation of 58
geophysical anomalies, in terms of quantitative constraints placed on potential conductive 59
magma reservoirs (Pommier et al. 2008; Gaillard et al. 2008) and for the elaboration of 60
conductivity models (Xu et al. 2000). Since electrical conductivity (or resistivity) is extremely 61
sensitive to small chemical and physical changes, it represents a subtle probe for studying 62
silicate melts properties under controlled and variable conditions (T, P, composition and fO2) 63
(Pommier et al. 2008; Gaillard and Iacono Marziano 2005; Gaillard 2004; Tyburczy and Waff 64
1985, 1983). Several studies have contributed to improve the technique of electrical 65
impedance measurements over the past decades (e.g. Lupotto et al. 1987; Hodge et al. 1976; 66
Bauerle 1969). 67
Experimental difficulties raised by electrical measurements include the maintenance of 68
a well-constrained electrical cell geometry and the necessity to limit the interactions between 69
the sample and the components of the electrical cell. In addition, the problem of the 70
contribution of the electrical response of the electrodes to the measured resistance can be of 71
non negligible importance (Tyburczy and Waff 1983) and needs to be quantified. Most 72
electrical measurements of natural silicate melts are 2-electrode based, whereas the 4-73
electrode system is mostly used by the material science community. The resistance of the 74
electrodes (Relectrodes) is included in the impedance measured by the 2-electrode system, which 75
can affect the electrical response of the sample (effective resistance), particularly for low 76
resistivity melts. It is therefore important to evaluate the contribution of the electrodes in the 77
experimental conductivity database for silicate melts. Because this problem concern most of 78
the current database of electrical resistivities of natural melts, it also raises a direct implication 79
in the interpretation of magnetotelluric profiles in molten or partially molten regions of the 80
Earth’s crust and mantle. 81
The main goal of this study is to address the influence of the electrode configuration 82
on the measurement of the resistivity of melts in laboratory. We measured the electrical 83
response of three silicate melts (a basalt, a phonolite and a borosilicate) using two different 84
techniques, based on 2- and 4-electrode measurements. Experiments were conducted at 1 bar 85
and in the T range [800-1430°C]. The influence of the electrical response of the electrodes on 86
the 2-electrode data was identified, demonstrating the need for a significant correction of the 87
impedance measurements. Errors on resistivity values of silicate melts due to electrodes 88
contribution were estimated for the investigated samples as well as for samples from other 89
studies. We recommend values of corrected Arrhenian parameters for the calculation of 90
electrical resistivity of natural silicate melts. 91 92 EXPERIMENTS 93 Starting products 94
The three starting materials were a borosilicate synthetized at the CEMHTI (CNRS-95
Orléans, France), a phonolite from Mt. Vesuvius (Pommier et al., 2008), and an alkali basalt 96
from the Pu’u’ ‘O’o volcano (Kilauea). The composition of the Kilauea basalt is close to the 97
typical composition of MORB-type basalts. The samples were chosen for their differences in 98
chemical composition and their geological interest. The starting materials were finely 99
crushed, melted in air at 1400°C during ~1h and quenched into a glass. The composition of 100
the starting glasses is presented in Table 1. For the 2-electrode measurements, the starting 101
materials were melted in air in a Pt crucible and the resulting bubble-free glass was drilled to 102
cylinders (Pommier et al. 2008). For the 4-electrode measurements, the starting materials 103
were melted in an alumina crucible which was directly used in the electrical conductivity 104
measurements (Simonnet et al.2003). 105
106
Basic concepts of complex impedance measurements 107
Complex impedance measurements allow to study conduction processes by 108
discriminating most of polarization effects observed during a scan in frequency (Bruin and 109
Franklin, 1981). While the electrical resistance of geologic materials has been measured for 110
almost one century (e.g. Volarovich and Tolstoi, 1936), impedance measurements applied to 111
solid electrolytes are more recent (Bauerle, 1969; Tyburczy et Fisler, 1995 and references 112
therein). The interpretation of impedance spectra in terms of transport mechanisms has been 113
widely investigated (Roberts et Tyburczy, 1994; Huebner et Dillenburg, 1995; Roling, 1999). 114
Impedance spectroscopy consists in recording the electrical impedance of a material at 115
variable frequency. An ac current is delivered between two “current electrodes” and an 116
induced ac voltage drop is measured between two “voltage electrodes”. The complex 117
impedance Z* is deduced, Z*=U*/I*, U* being the voltage drop vector and I* being the 118
current vector (Simonnet et al. 2003). In the 2-electrode system, current and voltage 119
electrodes are conveyed through only two electrodes. 120
The complex impedance Z* is the sum of a real and an imaginary parts: Z*=R+jX, R 121
being the electrical resistance and X the reactance. Thus, the determination of the electrical 122
resistance of a material consists in extracting the real part of the complex impedance Z*material 123
(Bagdassarov et al. 2004; Gaillard 2004; Pommier et al. 2008). The electrical resistivity ρ 124
(ohm.m) is deduced from the value of R (ohm) by using the following relation: 125 R G. = ρ (1) 126
where G is the geometric factor (m) and depends on the dimensions of the material studied 127
and on the distance between electrodes. 128
Experimental setups 130
The two experimental setups are presented in Figure 1a. 2-electrode experiments were 131
performed at the ISTO and 4-electrode experiments at the CEMHTI (Orléans, France). All 132
experiments were conducted in air. In both cases, the glass sample was placed in the hot spot 133
of the furnace. Temperature, monitored with a Eurotherm controller, was measured by a type 134
S thermocouple, placed adjacent to the conductivity cell, and is known to within ±2°C. 135
Impedance was measured in response to an AC signal in the 1Hz-1MHz frequency range 136
using an impedance gain/phase analyzer (Solartron 1260, Schlumberger Co.), the voltage 137
amplitude being 0.1 to 0.5V. 138
In the 2-electrode configuration, the two groups of welded electrodes are connected to 139
a Pt tube (external electrode) and a Pt wire (internal electrode), respectively. The cylindrical 140
geometry of the sample (L from 3.5 to 9mm; OD from 4.5 to 7.5mm and ID=1mm) implies 141
the electrical resistivity to be coaxially measured. An alumina plug prevents the two 142
electrodes from being in contact with each other (Pommier et al. 2008). In the 4-electrode 143
configuration, two Pt sheets serve as current electrodes and two Pt wires measure the voltage 144
drop. The four electrodes are connected separately to the impedance spectrometer and the 145
resistivity is measured between the wires. These Pt foils are totally immersed in the liquid 146
sample contained in the alumina crucible (L>10mm; OD=30mm). As shown in Figure 2, 147
measurements performed at different immersion depths of the electrodes underline that the 148
wetting effect on the measured electrical resistance is negligible for an immersion >5mm 149
(similarly to Gaillard et al. 2008 for very conductive carbonate liquids with high wetting 150
properties). All 4-electrode measurements were performed at an immersion depth of ~8mm. 151
The precision of the immersion depth of the electrodes in the melt is controlled by a 152
mechanical displacement system allowing the depth to be determined with a good precision 153
(0.02mm, Malki and Echegut 2003). 154
Equivalent electrical circuits are presented in Figure 1b for both configurations. The 155
different components of the electrodes (conductivity cell parts + connecting metallic wires) 156
are associated in series with the effective complex impedance of the sample (Z*sample). 157
Contrary to the 2-electrode system, the current in the 4-electrode setup is not delivered in the 158
loop of measurement of the potential. As a result, the electrical impedance of the cell is not 159
involved in the measured impedance (Z*measured) and: 160
Z*measured = Z*sample + Z”induct (2)
161
where Z”induct (the imaginary part X of Z*electrodes) represents the inductive effects of the 162
electrodes and was found to be negligible for frequencies <0.1MHz (Simonnet 2004). 163
According to Figure 1b, the impedance measured using a 2-electrode system can be written: 164
Z*measured = Z*sample + Z*electrodes = [R+jX]sample + [RPt parts + Z”induct + (Rpol // Cpol)]electrodes (3)
165
where RPt parts is the resistance of the Pt tube and Pt wires (Figure 1a) and the association Rpol 166
// Cpol represents the polarization effects (ionic double-layer). The best method for estimating 167
the electrode contributions is to conduct a short-circuit experiment. Because Pt resistivity is 168
temperature-dependent, short-circuit measurements must be done at temperature. This 169
experiment consists in connecting the two electrodes with a small Pt wire (Figure 1a). 170
Electrical measurements are performed on an empty cell (i.e. without sample) and Z*short-circuit 171
= Z*electrode.
172 173
Data reduction and calibration 174
An example of the electrical response of the sample to a scan in frequency is presented 175
in the complex plane (Z’, Z”) Figure 1c. Graphically, the value of the electrical resistance R 176
corresponds to the intersection of the electrical response with the real axis (i.e. Z”=0). The 177
first part of the response (Z’<R and Z”>0) represents the induction effects whereas the second 178
part (Z>R and Z”<0) is attributed to the impedance of the interface between the sample and 179
the electrode (Huebner and Dillenburg 1995). 180
The determination of the resistivity value ρ requires the determination of the 181
geometric factor G (Eq. 1). For the 4-electrode configuration, G was determined through the 182
calibration of the cell. Calibration was performed using three aqueous KCl solution (0.01, 0.1 183
and 1M) of known resistivity at room temperature. Standard liquids are generally used for this 184
calibration (Wu and Koch, 1991). The geometric factor of the 4-electrode cell is calculated by 185
measuring the resistance R of the KCl solution and using Eq. 1. Similar values of G were 186
obtained using the different KCl solutions and the geometric factor was found to be 0.039m. 187
For the 2-electrode configuration, the diffusion formalism in a cylinder in which diffusion is 188
coaxial (Crank 1975) showed that G can be written as follows: 189 ) ln( 2 int d d L G ext π = (4) 190
where L is the length of the cylindrical glass sample, dext is the outer diameter and dint the 191
internal diameter. A constant value of the geometric factor during the experiment is assumed. 192
The uncertainty on ρ due to error propagation of typical uncertainties on R, L, dext and dint is 193
in the range of 7-12.5% for all melts. Eq. 4 yielded values of G ranging from 0.015 to 0.019m. 194
These values were confirmed by the calibration of the 2-electrode setup cell using KCl 195
solution (1M). 196
197
Chemical characterization of the samples 198
Most glass samples were analyzed after the experiment with a Camebax SX-50 199
electron microprobe in order to check for interactions between the sample and the cell parts 200
(Pt and alumina). Analyses were conducted at 15 kV, 6 nA, 10 s on peak and 5 s on 201
background. No significant variations in oxides contents were measured in the samples after 202
2-electrode experiments, in agreement with the observations of other studies using similar 203
electrical cells (Pommier et al. 2008; Gaillard 2004). Iron was found to be present at very low 204
concentrations (<0.5wt%) in the Pt electrodes from the 2-electrode setup. Iron depletion was 205
thus too small to change significantly the FeO content of the melt. Therefore, we considered 206
that iron loss was of minor importance in this study. Electron microprobe traverses were 207
performed in one sample from the 4-electrode experiments in order to estimate the 208
contamination of the melt by the alumina crucible. Al2O3 enrichment was found to affect the 209
melt on a distance <1mm from the Al2O3 crucible/melt interface. The melt volume occupied 210
by the immersed electrodes (see Figure 1a) is not spatially concerned by the contaminated 211
melt. A contamination of the whole volume of melt due to convection can be excluded, due to 212
the small value of the Rayleigh number (<200, Jaupart and Tait 1995). 213
214
RESULTS 215
The electrical resistivities of the three investigated melts measured using the 2 and 4 216
electrode configurations are presented Figure 3. For both configurations, measurements 217
during heating and cooling cycles yielded similar resistivity values, which demonstrates 218
reproducibility (in agreement with Pommier et al. 2008 and Malki and Echegut 2003). The 219
short-circuit experiment was performed with the 2-electrode system, from 800 to 1400°C. A 220
resistance from 1.5 to 2ohm was measured in this T-range, corresponding to the contributions 221
of the electrodes. The configuration adopted for the short-circuit experiment (Figure 1a) does 222
not take into account the resistance of the conductivity cell (Pt tube and inner Pt wire). The 223
resistance of these two Pt parts was calculated on the investigated T range using the known 224
resistivity of Pt and Eq. 1. At 1200°C, the resistance of the Pt tube and inner wire (external 225
and internal electrodes, respectively) represent less than 1% of the resistance of the 226
conductivity cell, the 99% corresponding to the Pt wires (cf Figure 1a). This result underlines 227
the very low contribution of the Pt tube and inner wire to the whole electrode resistance and 228
validates the configuration used for the short-circuit experiment. For all 2-electrode 229
experiments, the resistance of the electrodes was deduced from the measured resistance at 230
each T: 231
Rsample = Rmeasured – Relectrodes (5) 232
and ρsample = ρcorrected = G.Rsample (6) 233
These corrected resistivity values correspond to the “2-electrode corrected” data in Figure 3. 234
The good agreement between 2-electrodes corrected data and 4-electrode data is clearly 235
shown. 236
The principal result shown in Figure 3 is that the 2-electrode setup used in this study 237
implies a low correction on the measured resistivity values of low-conductive melts 238
(phonolite and basalt), while electrical measurements of high-conductive melts (borosilicate) 239
require either to perform a short-circuit experiment in order to quantify the electrodes 240
contributions or the use of a 4-electrode setup. The correction on 2-electrode data of 241
resistivity values of the basaltic liquid only represents between 2 and 10% of the 4-electrode 242
value and is thus negligible for our coaxial experimental setup. The correction of the 2-243
electrode data was found to increase with temperature. This can be easily understood since the 244
electrical resistivity of silicate melts decreases with increasing T whereas the resistivity of Pt 245
wires has the opposite behaviour. As shown in Figure 3, the influence of the electrodes affects 246
dramatically the resistivity of the less resistive melt (borosilicate). Indeed, at 1400°C, the 247
resistivity measured with the 2-electrode system (0.05ohm.m) is six times higher than the 248
resistivity value given by the 4-electrode system (0.008ohm.m). A slight but noticeable 249
difference was observed for the data of the phonolitic melt at the highest temperatures: at 250
1260°C, the resistivity value from the 2-electrode experiment is 0.1ohm.m greater than the 251
value measured in the 4-electrode experiment, corresponding to an error on the 4-electrode 252
value of 37% (=100.((ρ2-electrode-ρ4-electrode)/ρ4-electrode)= 100.(0.1/0.27)). 253
Measurements were performed at high temperatures on a large interval. The 254
temperature dependence of the electrical response of the investigated samples is shown in 255
Figure 3. All the data can be fitted by an Arrhenian formalism: 256
− = = T R Ea . exp . 1 0 σ ρ σ (7) 257
with σ the electrical conductivity (ohm.m)-1, ρ the electrical resistivity (ohm.m), σ0 the pre-258
exponential factor (ohm.m)-1, Ea the activation energy (J/mol), R the universal gas constant 259
(J.mol-1.K-1) and T the temperature (K). Values of the Arrhenian parameters calculated from 260
4-electrode measurements are similar to those from 2-electrode corrected measurements and 261
are presented in Table 2. 262
263
DISCUSSION 264
Experiments performed with our 2-electrode setup have underlined the importance of 265
the contributions of the electrodes to the measured resistivities of very low resistivity 266
materials. Comparison was made with other 2-electrode setups from other studies. Setups 267
characteristics are listed in Table 3 and results are presented in Figure 4. The 2-electrode 268
setup used in this study is similar to the setup used in Pommier et al. (2008) (experiments on 269
dry and hydrous tephritic to phonolitic samples), Gaillard and Iacono Marziano (2005) 270
(basalt) and Gaillard (2004) (dry and hydrous rhyolite). Only the sample dimensions slightly 271
changed, modifying the value of G (Eq. 4). The results of the short-circuit experiment 272
performed in this study can be applied to correct the results from the studies mentioned above. 273
Our setup was compared with the techniques presented in Rai and Manghnani (1977) 274
(basalts), Waff and Weill (1975) (trachyte and andesite) and Presnall et al. (1972) (synthetic 275
basalt). The electrical response of the electrodes was estimated using indications given in the 276
different studies. For studies using the loop technique (Rai and Manghnani 1977; Waff and 277
Weill 1975), the resistance of the electrodes corresponds to the sum of the resistances of two 278
metallic wires, calculated as follows: 279
S l
Rwire = ρwire. (8)
with ρwire the resistivity of the metal (ohm.m) (given in the literature), l the length of the wire 281
(m) and S the cross-section area of the wire (m²). Regarding the study from Presnall et al. 282
(1972), the resistance of the Pt wires was estimated using Eq. 8 and the resistance of the 283
conductivity cell was calculated using Eq. 1 for the adopted cell geometry (consisting in two 284
Pt crucibles fitted into each other). The sum of both resistances (wires and conductivity cell) 285
corresponds to the resistance of the electrodes. An error of ~20% is assumed on calculations 286
of Rcell, due to the lack of information regarding the length of metallic wires or the geometry 287
cell. 288
The contributions of the electrodes to the measured resistance were estimated using 289
the Rmeasured/Relectrodes ratio for this and previous 2-electrode studies, and are presented in 290
Figure 4. The coaxial setup used in our laboratory is efficient for measuring the electrical 291
properties of dry natural silicate melts (Rmeasured/Relectrodes >5) and the correction of the 292
electrodes contributions will not significantly modify the measured resistance. In Gaillard 293
(2004) and Pommier et al. (2008), the lowest values of the Rmeasured/Relectrodes ratio were 294
obtained for the hydrous rhyolite and hydrous phonolite, respectively, i.e. the most conductive 295
investigated samples. For these samples, Relectrodes represents 10 to 40% of Rsample, the 296
contribution of the electrodes to the measured resistance increasing with increasing T. The 297
low values of the ratio for the borosilicate from this study and carbonatites from Gaillard et al. 298
(2008) underline the need in conducting short-circuit experiments prior to 2-electrode 299
measurements on very conductive melts. In Gaillard et al. (2008), who performed 4-electrode 300
measurements, a comparison between 4-electrode and 2-electrode data on 301
(Na,K,Ca0.25)2(CO3)2 at 740°C has shown that electrodes are less conductive than the 302
carbonatite melt. Using a 2-electrode setup similar to the one of the present study implies that 303
the correction of the resistance of the electrodes is not needed for low conductivity values, 304
while it can be critical for high electrical conductivity values. 305
The critical parameter controlling the electrodes contribution is the dimensions of the 306
metallic wires. According to Eq. 8, the smaller the diameter and the longer the length of a 307
metallic wire, the higher the resistance of the wire and, thus, of the electrodes. This is 308
particularly critical for measurements using the loop technique, since the cell components are 309
two long metallic wires of small diameter (~0.2 to 0.6mm) (Rai and Manghnani 1977; Waff 310
and Weill 1975). The calculation of the sample geometric factor as well as technical 311
considerations regarding these two previous studies is detailed in Waff (1976). The adopted 312
configuration leads to an important contribution of the electrodes to the measured resistance: 313
Relectrodes ~5ohm at 1500°C for both studies, while Rmeasured is about 6 to 10ohm at the same
314
temperature. An important effect of the electrodes on the electrical measurements was also 315
calculated for the setup used in Presnall et al. (1972): at 1500°C, the contribution of the 316
electrodes to the measured resistivity represents 30%. 317
Whatever the 2-electrode setup used, the electrodes contribution decreases with 318
temperature. As a consequence, the correction of 2-electrode measurements is negligible for 319
low conductivity values, such as the conductivity of silicate glasses and solids (e.g. 320
Wanamaker and Duba, 1993; Behrens et al. 2002; Poe et al. 2008; Pommier et al. 2008). 321
Errors on resistivity values determined using a 2-electrode system can be importance 322
in the interpretation of magnetotelluric anomalies. Laboratory data are needed to interpret 323
high conductive zones detected in the Earth’s interior and, particularly, to put constraints on 324
the composition and storage conditions of the melt. Depending on the cell configuration and 325
the length of the connecting metallic wires, measured resistance can be twice as great as the 326
effective resistance of the melt, because of electrodes contributions (Figure 4). A similar 327
change in the electrical response of a silicate melt is observed when increasing the 328
temperature of several hundreds of °C or adding a few wt% of water (Pommier et al. 2008; 329
Gaillard 2004; Tyburczy and Waff 1983, 1985). The identification of the electrodes 330
contributions (Figure 4) in the electrical measurements from other studies allowed the 331
correction of resistivity values. Based on these corrected resistivities, we have determined 332
Arrhenian laws for each melt. The corresponding Arrhenian parameters, Lnσ0 and Ea, are 333
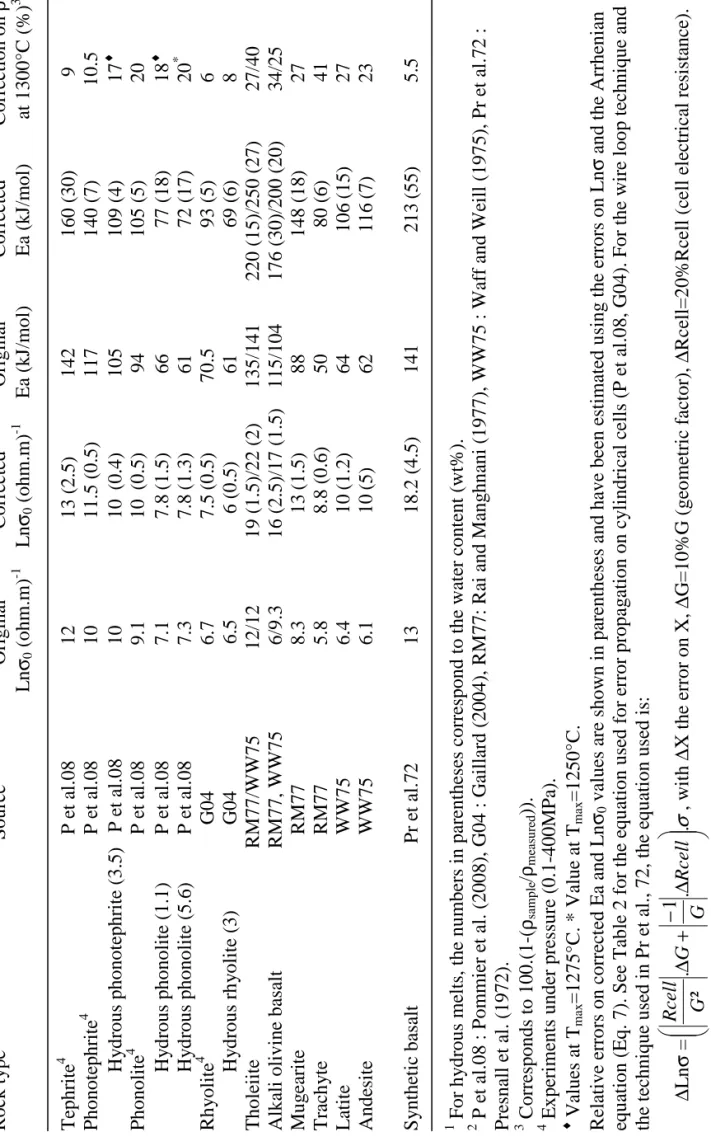
presented in Table 4 and compared to the original published values. These corrected values 334
allow the determination of the electrical resistivity of natural melts on a wide range of 335
chemical composition. The improvement of the interpretation of anomalies detected by 336
geophysical methods is also a matter of electrical measurements in laboratory, including the 337
technical concern of the contributions of the electrodes. 338
339
CONCLUSION 340
Electrical impedance measurements using 2-electrode and 4-electrode systems have 341
been used to discriminate the electrodes contributions of the 2-electrode setup to the measured 342
resistance. The electrodes contributions are dominated by the electrical response of the 343
connecting metallic wires and are successfully eliminated by performing a short-circuit 344
experiment. A correction of the electrodes contribution is possible only if the dimensions (in 345
particular, the length of the metallic wires) are well constrained. The 2-electrode setup used in 346
this study is particularly efficient for measuring the electrical resistivity of low-conductive 347
melts (like most natural silicate melts), whereas the electrode contribution can be important 348
for very conductive melts (like carbonatites). Significant electrode effects, particularly for 349
low-resistive melts and at HT were observed for other 2-electrode setups from previous 350
studies. Errors on the corresponding resistivity values of the melts can be non-negligible in 351
the interpretation of magnetotelluric anomalies. A correction of the database of the resistivity 352
of natural melts was performed and recommended values of Arrhenian parameters were 353 proposed. 354 355 356 357
ACKNOWLEDGEMENTS 358
This paper is part of the Ph.D. of A. Pommier. The authors are grateful to T. Orr for providing 359
the Kilauea sample. The authors are grateful to G. Henderson for the editing work and two 360
anonymous reviewers for thorough comments. This study has been supported by the French 361
national agency for research, ANR JC05-42707 (Electrovolc) attributed to F. Gaillard. 362
363
REFERENCES CITED 364
365
Bagdassarov, N.S., Maumus, J., and Poe, B.T. (2004) Pressure dependence of Tg in 366
silicate glasses from electrical impedance measurements. Physics and Chemistry of Glasses, 367
45 (3): 197-214. 368
Bauerle, J.E. (1969) Study of solid electrolyte polarization by a complex admittance 369
method. Journal of Physics and Chemistry of Solids, 30: 2657-2670. 370
Behrens, H., Kappes, R., and Heitjans, P. (2002) Proton conduction in glass – an 371
impedance and infrared spectroscopic study on hydrous BaSi2O5 glass. Journal of Non-372
Crystalline Solids, 306 (3): 271-281. 373
Bruin, H.J., and Franklin, A.D. (1981) An impedance spectroscopy model for electron 374
transfer reactions at an electrode/solid electrolyte interface. Journal of Electroanalytical 375
Chemistry, 118, 405-418. 376
Crank, J. (1975) The Mathematics of Diffusion. 2nd ed., 440 pp., Claredon, Oxford, 377
U.K. 378
Gaillard, F. (2004) Laboratory measurements of electrical conductivity of hydrous and 379
dry silicic melts under pressure. Earth and Planetary Science Letters, 218 (1–2): 215–228, 380
doi:10.1016/S0012-821X(03)00639-3. 381
Gaillard, F., and Iacono-Marziano, G. (2005) Electrical conductivity of magma in the 382
course of crystallization controlled by their residual liquid composition. Journal of 383
Geophysical Research, 110, B06204, doi:10.1029/ 2004JB003282. 384
Gaillard, F., Malki, M., Iacono-Marziano, G., Pichavant, M., and Scaillet, B. (2008) 385
Carbonatite melts and electrical conductivity in the astenosphere. Science, 322: 1363-1365. 386
Hodge, I. M., Ingram, M. D., and West, A. R. (1976) Impedance and modulus 387
spectroscopy of polycrystalline solid electrolytes. Journal of Electroanalytical Chemistry, 74: 388
125-143. 389
Huebner, J. S., and Dillenburg R. G. (1995) Impedance spectra of hot, dry silicate 390
minerals and rock: Qualitative interpretation of spectra. American Mineralogist, 80 (1– 2): 391
46–64. 392
Jaupart, C., and Tait, S. (1995) Dynamics of differentiation in magma reservoirs. J 393
Journal of Geophysical Research, 100, B9: 17615-17656. 394
Lupotto, P., Villa, M., and Ciodelli, G. (1987) Simple methods to improve the 395
performances of network analysers in electrochemical analyses. Journal of Physics E-396
Scientific Instruments, 20: 634-636. 397
Malki, M., and Echegut, P. (2003) Electrical conductivity of the CaO-SiO2 system in 398
the solid and the molten states. Journal of Non-Crystalline Solids, 323: 131-136. 399
Müller, A., and Haak, V. (2004) 3-D modelling of the deep electrical conductivity of 400
Merapi volcano (Central Java): integrating magnetotellurics, induction vectors and the effects 401
of steep topography. Journal of Volcanological and Geothermal Research, 138: 205-222. 402
Poe, B.T., Romano, C., Varchi, V., Misiti, V., and Scarlato, P. (2008) Electrical 403
conductivity of a phonotephrite from Mt. Vesuvius: The importance of chemical composition 404
on the electrical conductivity of silicate melts. Chemical Geology, 256 (3-4): 193-202. 405
Pommier, A., Gaillard, F., Pichavant, M., and Scaillet, B. (2008) Laboratory 406
measurements of electrical conductivities of hydrous and dry Mount Vesuvius melts under 407
pressure. Journal of Geophysical Research, 113, B05205, doi:10.1029/2007JB005269. 408
Presnall, D.C., Simmons, C.L., and Porath, H. (1972) Changes in electrical 409
conductivity of a synthetic basalt during melting. Journal of Geophysical Research, 77 (29): 410
5665-5672. 411
Rai, C.S., and Manghnani, M.H. (1977) Electrical conductivity of basalts to 1550°C. 412
In Magma genesis: Bulletin 96, Oregon Department of Geology and Mineral Industries, 413
edited by H.J.B. Dick, pp 219-232, Portland, OR. 414
Roberts, J. J., and Tyburczy, J. A. (1994) Frequency dependent electrical properties of 415
minerals and partial-melts. Surveys in Geophysics, 15(2), 239-262. 416
Roberts, J. J., and Tyburczy, J. A. (1999) Partial-melt electrical conductivity: 417
Influence of melt composition. Journal of Geophysical Research, 104(B4), 7055–7065, 418
doi:10.1029/1998JB900111. 419
Roling, B. (1999) What do electrical conductivity and electrical modulus spectra tell 420
us about the mechanisms of ion transport processes in melts, glasses, and crystals? Journal of 421
Non-Crystalline Solids, 244(1): 34-43. 422
Simonnet, C., Phalippou, J., Malki, M., and Grandjean, A. (2003) Electrical 423
conductivity measurements of oxides from molten state to glassy state. Reviews of Scientific 424
Instruments, 74 (5): 2805-2810. 425
Simonnet, C. (2004) Conductivité électrique des verres et fonts d’oxydes. Effet de 426
l’incorporation de particules RuO2. Thèse du CEA-Valrho, site de Marcoule, pp 176. 427
Tarits, P., Hautot, S., and Perrier, F. (2004) Water in the mantle : results from 428
electrical conductivity beneath the French Alps. Geophysical Research Letters, 31: L06612, 429
doi:10.1029/2003GL019277. 430
Tyburczy, J. A., and Fisler, D. K. (1995) Electrical properties of minerals and melts, 431
Mineral Physics and Crystallography, A Handbook of Physical Constants, pp.185-208, AGU, 432
Whashington, D.C. 433
Tyburczy, J. A., and Waff, H. S. (1983) Electrical conductivity of molten basalt and 434
andesite to 25 kilobars pressure: Geophysical significance and implications for charge 435
transport and melt structure. Journal of Geophysical Research, 88(B3): 2413–2430, 436
doi:10.1029/JB088iB03p02413. 437
Tyburczy, J. A., and Waff, H. S. (1985) High pressure electrical conductivity in 438
naturally occurring silicate liquids. In Point Defects in Minerals, Geophys. Monogr. Ser., vol. 439
31, edited by R. N. Shock, pp. 78– 87, AGU, Washington, D.C. 440
Volarovich, M.P. and Tolstoi, D.M. (1936) The simultaneous measurement of 441
viscosity and electrical conductivity of some fused silicates at temperatures up to 1400°C. 442
Journal of the Society of Glass Technology, 20: 54-60. 443
Waff, H. S., and Weill, D. F. (1975) Electrical conductivity of magmatic liquids: 444
effects of temperature, oxygen fugacity and composition. Earth and Planetary Science 445
Letters., 28: 254–260. 446
Wanamaker, B.J., and Duba A. (1993) Electrical conductivity of polycrystalline 447
olivine containing a silicate glass. Geophysical Research Letters, 20(19): 2107-2110. 448
Wannamaker, P.E., Hasterok, D.P., Johnston, J.M., Stodt, J.A., Hall, D.B., Sodergren, 449
T.L., Pellerin, L., Maris, V., Doerner, W.M., Groenewold, K.A., and Unsworth, M.J. (2008) 450
Lithospheric dismemberment and magmatic processes of the Great Basin-Colorado Plateau 451
transition, Utah, implied from magnetotellurics. G cubed, 9 (5), doi:10.1029/2007GC001886. 452
Wu, Y.C., and Koch, W.F. (1991) Absolute determination of electrolytic conductivity 453
for primary standard KCl solutions from 0°C to 50°C. Journal of Solution Chemistry, 20: 454
391-401. 455
Xu, Y., Shankland, T.J., Duba, A.G., and Poe, B.T. (2000) Laboratory-based electrical 456
conductivity in the Earth’s mantle. Journal of Geophysical Research, 105: 27865-27872. 457
Yoshino, T., Matsuzaki, T., Yamashita, S., and Katsura, T. (2006) Hydrous olivine 458
unable to account for conductivity anomaly at the top of the astenosphere. Nature, 443: 973-459
976. 460
Table 1: Composition of the starting glasses (wt%).
Sample Borosilicate Phonolite Kilauea basalt SiO2 50 55.73 49.96 TiO2 0 0.16 2.41 Al2O3 8 21.94 13.24 FeOt 2 1.95 10.88 MnO 0 - 0.13 MgO 0 0.19 7.50 CaO 0 2.87 10.58 Na2O 22 6.11 2.29 K2O 0 10.14 0.38 B2O3 18 - - Total 100 99.09 97.89
Table 2: Values of the Arrhenian parameters.
Sample Corrected* Uncorrected° Corrected* Uncorrected° Lnσ0 (ohm.m)-1 Lnσ0 (ohm.m)-1 Ea (kJ/mol) Ea (kJ/mol) Borosilicate 10 (1.5; 0.1) 5 (0.5; 0.1) 73 (14; 1) 31 (5.5; 2) Phonolite 8 (0.6; 0.1) 7 (0.5; 0.2) 83 (7; 2) 79 (5; 2) Kilauea basalt 14 (1.5; 0) 13 (1.5; 0.1) 177 (22; 1) 167 (17; 2)
* Corresponds to results from 2-electrode measurements corrected. Similar results with the 4-electrode measurements. See text for details.
° Corresponds to results from 2-electrode measurements.
Relative errors and standard deviations in terms of least unit cited on Ea and Lnσ0 values are shown in parentheses (error; standard deviation).
Error propagation has been estimated using the error on Lnσ and Eq. 7.
∆Lnσ = (1/σ).∆σ= di di Rl de de Rl l di de Ln Rl R di de Ln l R ∆ − + ∆ + ∆ − + ∆ − 1 . 2 1 1 . 2 1 . ² 2 1 . ² 2 1 π π π π
with R the electrical resistance, l the sample length, de and di its outer and inner diameters, respectively, and ∆Xthe error on X. ∆R=0.5ohm, and ∆de=∆di=∆l=0.1mm.
T a b le 3 : C h a ra ct er is ti cs o f th e 2 -e le ct ro d e se tu p s u se d i n p re v io u s st u d ie s. S o u rc e 1 T ec h n iq u e E x te rn al e le ct ro d e In te rn al e le ct ro d e G eo m et ri c fa ct o r M at er ia l D im en si o n s (m m )* M at er ia l D im en si o n s (m m )* o f th e sa m p le ( m ) P e t al .0 8 C y li n d ri ca l ce ll P t tu b e L : 5 -1 0 , D : 5 P t w ir e L :1 0 -1 5 , D :1 1 .4 -1 .8 .1 0 -2 T h ic k n es s : 0 .2 G 0 4 C y li n d ri ca l ce ll P t tu b e L : 3 0 , D : 6 P t w ir e L :3 0 , D :1 1 .4 .1 0 -2 T h ic k n es s : 0 .2 R M 7 7 L o o p t ec h n iq u e 8 0 % P t-2 0 % R h w ir e L : 7 , D : 0 .6 4 8 0 % P t-2 0 % R h w ir e L : ~ 7 , D : 0 .2 4 1 3 .6 .1 0 -2 W W 7 5 ( W 7 6 ) L o o p t ec h n iq u e 8 0 % P t-2 0 % R h w ir e L : 7 , D : 0 .6 4 9 0 % P t-1 0 % R h w ir e L : ~ 7 , D : 0 .2 4 1 3 .6 .1 0 -2 P r et a l. 7 2 H em is p h er ic al c el l P t h em is p h er ic al L :~ 2 0 , D :2 0 P t h em is p h er ic al L ~ 1 0 : D : 5 ~ 7 .1 0 -2 cr u ci b le cr u ci b le 1 P e t al .0 8 : P o m m ie r et a l. ( 2 0 0 8 ), G 0 4 : G ai ll ar d ( 2 0 0 4 ), R M 7 7 : R ai a n d M an g h n an i (1 9 7 7 ), W W 7 5 : W af f an d W ei ll ( 1 9 7 5 ), W 7 6 : W af f (1 9 7 6 ), P r et a l. 7 2 : P re sn al l et a l. ( 1 9 7 2 ). * L : l en g th o f th e el ec tr o d e (m et al li c w ir e o r tu b e o r cr u ci b le ), D : d ia m et er o f th e el ec tr o d e.
T a b le 4 : R ec o m m en d ed v a lu es o f th e A rr h en ia n p a ra m e te rs o f si li ca te m el ts a ft er t h e co rr ec ti o n o f 2 -e le ct ro d e m ea su re m en ts . R o ck t y p e 1 S o u rc e 2 O ri g in al C o rr ec te d O ri g in al C o rr ec te d C o rr ec ti o n o n ρ L n σ0 ( o h m .m ) -1 L n σ0 ( o h m .m ) -1 E a (k J/ m o l) E a (k J/ m o l) a t 1 3 0 0 °C ( % ) 3 T ep h ri te 4 P e t al .0 8 1 2 1 3 ( 2 .5 ) 1 4 2 1 6 0 ( 3 0 ) 9 P h o n o te p h ri te 4 P e t al .0 8 1 0 1 1 .5 ( 0 .5 ) 1 1 7 1 4 0 ( 7 ) 1 0 .5 H y d ro u s p h o n o te p h ri te ( 3 .5 ) P e t al .0 8 1 0 1 0 ( 0 .4 ) 1 0 5 1 0 9 ( 4 ) 1 7 ♦ P h o n o li te 4 P e t al .0 8 9 .1 1 0 ( 0 .5 ) 9 4 1 0 5 ( 5 ) 2 0 H y d ro u s p h o n o li te ( 1 .1 ) P e t al .0 8 7 .1 7 .8 ( 1 .5 ) 6 6 7 7 ( 1 8 ) 1 8 ♦ H y d ro u s p h o n o li te ( 5 .6 ) P e t al .0 8 7 .3 7 .8 ( 1 .3 ) 6 1 7 2 ( 1 7 ) 2 0 * R h y o li te 4 G 0 4 6 .7 7 .5 ( 0 .5 ) 7 0 .5 9 3 ( 5 ) 6 H y d ro u s rh y o li te ( 3 ) G 0 4 6 .5 6 ( 0 .5 ) 6 1 6 9 ( 6 ) 8 T h o le ii te R M 7 7 /W W 7 5 1 2 /1 2 1 9 ( 1 .5 )/ 2 2 ( 2 ) 1 3 5 /1 4 1 2 2 0 ( 1 5 )/ 2 5 0 ( 2 7 ) 2 7 /4 0 A lk al i o li v in e b as al t R M 7 7 , W W 7 5 6 /9 .3 1 6 ( 2 .5 )/ 1 7 ( 1 .5 ) 1 1 5 /1 0 4 1 7 6 ( 3 0 )/ 2 0 0 ( 2 0 ) 3 4 /2 5 M u g ea ri te R M 7 7 8 .3 1 3 ( 1 .5 ) 8 8 1 4 8 ( 1 8 ) 2 7 T ra ch y te R M 7 7 5 .8 8 .8 ( 0 .6 ) 5 0 8 0 ( 6 ) 4 1 L at it e W W 7 5 6 .4 1 0 ( 1 .2 ) 6 4 1 0 6 ( 1 5 ) 2 7 A n d es it e W W 7 5 6 .1 1 0 ( 5 ) 6 2 1 1 6 ( 7 ) 2 3 S y n th et ic b as al t P r et a l. 7 2 1 3 1 8 .2 ( 4 .5 ) 1 4 1 2 1 3 ( 5 5 ) 5 .5 F o r h y d ro u s m el ts , th e n u m b er s in p ar en th es es c o rr es p o n d t o t h e w at er c o n te n t (w t% ). P e t al .0 8 : P o m m ie r et a l. ( 2 0 0 8 ), G 0 4 : G ai ll ar d ( 2 0 0 4 ), R M 7 7 : R ai a n d M an g h n an i (1 9 7 7 ), W W 7 5 : W af f an d W ei ll ( 1 9 7 5 ), P r et a l. 7 2 : P re sn al l et a l. ( 1 9 7 2 ). C o rr es p o n d s to 1 0 0 .( 1 -( ρsam p le / ρmea su re d )) . E x p er im en ts u n d er p re ss u re ( 0 .1 -4 0 0 M P a) . ♦ V al u es a t Tm ax = 1 2 7 5 °C . * V al u e at T m ax = 1 2 5 0 °C . R el at iv e er ro rs o n c o rr ec te d E a an d L n σ0 v al u es a re s h o w n i n p ar en th es es a n d h av e b ee n e st im at ed u si n g t h e er ro rs o n L n σ a n d t h e A rr h en ia n eq u at io n ( E q . 7 ). S ee T ab le 2 f o r th e eq u at io n u se d f o r er ro r p ro p ag at io n o n c y li n d ri ca l ce ll s (P e t al .0 8 , G 0 4 ). F o r th e w ir e lo o p t ec h n iq u e an d th e te ch n iq u e u se d i n P r et a l. , 7 2 , th e eq u at io n u se d i s: ∆ L n σ = σ . . 1 . ² ∆ − + ∆ R ce ll G G G R ce ll , w it h ∆ X t h e er ro r o n X , ∆ G = 1 0 % G ( g eo m et ri c fa ct o r) , ∆ R ce ll = 2 0 % R ce ll ( ce ll e le ct ri ca l re si st an ce ).
Figure captions
Figure 1: 2-electrode and 4-electrode configurations. a) Drawing of the electrical cells connected to the impedance spectrometer. U and I represent the “voltage” and “current electrodes”, respectively. The connection of the 2 electrodes for the short-circuit experiment is represented by the dashed line. Note that the short-circuit experiment is performed on a free-sample cell. b) Equivalent circuit of both cells. With the 2-electrode setup, the resistance of the electrodes is counted in the measured impedance (Z*measured). Rpol // Cpol represent the polarization effects, Z”induct the inductive effects. See text for details. c) Electrical responses observed in the Nyquist plan (Z’, Z”) for the Kilauea basalt at 1300°C. The resistance of the sample R(ohm) is obtained for Z” = 0 and represents the real part of the complex impedance (Z’). The higher value of R in the 2-electrode system is attributed to the contribution of the resistance of the two electrodes. The short-circuit measurements underline the contribution of the cell in the 2-electrode configuration.
Figure 2: Changes in electrical resistance as a function of the immersion depth of the 4-electrode system.
Figure 3: Dependence of the electrical resistivity with temperature for the three investigated melts using 2-electrode (triangles) and 4-electrodes (crosses) configurations. Circles correspond to the 2-electrode data without the contribution of the resistivity of the electrodes (“2-electrode corrected”). See text for details. Inset graphs focus on the high temperatures data. Error bars are shown for the 2-electrode corrected data.
Figure 4: Ratio of the measured resistance and the resistance of the electrodes for this study and other studies of the electrical conductivity of silicate melts using 2-electrode measurements. P et al. 08: Pommier et al. (2008), G et al. 08 : Gaillard et al. (2008), GIM 05 : Gaillard and Iacono Marziano (2005), G 04 : Gaillard (2004), RM 77 : Rai and Manghnani (1977), WW 75 : Waff and Weill (1975), Pr et al. 72 : Presnall et al. (1972). Gaillard et al. (2008) performed a 4-electrode study, the data point was a test with a 2-electrode configuration. The lower the ratio, the higher the contribution of the electrodes to the measured resistance.
2-electrode configuration
4-electrode configuration
5 10 15 20 Z' (ohm) 4 3 2 1 0 -1 Z " (o h m ) Kilauea basalt 1300°C 4 electrodes 5 10 15 20 Z' (ohm) 4 3 2 1 0 -1 Z " (o h m ) Kilauea basalt 1300°C 2 electrodes 20.11 20.63 1.83 Z*measured Z*short-circuita)
b)
c)
in d u ct io n ind u ct io n Sample dimensions: l = 3.5 to 9mm od = 4.5 to 7.5mm id = 1mm Sample dimensions: l ~ 30mm od = 30mm Impedance spectrometer U U Pt tube (external electrode) Pt wire (internal electrode) Alumina plug Coaxial cables Pt wires Sample 1atm furnace U I I Impedance spectrometer Pt sheets Alumina crucible Sample dimensions: l = 3.5 to 9mm od = 4.5 to 7.5mm id = 1mm Sample dimensions: l ~ 30mm od = 30mm Impedance spectrometer U U Pt tube (external electrode) Pt wire (internal electrode) Alumina plug Coaxial cables Pt wires Sample 1atm furnace U I I Impedance spectrometer Pt sheets Alumina crucibleKilauea sample
4-electrode setup
1430°C
8
10
12
14
Measured resistance (ohm)
8
6
4
2
0
Im
m
e
rs
io
n
d
e
p
th
o
f
th
e
e
le
c
tr
o
d
e
s
(m
m
)
Constant R value
6 7 8 9 10,000/T(K) -6 -5 -4 -3 -2 -1 L n ( re s is ti v it y ) (o h m .m ) 5.6 6 6.4 6.8 7.2 10,000/T(K) -2 -1 0 1 2 L n ( re s is ti v it y ) (o h m .m ) 6 7 8 9 10,000/T(K) -2 -1 0 1 2 L n ( re s is ti v it y ) (o h m .m )
2 electrodes
2 electrodes corrected
4 electrodes
Borosilicate Phonolite Kilauea basalt 6.4 6.8 7.2 0 0.4 0.8 1.2 1.6 8 8.4 8.8 9.2 0 0.4 0.8 1.2 1.60 1 2 3 4 5 6 7 8 9 10 11 1 10 100 1000 10000 R m e a s u re d / R e le c tr o d e s Bor osili cate Pho nolit e Kila uea basa lt P e t al. 08 G e t al. 08 GIM 05 G 0 4 RM 77 WW 75 Pr e t al. 72