Liquidity analysis in the LNG market, illustrating the
stakes to become a mature commodity market
Bachelor Project submitted for the degree of
Bachelor of Science HES in International Business Management
by
Ludovic MILLET
Bachelor Project Mentor:
Robert PILLER, lecturer
Geneva, 21st August 2020
Haute école de gestion de Genève (HEG-GE) International Business Management
Disclaimer
This report is submitted as part of the final examination requirements of the Haute école de gestion de Genève, for the Bachelor of Science HES-SO in International Business Management. The use of any conclusions or recommendations made in or based upon this report, with no prejudice to their value, engages the responsibility neither of the author, nor the author’s mentor, nor the jury members nor the HEG or any of its employees.
Geneva, August 21st, 2020
Acknowledgements
I am extremely grateful, and take the opportunity to share my gratitude to the following people who shared their knowledge, expressed their opinion and ideas, and made this work achievable:
- Mr. Robert PILLER, for sharing his passion for commodity trading during the whole year in the major course, for being available, sharing ideas, knowledge, and his guidance during the thesis duration time.
- Mr. Dan Zastawny for his availability to be interviewed several times during a time featured by the pandemic crisis. His expertise on making commodity markets liquid, his knowledge on the energy markets (and especially LNG), his feedback on several points of the analysis. I must say that it was an enjoyable time discussing with him.
- Mr. Yves Leiss, for his support, knowledge, and recommendations.
Executive Summary
With the environmental considerations being at the heart of the decade, and the energy industry being regarded as a negative contributor, more environmentally friendly ways to power generation are being studied. However, fossil energies are still a major contributor to power generation, and greener substitutes face a hard time to be commercialised at big scale.
Natural gas, a fossil energy and a substitute to oil that can be used for power generation, is transported through pipeline in its gaseous state. However, the big difference between the two commodities is that natural gas has the molecular properties to meet environmental regulations.
About a decade ago, the natural gas market has seen an increasing trend to liquefy natural gas, enabling the commodity to be transported by ships and further away from its supply zone. Although liquefying natural gas has been around the world for a long time, it has evolved to become internationally traded, and trading firms have recently become focus on its tradability, more precisely the liquidity within the market.
This research paper aims at analysing the liquidity in the liquefied natural gas (LNG) market, a crucial component of trading, and to illustrate to which point there is a potential that the traded product becomes as mature as the crude oil market is today.
The paper explains what liquidity is, what are its measurement and takes the oil market as an example of a mature commodity market. It studies the physical market of LNG, its futures contracts and compares it to oil.
The study has shown that the market has reached a comfortable phase in terms of market maturity, that the evolution is following the way the oil market grew, and even faster. However, it has been found that the LNG market has no liquidity. It might have grown faster than oil, but without efforts from existing market players and new entry of market players, the liquidity in the market might never grow and the LNG market will struggle to evolve further, towards becoming a mature commodity market.
Contents
Liquidity analysis in the LNG market, illustrating the stakes to become a mature
commodity market ... i
Disclaimer ... ii
Acknowledgements ... iii
Executive Summary ... iv
Contents ... v
List of Tables ... viii
List of Figures ... viii
1. Presentation of the subject ... 1
2. Literature Review... 3
2.1 What is Liquefied Natural Gas? ... 5
2.2 Liquidity ... 5 2.2.1 What is it ? ... 5 2.2.2 Liquidity indicators ... 6 2.3 Forward contract ... 6 2.4 Futures contract ... 7 2.5 Open interest ... 8
2.6 Spot and Term contract ... 8
2.7 What is a mature commodity market? ... 9
2.8 Oil, gas and LNG benchmarks ... 10
2.9 The Natural Gas Market ... 11
2.9.1 History ... 11
2.9.2 Production ... 13
2.9.3 Gas consumption and uses ... 15
2.9.4 Pricing formation mechanisms ... 15
2.9.5 Natural Gas Derivatives growth... 16
2.10 The LNG Market ... 17
2.10.2 Value chain ... 18 2.10.3 2019 Trade flows ... 21 2.10.4 Energy conversion ... 22 2.10.5 LNG Incoterms ... 23 2.10.6 Pricing of LNG ... 23 3. Methodology ... 25 4. Results ... 27
4.1 The oil market template ... 27
4.1.1 From a vertically integrated oil market to an active spot trading ... 27
4.1.2 Derivatives growth ... 28
4.2 Size of the physical LNG market compared to oil sea-borne trade ... 32
4.2.1 An increasing number of countries involved in the LNG market ... 33
4.2.2 Where has been most of LNG demanded, and supplied from? ... 33
4.2.3 Growing share of LNG traded on spot ... 34
4.2.4 Long-term average contract duration ... 35
4.2.5 A disconnection between oil-linked long-term contract and spot prices ………..36
4.2.6 LNG freight ... 37
4.3 A shift to a bigger share of GOG pricing in the overall gas markets .. 40
4.4 Prices and Pricing in LNG ... 41
4.4.1 Pricing... 41
4.4.2 Correlations across different commodity benchmarks ... 42
4.5 Liquefaction and regasification capacity evolution ... 44
4.6 Liquidity indicators results ... 45
4.6.1 Level of trading activity ... 45
4.6.2 Churn rates comparison ... 46
4.6.3 Bid/ask spreads ... 47
4.7 JKM’s cleared volume evolution: in terms of cargoes? ... 48
4.8 Liquidity issues... 48
5.3 An FOB LNG benchmark, more liquid? ... 57
5.4 Remarks ... 58
6. Conclusion ... 60
7. Bibliography ... 62
8. Appendixes ... 67
8.1 Futures Daily Market Report for ICE Brent Futures 04-Aug-2020 ... 67
8.2 Futures Daily Market Report for Financial LNG 04-Aug-2020 ... 70
8.3 Futures Daily Market Report for ICE Brent Futures 17-Aug-2020 ... 72
8.4 Futures Daily Market Report for ICE WTI Crude Futures 17-Aug-2020 ... 74
8.5 Futures Daily Market Report for Financial LNG 17-Aug-2020 ... 76
List of Tables
Table 1: Top LNG country exporting / importing in 2019 ...22
Table 2: Daily Market Report Futures comparison for selected commodities ...45
Table 3: Churn rates comparison accross different hubs ...47
List of Figures
Figure 1: Forward contract schema ... 7Figure 2: Futures contract schema ... 8
Figure 3: Three phases of the world oil market ... 9
Figure 4: World natural gas production by region ...13
Figure 5: Natural gas production in the OECD ...14
Figure 6: Natural gas use for power generation ...15
Figure 7: LNG spot price delivered in Asia and Henry Hub spot price ...17
Figure 8: LNG value chain ...19
Figure 9: Major LNG flows in 2019 ...21
Figure 10: Conversion table ...22
Figure 11: Energy vocabulary ...23
Figure 12: Crude oil price history ...27
Figure 13: Total open interest for all futures contracts in three types of crude oil ...31
Figure 16: Share of spot & short-term vs total LNG trade ...34
Figure 17: Average of long-term and medium-term contracts in years ...35
Figure 18: Spot prices lower than long-term contract price ...36
Figure 19: Evolution of ship capacity and total numbers of ships ...37
Figure 20: Cargo capacity and year of construction ...38
Figure 21: LNG carrier time charter rate compared to a capacity equivalent (energy) oil tanker time charter rate ...39
Figure 22: World Price Formation from 2005 to 2018, includes pipeline and LNG ...40
Figure 23: LNG imports pricing from 2005 to 2018 ...41
Figure 24: LNG price correlation with other commodity benchmarks. ...42
Figure 25: Asian LNG spot price correlation with Brent, TTF and Henry Hub ...43
Figure 26: Worldwide liquefaction and regasification capacity to total imports ...44
Figure 27: Japan-Korea Marker churn rate evolution ...46
1. Presentation of the subject
Trading commodities is about logistics and price risk management. Traders balance regional supply and demand, in other words, they move excess of production from one place to another where there is a lack of supply. They operate under low margins and move big quantities through big shipments, optimizing the logistics. They also take market price risk from one geographical point to another, and the length in time of price risk depends usually upon the length of the cargo voyage. It can take a couple of days to even months. Hence, it is risky for a trading company to purely take the market price risk without managing it at all since it moves huge quantities (and so great amounts of money) and a small change in unit price can drastically change the overall value of the cargo once arrived at its destination, when sold. Usually, trading companies will hedge themselves, using derivatives.
The LNG market, as it will be illustrated in the literature review, is evolving quite rapidly, but to which point? Can it become a mature market? What is considered as being a mature market?
This paper aims at bringing an oversight of where the LNG industry stands in terms of trading such commodity. It will study the physical trade of LNG as well as its derivatives, the latter being a financial tool to hedge, in other words, a financial tool to manage market price risk from one point to another. The paper will take the oil market as a benchmark and as an example of a mature market. Finally, comparisons will be made between the natural gas market, the LNG market, and the oil market.
The world’s total population is growing, and for most of it, living standards will continue to improve. Consequently, demand for energy is expected to grow rapidly in the next decade. The natural gas commodity is abundant and is the cleanest-burning fossil fuel currently found on earth. Currently, consumption of petrol-based products cannot be substituted in the very short-term, though seen as environmentally “non-friendly”, and non-renewable. Renewable energy is so far not being developed enough or unable to definitively take over the non-renewable energy demand. The LNG market is still in development, and being a substitute to petrol-based product, the latter market being mature, it is interesting to compare how LNG has and can evolve compared to the oil market at a time when it was still not developed like today. The oil market used to be
mostly based on long-term contracts, but the emergence of spot pricing is growing, enabling some liquidity in contracts, a pattern of a maturing market. The question is whether the LNG market can become mature, how far it is from being a mature market.
Gas is usually found where oil is found, underground. So far, the trend was rather to drill for oil and the gas found in wells used to be burnt, seen as by-product. As a matter of fact, gas has not been viewed as a very valuable product. Nowadays, due to climate change, pollution regulations, CO2 emissions control and the Paris agreement (setting a limit of temperature increase by 2050), gas is seen more valuable due to its carbon properties.
2. Literature Review
The gas market is a segmented market, unlike petrol which is rather unified. There are three main geographical zones defining three gas markets, each having differences in pricing practices: The North American market, the European market, and the Asian market. However, those markets have two common points: the gas has no captive use and is rather expensive to freight. The liquefaction of natural gas (becoming then LNG) enables freight cost to be affordable due to bigger economy of scale as the liquefied natural gas gets to be smaller by 600 times, in volume (Petrozzello, 2018). The worldwide gas production internationally traded was of 24% in 2012, meaning that one-fourth of total production was internationally traded. Natural gas demand, made through pipeline, cannot be much extended and is expensive in its infrastructure. Natural gas demand in remoted areas, and in places where pipelines do not exist have to be completed through shipping, thus LNG (Henderson 2019).
Natural gas will still be a major contributor to the world energy supply in 2040 (MORRISON et al, 2019). Its financial sustainability can be an issue and a risk. As an example and according to the Financial Times article “European Investment Bank postpones decision on natural gas lending” (Khan, 2019), “The European Investment Bank has postponed a decision that would have banned it from channeling billions of euros towards natural gas projects, following strong opposition from members including Germany.”
Liquefied natural gas sees new investments, new technologies arising (storage quantity improvement and regasification units), with a said promising future (Morrison, 2019). Demand growth, mostly linked to environmental policy reasons, have encouraged numerous potential new investments, including trading companies such as Trafigura and Gunvor. Current projects in two regions such as the United-States and Mozambique (two different gas markets) will see a “wave” of new exports. (Morrison, 2019). The LNG market is already oversupplied, with spot prices ($3.5/mbtu) below “oil-linked” priced long-term contracts ($9/mbtu) (Harry Dempsey, 2019). LNG demand is still expected to grow, especially in Asia, where power plants using coal or oil-derived products to produce electricity are switching energy input to gas power generation (Morrison, 2019). However, Asian demand has lately stalled compared to what was forecasted (Harry Dempsey, 2019). There is ambiguity regarding the Asian demand, which is nowadays the biggest importer of LNG and is still forecasted to be.
The US market has lately turned to be a natural gas exporter since February 2017 (Blackdown David), increasing supply through the shale technology discovery, reducing to zero historical imports.
The European market, which has historically been the market where excess of LNG supply could be dealt with and stored, is now reaching its limits, and will need new “tools” to stay the “last resort place” for selling trades (Anna Shiryaevskaya, 2019).
The ice-free northeast passage, a shipping route, will be of strategy for Asian importers and Russian exporters (Michael Schach, Reinhard Madlender, 2018).
Although a majority sees an evolution in the LNG market, there is an issue whether long-term oil-linked priced contracts will still be useful, as more buyers seek to introduce alternative price references into their supply agreement, seeing cheaper alternatives, though less secure for supply. Whether the market will move to a market where spot trade will be dominant, spot trading and the question of liquidity in contract is key towards becoming a mature market. According to ExxonMobil, the liquidity of contracts will improve slightly (a reduction of contract length), but there are a variety of views on how far it will go, and how quick. Some see a market like oil (very liquid) in a near future, but the company thinks that liquidity will evolve but not at the pace forecasted by some (Peter Ramsay, 2019).
Some companies, such as Chevron, do not see much future in such commodity, divesting its shale gas related assets, focusing on the oil business (Gregory Meyer, 2019).
The International Maritime Organization (IMO) has introduced regulations limiting sulfur content of bunker fuel to 0.5%, taking effect on January 1, 2020, pushing shipments to be environmentally more friendly. The impact of such regulations might increase demand for LNG. A cruising company, “Costa Cruise” is ordering LNG powered ships, helping to design a more environmental goal.
What is unknown so far in the study is the level of spot trading and the level of liquidity within the market, which are keys to become a mature market. Meanwhile, there are lots of different views on how fast the LNG market is going to grow and potentially be liquid. The study aims at showing where is the LNG market standing today, compared to a mature market like oil in terms of liquidity, and to bring to a trading firm level issues and opportunities that derives from the actual level of liquidity in the LNG market. The choice of comparing to the oil market is mainly because the oil market is a very mature market and that oil and gas are energy substitutes.
2.1 What is Liquefied Natural Gas?
Liquefied natural gas (LNG) is natural gas (NG) but in its liquid phase. Natural gas is called “the prince of hydrocarbons” (Chandra 2006), a hydrocarbon being an organic chemical compound composed exclusively of hydrogen and carbon atoms, such as crude oil, coal and other energies. Natural gas, mainly composed of methane (70%-90%), is gas in its gaseous phase and can be burnt directly to generate power (mainly electricity), chemically modified to produce other products such as fertilizers, chemicals, and also transformed to diesel used for transportation (Chandra 2006).
2.2 Liquidity
2.2.1 What is it ?
The term “liquidity” of a market can be defined as the ease to enter in or to get out of a contract. The greater the number of contracts in a market, the easier it is to reach a buyer or a seller in due time and at a price reflecting fair value at that time. In other words, the easier it is to resell or rebuy a contract. On the other hand, in a market where only few contracts exist, it may take time to get out of a contract, creating the risk of not finding a buyer or a seller in due time, or at the wished (or fair) price. In the energy trading sector, the most liquid commodity is oil. Coal is said to be rather liquid, but it is not traded to the same extent or with as many derivatives as crude oil. Andrew Hecht, in his article web page defines liquidity as “buying or selling a commodity asset without disrupting market price, it occurs generally when an asset has a high level of trading activity”. (HECHT 2020). Liquidity starts with the physical trading activity of a commodity, from producers, to traders and end-consumer. Then, everything else that is being traded are financial instruments, called derivatives with a price that should reflect the value of the underlying hard commodity asset. This called derivative market will bring liquidity with the venue of speculators, investors, arbitrageurs, and other parties. According to Mr. Hecht, there are certain requirements that define a liquid market which is that there must be an active spot or cash underlying market in the physical commodity; numerous buyers, sellers, hedgers, investors, speculators and others must be present in the market; a transparent, open and non-discriminatory delivery mechanism; a well-defined relationship between the derivative and the physical commodity (price convergence) and the presence of a mechanism to exchange the cash commodity and derivatives. (HECHT 2020)
to which a product can be quickly bought or sold without affecting its price and without incurring in significant transaction cost” (magnuscmd 2017). The less liquid a market is, the more liquidity acts as barrier to entry. The more liquid a market is, the more evidence of strength in the market is and commodity prices better reflect changes in supply and demand foundations. Liquidity creates a market sphere in which all types of companies will be able to compete equally with vertically integrated companies.
2.2.2 Liquidity indicators
Liquidity in an energy market can be measured by several indicators. The volume of transactions: a low trading activity results in low liquidity and vice versa. Furthermore, in a market where a consistent level of trading is, the market must be able to take in the level of trading (with the venue of speculators for instance) without affecting the transaction price. The churn rate is frequently used to indicate so, defining the proportion of paper trade to physical trade demand. A benchmark for liquidity according to the International Energy Agency is a churn rate with ratio 1:10, which means that the market can be considered as liquid when the market reaches 1 unit of product traded (delivered) physically for 10 units of that same product traded through financial instruments. Another element defining the level of liquidity is the active participation of financial agents in the market (their contribution to liquidity improvement), but rather hard to capture. However, many financial agents take the churn rate as a reference to choose whether to participate in a market. Hence, the churn rate ratio gives a sufficient overview of their participation in the market.
Another indicator is the transaction cost, in other words, the spread between the maximum price the market is willing to buy and the minimum price the market wants to sell. The lower the spread, the least transaction costs are, the more certain the price is reflecting the fair value of the commodity at a point in time, the more liquid the market is. Lastly, the “time of transaction carried out” is of assistance to measure the level of liquidity in a market, in other words the speed at which usually a purchase or sale of a commodity can be made. (magnuscmd 2017)
2.3 Forward contract
A forward contract is a customized and private contract between two parties, a buyer and a seller, to trade an asset with a price contracted today for a specified delivery date in the future. It is an Over-The-Counter (OTC) derivative with customized terms and features. In this type of trade, each party take the credit risk of the other party, known as
counterparty risk. Two forms of settlements can take place: cash-settled contract and physically-settled contract. The former is a settlement method where the seller of the instrument does not deliver the actual physical underlying asset but transfers the associated cash position. According to Mr. Chen, a cash settlement contracts are a reason for the entry of speculators, which in turn bring more liquidity in derivatives market (Chen 2019a). With a physically settled contract, the seller delivers the agreed specified quantity and the buyer pays the agreed price.
Figure 1: Forward contract schema
Source: Own computation
2.4 Futures contract
Futures contracts are forwards contracts, but which are standardized and traded on an Exchange. The Exchange will determine all the terms except the price. It will determine the delivery point, the delivery date, the quantity for one contract, the quality of the commodity (a minimum grade) and the currency in which it is traded. Unlike a forward contract in which each party take the risk of the other party, the Exchange is the counter party for the seller and for the buyer. The exchange guarantees performance and is the intermediate to the seller and to the buyer, and to guarantee so, asks each party to deposit a margin. The margin usually represents 10% of the contract value and serves as collateral for the exchange.
Figure 2: Futures contract schema
Source: Own computation
2.5 Open interest
The open interest is the amount of “outstanding” derivatives (futures and options) contracts that have not been settled (Ganti 2019). In other words, the number of bought or sold contracts, not the total both added together. An increasing open interest exemplify new or additional money coming into the market whereas a decreasing open interest express an out-flow. The open interest describes the amount of position that are opened, but that have not been closed-out, and have neither expired nor been exercised. It differs from trading volume: the volume is the number of trades completed each day, and the open interest are the number of contracts held by traders and investors, ready to be traded. These two metrics relate to liquidity and activity of futures contract, which give a picture of financial trading activity.
2.6 Spot and Term contract
Spot contract refers to agreement for immediate sale or purchase of a commodity. Price is agreed at contract signature for a delivery in the earliest possible delivery cycle of the commodity. For instance, on the New York Mercantile Exchange, spot crude oil contracts are traded for a delivery the next calendar month. Each market has a different delivery time-lag for spot trading contract and is usually less than 3 months.
Term contracts are contract with a longer duration. In the energy industry, there are typically 3 forms of term contracts: long-term contracts (over 5 years duration), fixed premium contracts (premium is fixed over the duration of the contract) and evergreen contracts (contract that can be extended by mutual agreement for the next year).
The energy industry can be characterised as capital-intensive for projects, debts form a big part of energy company budgeting. This way, using term contract, a producing company will ensure its future revenues, thus a sustainable cash-flow. Term contracts will minimise risk associated with short-term price volatility. From a consumer point of view, term contract has the advantage to secure supply.
On the other hand, spot market is largely influenced by supply and demand fundamentals, and factors such as political, production capacity, changes in weather heavily impact prices, which can move sharply and in only a short time. However, these spot prices changes can offer trading opportunities, such as arbitrage opportunities, which will maximise profit and which would be typically unfeasible through term contract. Other advantages are that the spot market reflects the true value of the commodity for that precise time, and the combination of hedgers, speculators and arbitrageurs help the price discovery process (Veluri 2009).
2.7 What is a mature commodity market?
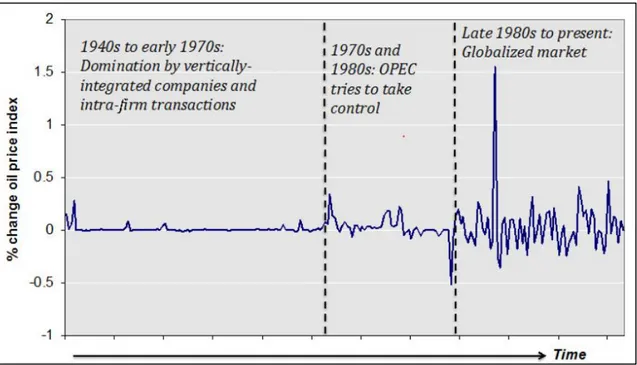
Figure 3: Three phases of the world oil market
Source: Seth Blumsack, 2020
As shown on Figure 3, the word oil market can be explained in 3 phases. The first phase features the domination of the called “Seven Sisters”, which were vertically integrated
constant. The second phase defines the creation and emergence of OPEC, the “Organization of the Petroleum Exporting Countries”, which is an intragovernmental organization consisting of the 14 world’s major oil-exporting countries. Founded in 1960 to coordinate oil policies across its members, it aims at regulating supply of oil in the world, to set a price on the world market. This phase shows OPEC’s attempts to globalize oil trade, the emergence of spot trading. Prices are becoming rather volatile. The third phase is explained by the “commoditization” of oil markets, oil is actively traded on spot transactions (long-term contract still exists but less in proportion compared to the 1st
phase), prices become a lot more volatile and the development of financial instruments (futures, options…) and regional prices linked with inter-regional trade features the phase (Seth Blumsack 2020). This third face is called a mature market.
2.8 Oil, gas and LNG benchmarks
A natural gas hub is usually a physical transfer point, generally where numerous pipelines are connected. The operator offers services that facilitate buying, selling and transportation of gas. It can also be a “virtual hub”, which is a virtual trading point with non-physical delivery.
Launched by Platts in February 2009, the JKM (Japan/Korean Marker) is the liquefied natural gas benchmark price assessment for spot physical cargoes. Referenced in spot deals, tenders, and short, medium and long-term contracts in Northeast Asia and globally, it reflects the spot market value of cargoes delivered DES (delivered ex-ship) into Japan, South Korea, China and Taiwan. S&P Platts, which is an independent provider of information, benchmark prices and analytics for commodities markets, uses a Market-on-close (MOC) assessment methodology since 2018, a “day-long” process in which the company survey the LNG market for bids, offer, trades and market fundamentals to assess a daily price. (JKMTM (Japan Korea Marker): LNG Liquefied
Natural Gas Price Assessment | S&P Global Platts [2020]).
Regarding natural gas, Henry Hub is a natural gas pipeline hub situated in Erath, Louisiana (US) serving as the delivery location for futures contract and the pricing point for natural gas futures on the New York Mercantile Exchange (NYMEX). The hub is based on the actual supply and demand of natural gas as a commodity by itself. Although its spot price is specific to the American gas market, other global gas producer such as Qatar and Australia would also base their pricing mechanism of their gas deliveries there, rather than indexing to oil (Chen 2019b). The settlement prices at Henry Hub are also
used as benchmarks for part of the LNG market. It is a reliable benchmark due to its high liquidity, it has large trading volume and a clear pricing transparency.
In Europe, numerous benchmarks exist, although many of them are still in development and not liquid, the National Balancing Point (NBP) and the Title Transfer Facility (TTF) are the most famous and liquid ones. Both hubs are virtual hubs. According to Reuters, these benchmarks were becoming dominant price benchmarks for global LNG spot trading in 2016 (McFarlane, Vukmanovic 2016). NBP is a virtual trading location for the sale, purchase, and exchange of UK natural gas, and TTF is a virtual trading point in the Netherlands.
Regarding oil, the two most famous benchmarks are WTI and Brent. In the context of the thesis, only these two will be considered as there are developed pricing points and liquid benchmarks. WTI (West Texas Intermediate) crude oil is sourced from US oil fields (mainly Louisiana, Texas, and North Dakota), is located inland and its delivery point is located in Cushing, Oklahoma. Most of the US crude market is priced against WTI, and more or less two-third of worldwide crude oil is priced against Brent (Author Staff 2020). The Brent crude originates from oils fields in North Sea (Europe), with delivery FOB Sullom Voe, (UK).
2.9 The Natural Gas Market
2.9.1 History
Britain and the US are the two areas in the world that have first commercialized natural gas. Britain, around the end of the 18th century, have first used natural gas to light houses
and streets. In the beginning of the 19th century, the US manufactured natural gas the
way Britain did (natural gas produced from coal) to light its street. In fact, natural gas was not used for anything else than lighting until the 20th century when effective pipelines
were built and the use of gas expanded to manufacturing and processing plants, home heating and to generate electricity (American Public Gas Association 2020).
Although today’s natural gas market is a central component to the world’s supply of energy, the development of such industry was mainly made through regulatory restructuring. In the US, a starting point is the Natural Gas Act of 1938 (Parsons 2017). The country regulated its natural gas market by using a “cost-of-service” model, which is a price set by authorities to recover the initial investment. Since gas and oil are
prices), gas shortages appeared, and new regulations came in to protect production by securing demand through long-term contracts. Then appeared the fall in oil price right after 1981, creating a gas surplus on the market and the “take-or-pay” gas contract appeared. By the end of the years 1980s, new regulations made the gas market more liberalized by enabling an open access to pipelines and the right to resell gas. Pipeline trading centers developed and amid these were the creation of the Henry Hub in 1988, located in Louisiana. It enabled connection of US pipelines, enabled access to more buyers and sellers which in turn assured a competitive spot market for gas. Since the hub creation, price differentials from different states in the US started to decrease and the US gas market became more of a national market. The spot market share grew from 0% in 1982 to more than 55% five years later (Parsons 2017).
In the UK, the industry was a national monopoly (British Gas) until the 1950s and moved to a more liberalized market during the next forty years by enabling access to competitive supply, breaking company monopole. In 1995, the Gas Act created a “process for the daily balancing of supply by shippers across the National Transmission System” (Parsons 2017). Additionally, the National Balancing Point (NBP) was created, which is “the pricing convention for trading offsetting quantities in and out of the system at various locations”. (Parsons 2017). In other words, it is a virtual hub, unlike Henry hub, which is a physical hub.
In central Europe, it is only recently that gas hubs emerged, coming from a decrease in length in long-term gas contract and vertically integrated companies managing gas. In fact, the process of market liberalization is a precondition for hub development. It is demonstrated by Shi Xunpeng that there are three main reasons: market liberalization is necessary to create a competitive environment, the lack of competition is a major barrier for hub development. Secondly, a key incentive and fundamental role of a hub is to create demand for wholesale trade, which would not happen without market liberalization. Finally, electricity utilities are major players to develop hubs, and without a liberalization of national electricity market, they might not have incentives to participate in wholesale gas trading since they can easily pass on costs to consumer (Shi 2016). Among these central European hubs development, the Title Transfer Facility (TTF) and the port of Zeebrugge are vital spot markets, and virtual hubs.
The eastern Asian region has not developed any active spot market for natural gas. In fact, and according to studies made by the International Energy Agency, the region does
not have pipelines as well interconnected as Europe or the US have and is physically fragmented.
2.9.2 Production
Figure 4: World natural gas production by region
Source: International Energy Agency (IEA), 2019
Natural gas production is undoubtedly increasing worldwide. The growth in 2018 comes mainly from the OECD Americas region followed by the non-OECD Europe/Eurasia.
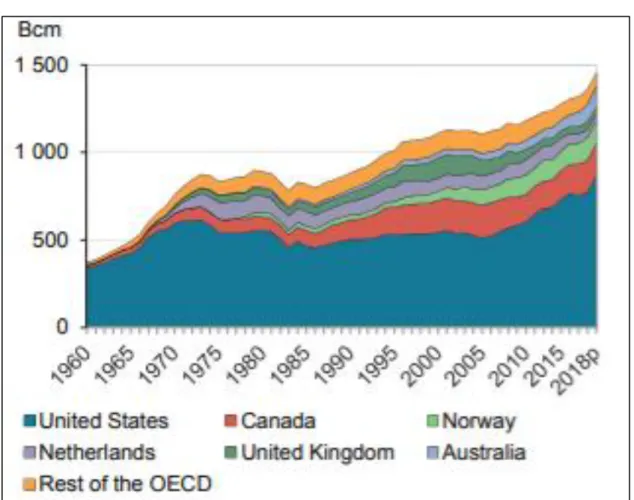
Figure 5: Natural gas production in the OECD
Source: International Energy Agency (IEA), 2019
Focusing on the OECD countries, the year 2018 marks the most significant increase gains in US production, since the shale revolution. Australia continued growth is marked by an increase in output from one of its gas-condensate field (“Itchys”) while Canada is still growing production. In Europe, however, overall gas production is declining with Netherlands’s commitment to reduce exploitation of the Groningen field (earthquake risk) and a slight decline in Norway’s production output.
Amongst non-OECD countries, Russia is the second largest producer of gas, Iran has been on an increasing annual production trend for the decade, China has tripled its production in about 15 years, Qatar and Algeria remained in a constant quantity production for the last couple of years.
The top five natural gas producing countries in 2018 were the United States, Russia, Iran, Canada and Qatar, which together accounted for 55% of worldwide production in 2018. Total gas production reached 3’937 bcm in 2018 (International Energy Agency (IEA) 2019).
2.9.3 Gas consumption and uses
Figure 6: Natural gas use for power generation
Source: International Energy Agency (IEA), 2019
Gas is mainly used for power generation. According to 2018’s data, out of 3’937 bcm produced, more than 1’500 bcm were used for power generation, representing a little less than 40% of the overall worldwide gas production.
2.9.4 Pricing formation mechanisms
The way natural gas is being sold and priced varies between the three global markets. Although natural gas and oil share many of the same characteristics, such as being hydrocarbons, produced and found in similar areas, they differ a lot in the way they are sold and priced. Oil is sold by weight or volume (tons or barrels) whereas gas is sold by unit of energy (British Thermal Units, Joules…), which can be converted into volume and energy equivalent for comparison.
According to the International Gas Union’s Wholesale Gas Price Survey, (International Gas Union 2019) here are the different way of pricing gas around the globe:
- Oil Price Escalation (OPE): the price is linked to competing fuel (crude oil, gas/fuel oil, coal and in some case electricity price) usually through a base price and an escalation clause.
- Gas-on-Gas Competition (GOG): price is set by supply and demand and is traded at physical hubs (Henry Hub) or notional hubs ( NBP, TTF…) over a variety of different periods (monthly, annually…). This pricing formation mechanism will include short and long-term trade as well as any LNG spot cargoes and any pricing which is linked to hub or spot prices.
- Bilateral Monopoly (BIM): price is set by bilateral discussion and agreements between a large seller and a large buyer (typically state-owned company) and fixed for a period of typically one year. To distinguish between GOG where there would be multiple sellers and buyers, BIM usually occur where one side of the transaction is a single dominant player.
- Netback From Final Product: the price sold by the gas supplier is a function of the final product price.
- Regulation Cost of Service (RCS): the level of price is to cover the “cost of service”, the recovery of investment and is usually set by a regulatory authority. - Regulation Social and Political (RSP): price is determined on a political/social
basis, probably by a minister, in response to cover increasing cost.
- Regulation Below Cost (RBC): the price purposely set below the average cost of producing and transporting gas (state subsidy)
- No Price (NP): Gas is provided freely to industry and population and will usually need to be retreated (it is usually a by-product).
2.9.5 Natural Gas Derivatives growth
According to Parson’s paper and his research in Doane & Spulber 1994’s paper, NYMEX suggested in 1984 a natural gas contract that was dismissed by the CFTC due to the lack of competition in the underlying physical market. Six years later, it was accepted, the Henry Hub was considered large enough to minimize the possibilities of price manipulation. In the following years, the contract took off and Henry Hub became the natural gas price benchmark throughout America. The price discovery moved to the futures market. The OTC market derivative trading became at that time an important aspect of US gas market with Enron as a major player with others (Parsons 2017). However, derivative trading was disrupted due to Enron scandals (fake holdings and off-the-book accounting) (Segal 2020) and the following California electricity crisis. In fact,
events made some leading trading companies in financial difficulties which exited the business.
In the UK, derivative trading evolved through the implementation of futures contract pursuing the rise of OTC derivative market (forward contract) around NBP. These futures contracts were traded through IPE, which is now ICE. In 2016, the OTC derivative market remained bigger than the futures derivative market (Parsons 2017).
2.10 The LNG Market
2.10.1 LNG’s last decade history through price analysis
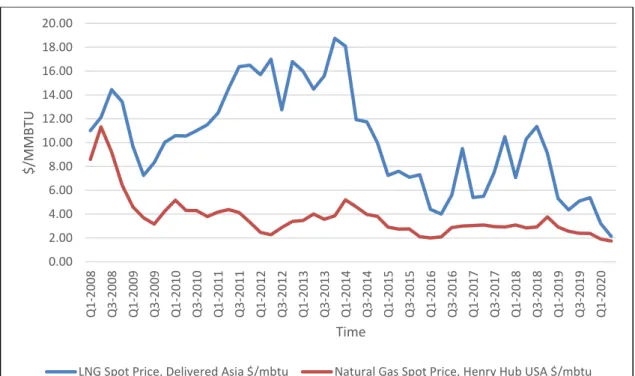
Figure 7: LNG spot price delivered in Asia and Henry Hub spot price
Source: Own computation, data from Shipping Intelligence Network, 2020
Although 1964 is the “year zero” of the modern, globalized liquid natural gas industry, it roots back from more than a century ago when famous scientists, such as Michael Faraday, began experiments with liquefying gas. The first plant was built in 1940 in the US (Ohio) to provide surge capacity for its heating customer. In 1959, a converted ship named “Methane Pionneer”, the first seaborne LNG cargo, sailed from Louisiana to Britain proving the commercial feasibility of this commodity. In the early years, growth
0.00 2.00 4.00 6.00 8.00 10.00 12.00 14.00 16.00 18.00 20.00 Q 1-2008 Q 3-2008 Q 1-2009 Q 3-2009 Q 1-2010 Q 3-2010 Q 1-2011 Q 3-2 01 1 Q 1-2012 Q 3-2012 Q 1-2013 Q 3-2013 Q 1-2014 Q 3-2014 Q 1-2015 Q 3-2015 Q 1-2016 Q 3-2016 Q 1-2017 Q 3-2017 Q 1-2018 Q 3-2018 Q 1-2019 Q 3-2019 Q 1-2020 $/MMBT U Time
until the years 1995 due to no major projects. Growth rate increased back in the late 90’s with the entry of Trinidad and especially Qatar as major producers (Pirrong 2014). However, it is not until the Japanese earthquake and tsunami in March 2011, which caused radiation leaks from the Fukushima nuclear power plant that demand for LNG increased significantly. In fact, the Japanese government shut down its nuclear power plants, and turned to produce its domestic electricity via natural gas (supplied almost entirely by LNG imports) and oil products. According to IEA, from 2010 to 2011, Japanese’s electricity made through nuclear energy fell by more than 60%, and by more than 84% from 2011 to 2012, all substituted by natural gas and oil products again. On the figure above, the Asian LNG spot price escalation from 2010 to 2011 is explained by Japan’s increase in LNG demand. Its volatility between 2011 and 2014 is featured by seasonal demand: gas is used for heating in winter and air cooling in summer. In 2014, the shale discovery in the US marks the beginning of an oversupplied market, prices move downwards. From 2016 to today’s Covid-19’s pandemic, prices between the Asian spot LNG benchmark and Henry Hub natural gas prices are starting to slightly move together (despite peaks for LNG). Such price correlation shows a gas market being more connected than it used to be, and since the worldwide pandemic and worldwide lockdowns, which have made demand for energy stuck, prices have been at a record low for both hubs.
2.10.2 Value chain
LNG is basically another method of transporting gas. The natural gas, made up of Methane (C1H4) gas is cooled to a temperature of -161.5°C (-260°F), turning the gas from a gaseous state to a liquid state, whose volume is 600 times smaller than its gaseous state. Turned into LNG, the gas can be stored and transported at cold temperature and at low pressure. It can be moved by ship, enabling access to remoted areas of the planet where no pipeline infrastructure exists or the construction of it is uneconomically feasible. From the import side, a called “regasification facility” is needed to heat the commodity back into its gaseous state, which will then be distributed to end users through pipelines (Chandra 2006).
Figure 8: LNG value chain
Source: Alom: LNG’s value chain challenges, 2018
The LNG value chain consists of five key areas:
- Production: starts with drilling and production (extraction) of gas from subsurface gas reservoirs. It has historically been dominated by national oil company (NOC) partnerships with international oil companies (IOCs)/(U.S Department of Energy 2018).
- Liquefaction: Once gas is extracted (called “feed gas” since it is still composed of other gases such as ethane, butane or propane), it is filtered and purified in facilities before being compressed to a liquid form, which can be easily transported in large volumes.
- Transportation: LNG carriers, specifically designed to keep gas in its liquid form, transport the LNG to a regasification facility. Despite ships being specifically designed, there is always some boil-off during transportation, the liquid gas evaporates, and loss of product occurs while transiting.
- Regasification: Once arrived at the destination point, the liquid gas is being re-gasified. The regasification occurs “on board” if the vessel is equipped with a regasification facility and then offloaded and stored at destination, or it can be
Distribution: Once re-gasified, gas can be consumed by domestic end-user and industries through a network of pipeline. It can also be transported and distributed by trucks (Alom 2018). Countries will need to assure the implementation of infrastructure (pipelines) required to derive maximum domestic benefits from the LNG value chain, including construction of power and gas infrastructure required for delivery to consumers (U.S Department of Energy 2018).
The LNG market become the “seaborne gas commodity”. Although a high investment is needed to enable pipeline construction, a high investment is also needed to build liquefaction and regasification facilities.
2.10.3 2019 Trade flows
Figure 9: Major LNG flows in 2019
Source: GIIGNL annual report 2020
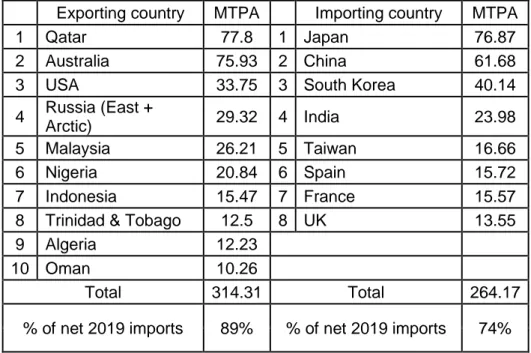
According to Table 1 below and Figure 9 above, ensuing form the 2020 GIIGNL annual report, which data is reported in millions tons of liquid gas for the year 2019, the top (net) importing and exporting countries are (importing or exporting more than 10 million cubic meters for the year 2019):
Table 1: Top LNG country exporting / importing in 2019
Exporting country MTPA Importing country MTPA
1 Qatar 77.8 1 Japan 76.87
2 Australia 75.93 2 China 61.68
3 USA 33.75 3 South Korea 40.14
4 Russia (East +
Arctic) 29.32 4 India 23.98
5 Malaysia 26.21 5 Taiwan 16.66
6 Nigeria 20.84 6 Spain 15.72
7 Indonesia 15.47 7 France 15.57
8 Trinidad & Tobago 12.5 8 UK 13.55
9 Algeria 12.23
10 Oman 10.26
Total 314.31 Total 264.17
% of net 2019 imports 89% % of net 2019 imports 74%
Source: Own computation, data from GIIGNL 2020 annual report
2.10.4 Energy conversion
A barrel of oil equivalent (BOE) or crude oil equivalent (COE) are terms used to enable comparison between energies. In fact, one barrel of oil equivalent is equivalent to the amount of energy found into a barrel of crude oil. A barrel of crude oil represents 42 gallons of oil, or 159 liters. In terms of energy, 1 barrel of oil is equivalent to approximately (because different grades of oil can have different energy equivalents) 5.8 million British Thermal Units (MBTUs), or 6’000 cubic feet of Natural Gas or 1’700 kilowatt-hours (kWh) of energy.
Figure 10: Conversion table
Figure 11: Energy vocabulary
Source: International Gas Union, 2020
2.10.5 LNG Incoterms
Incoterms are a set of international rules defining the obligations of a buyer and a seller. They become legally enforceable when incorporated in a contract (sales contract). Incoterms are published by the International Chamber of Commerce (ICC) which objectives are to promote open markets and trade prosperity. Within the LNG market, two Incoterms are mainly used, which are Free-on-board (FOB) and Delivered Ex-Ship (DES). According to 2020’s new incoterm version, under FOB, the seller has duty to provide and load the cargo at a loading port and bears all costs until such point otherwise stipulated in the sales contract. Such costs include gas production, liquefaction costs and all transportation cost until the merchandise is loaded on the ship. The delivery risk (merchandise risk) passes from seller to buyer at the loading port, when all the merchandise is fully loaded on the ship at the loading port. LNG FOB price will be the price of LNG at a loading port, merchandise shipped and ready to be moved (excluding shipping and regasification cost).
The DES incoterm is not referred anymore in the 2020’s Incoterm version, it expired in 2011, however, it is still widely used within the LNG trade industry. We could compare DES with DAP (Delivered at Place) today. The seller’s obligation is to bring the goods to a named destination port, goods unloaded. The seller bears the same cost as under an FOB contract, adding shipping cost. It is not the seller’s duty to offload (buyer’s duty) the ship and risk passes at this point when ship arrives at destination port. LNG DES price will be the price of LNG at destination port, goods unloaded.
2.10.6 Pricing of LNG
In contrast to crude oil, the LNG market does not have a harmonized global price, it is segmented into three regional market (Asia, Europe, Americas). LNG has historically been priced against crude oil since oil is an energy substitute to natural gas. In Asia, much of pricing was based on a percentage of the price of Japan Customs-cleared Crude
parts of Europe and North America have shifted to tie pricing against available natural gas indices. Henry Hub is the main index for America and NBP (National Balancing Point) for Europe.
In the US, until 1922, natural gas prices were controlled and fixed by its government. Then, following the Federal Energy Regulatory Commission (FERC) 636 order issuance, prices were decontrolled, and the industry moved to a market-based index for its pricing. Exchange-traded gas contracts were based on Henry Hub.
In Europe, the same trend happened in the UK, followed by the emergence of the National Balancing Point. Today, the Title Transfer Facility (TTF) has become an equal mechanism for long-term pricing. In Southern Europe, new natural gas hubs emerge, but the market is still transitioning to a mechanism of gas-on-gas pricing.
In Asia, it is not until 2010 that new pricing basis emerged. The JKM index (Japan Korean Marker) and the Singapore Gas Exchange (SGX) are intended to represent exchange-traded futures market for LNG based on gas around those geographical points (U.S Department of Energy 2018).
From an economist point of view, “gas-on-gas” pricing is a measure of the relative supply and demand in natural gas markets, and the more gas is priced so, the more established will be the way to set the appropriate market clearing price for a globally traded commodity (U.S Department of Energy 2018). In other words, the bigger the share of worldwide gas priced against gas hubs (going away from oil-linked price) the more precise and established the way to price gas on an international basis it will be.
In fact, the reason why the LNG industry pricing is not harmonized internationally is mainly because of its historical contractual and confidential pricing nature, lack of transparency of cargoes prices, which can make wide difference of prices even within the same country or region. LNG used to be priced on a long-term basis of 20-25 years, and results are that those LNG contracts are still in force today, and have by far different pricing structures which impact today’s market (U.S Department of Energy 2018). The reason for having contracted long-term contracts of 20-25 years were to secure heavy initial investments of liquefaction and regasification facilities.
3. Methodology
To have a “mature commodity market” comparison template, an empirical analysis on the oil market is to be reported, it will show how the oil derivative market started and evolved. The era of focus will be the time when the oil market started to be fragmented, such time characterized by the fall of the seven sisters, until today’s market shape (mature).
With regards to the physical side of LNG trading, an investigation of the evolution of the merchandise flow for the last ten years is to be conducted, data used will be mainly taken from annual GIIGNL and IGU reports from 2010 until 2020. This study will show how flows, liquefaction and regasification capacity, countries involved in such market have evolved since 2010. Projections and forecasts will be found in these annual reports, it includes liquefaction and regasification projects both being in construction and planned.
Without ships, the LNG market cannot have any liquidity since it is its unique way of transportation, a study of the evolution of the LNG shipping must be assessed. Data will be found in Clarkson’s research database, which is a globally trusted source of data for its accuracy and depth. The analysis will show how the LNG shipping industry has evolved, by computing the evolution of the average cargo size, the proportion of spot versus term charters, how many trade voyages had taken place annually. In other words, a statistical analysis of the ship industry. A correlation analysis will be exercised, the objective is to explain whether ship’s cargo capacity increases with time or not. A comparison is to be made with oil tankers.
To measure liquidity within an energy market, some liquidity indicators are to be analyzed to bring the final discussion and results of this paper. These indicators cited in paragraph “Liquidity indicators” will be investigated. The first indicator will be to evaluate the volume of transactions made in 2019 and to compare with previous year such volumes. A high trading volume of a commodity leads to high level of liquidity in this precise commodity market, or at least a positive evolution of trade volume since the last ten years means that the market is moving towards being more developed.
The churn rate, which is a ratio defining the proportion of paper trade to physical trade, completes the first indicator in terms of liquidity analysis and shows whether the market
ideal quantity of data that should be found should be to at least find churn rates for the last past couple of years on the JKM benchmark. These churn rates found will be compared with some of the oil market and different natural gas hubs worldwide (Henry Hub in the US, NBP and TTF in Europe).
Transaction costs on the market will be analyzed through the study of bid-ask spreads, which is the difference between the maximum price the market is willing to buy and the minimum price at which the market is willing to sell. Such data, thought very delicate to find, is relied on any company agreeing to share any of it, even though it might be few, a piece of it will bring an overview. These indicators will be compared to the oil market, and natural gas hubs cited.
The last indicator, the time of transaction carried out will not be taken into consideration as being thought not to be of commercial sense for this paper.
Finally, to bring a fresh and professional insight into the paper, a professional point of view and expertise, and to narrow down to firm level what are the effects, opportunities and issues of such liquidity measurement in the LNG market, interviews are to be conducted. The focus is to reach any professional involved in LNG trading, energy liquidity.
4. Results
4.1 The oil market template
4.1.1 From a vertically integrated oil market to an active spot trading
Figure 12: Crude oil price history
Source: Pankratyeva, 2019)
The oil commodity market is considered as a mature market. From the beginning of the years 1900s, the price of the commodity remained quite stable until the 1970s. In fact, the market was dominated by the so called “Seven-Sisters”, which were the seven world oil industry companies (Exxon, Mobil, Texaco, SoCal which is now Chevron, Gulf, Royal Dutch/Shell, and British Petroleum) having near full control (direct ownership) on the oil industry (derekbarry 2015; Parsons 2017). These companies were vertically integrated (control on drilling, production, transportation, refining and marketing) and operated under high margin and under long-term contract, the latter having the consequences to create few volatilities in market price. From the years 1970s to 1980s, a more global market of oil developed, governments from producing countries started to nationalize
10 years, their global control on oil fell by at least half, and such control was replaced by “a large number of medium sized oil companies, producing-country oil companies, consuming-country oil companies and traders”, according to Parsons paper, which cites Per Vegler (1987, p.168) as the finder of the results (Parsons 2017). The effects of such disruption were that the oil industry structure started to change drastically, with more competition and trade, and the development of spot trading. In the US, the industry quickly shifted from federal and state regulations to a more liberalized market, promoting an active spot market (the country decontrolled all prices in crude oil and crude products in 1981).
The growth of spot market trades was linked to a time when sources for price data exploded and was followed by a competition to access and deliver data on prices. In Shapiro’s article and according to Saudi oil minister and head of OPEC Sheikh Yamani at that time, OPEC fixed price but these were higher than the spot market price, and oil companies operating under long-term contract moved to the spot market (Shapiro 2009). Within this global changing context for the oil industry, the creation of the Brent oil benchmark, a market associated with the European North Sea oil fields is to be noted. Although a substantial amount of oil was known to be there and discovered before, it is not before the price hikes of 1974 that the development of such market made it profitable. This new flow of crude oil competed with OPEC’s production (Parsons 2017).
The emergence of spot pricing enabled the industry to be more transparent in terms of pricing, oil prices could be set by supply and demand rather than by the intermediation of a pricing organization which was at that time OPEC, according to Mr. Shapiro researches.
With new players coming into the market, less long-term contracts were contracted, and price volatility started to rise. Once volatility price came in the market, a way to mitigate price risk had to be managed.
4.1.2 Derivatives growth
Because of the oil shocks of 1973 and 1979, oil majors companies moved away from fixed contracts, which led to more spot pricing, which in turn is a prerequisite for futures trade.
According to the magazine article written by John Shapiro in 2009, he explains that the beginning of the oil derivative market, which can be said to be the beginning of price risk coverage for the transportation of the oil commodity from one geographical point to another, began with the introduction of the crude oil contract on the New York Mercantile . “Liquidity was very low and so as you tried to monetize a
pricing mismatch, you had a bid/ask problem on top of the forward curve shape”. Some years later, a way to manage price risk was found, which is the very first derivative that emerged: CFD’s (contract for differences).
According to John Parsons’s paper, it is after fails attempt to create futures contracts that came a successful futures contract. It started with a propane contract in 1971 but was not very successful at first, then failed attempt to establish a crude oil futures contract with delivery in Oklahoma and another failed attempted for a crude oil futures delivery in Rotterdam. The first contract that successfully started was NYMEX’s futures contract on heating oil delivered into New York Harbor in 1978. This was followed by NYMEX’s establishment of the WTI crude oil futures contract in 1983. History shows, and also according to the US Energy Information Administration (EIA 2002) that once a successful contract is established, the number of futures contracts annually traded can increase drastically and in only a short time. For instance, at its launch, the WTI futures contract averaged less than 1’000 contracts daily (a thousand lots represented already a million barrels at that time) and by the fifth year since its introduction, the average daily contracts grew by 18 times.
Meanwhile, another futures contract emerged in the North Sea (Brent), and around the years 1983 and 1984, the called “granddaddy” of all modern OTC markets grew: the Brent 15-day market, which was working by leaving the buyer a minimum of 15 days notice of the intended loading dates for a 600’000 barrels cargo of oil. However, the nature of the market made it difficult for small and medium companies to do business (Shapiro 2009).
Although the Brent benchmark was more used compared to WTI, the IPE (International Petroleum Exchange) failed couple of times to introduce successful futures contract. It is not before 1988 that IPE went a further by establishing a “real” (marking to market, margining, central clearing…) futures contract for Brent (Shapiro 2009), a cash settled contract (Parsons 2017) In fact, due to the composition of the physical market at that time, a delivered contract was difficult to introduce and failed.
At that time, spot markets, transparent price indexes and a variety of buyers and sellers were there but the only thing lacking was the financial investment from banks and others to support the growth of such market. The next step was Morgan Stanley Bank which introduced energy options. Also, it developed the “partial” Brent contracts by allowing to deal smaller contract sizes, a feature that should have made liquidity growing for Brent
until the first Gulf War of 1990 when oil prices increased by more than 200% in a couple of months. Companies that had contracted fixed price with consumers had hedged their exposures but those that did not made painful losses. Mr Crosley explains that he managed to understand the exposure right before the war and hedged his jet fuel exposure using IPE gas oil futures and then OTC jet swaps. He adds that he made the calculations of losses without having hedged this way and concluded that it would have been very painful.
The next step, in terms of liquidity in trading derivatives happened when banks such as “Bankers Trust” and “Credit Lyonnais” came into business, which leveraged the futures clearing mechanism, and which became essential provider of liquidity and risk transfer to the oil market. By 1994, the market was more focused on settlement risk and credit risk more than ever before (Shapiro 2009).
Today, crude oil futures trade is largely dominated by WTU and Brent contracts. The exchanges (NYMEX for WTU and ICE for Brent now) offer a duplicate contract of the other exchange: NYMEX offers a Brent contract tied to the price on the ICE exchange and vice versa. Other futures contract exists but are less significant and not in the scope of this thesis.
The figure below show the total open interest in three types of crude oil (WTI lumps open interest on NYMEX’s WTI contract and open interest on ICE’s duplicate WTI contract; Brent lumps open interest on ICE’s Brent contract and open interest on NYMEX’s duplicate Brent contract).
Figure 13: Total open interest for all futures contracts in three types of crude oil
Source: Parsons, 2017
Additionally to the exchange-traded futures and options on crude oil and its refined products, there is also an OTC derivative market. Since the Dodd-Frank Act in the US after the 2010 crisis and related legislation in other countries, many transactions had to be reported to national regulatory (the US Commodity Futures Trading Commission). According to a report from economists at the CFTC (Mixon, Onur & Riggs 2016), data shows that the two markets (exchange and OTC) have similarities and differences but have the same level of maturities. Regarding the WTI market, the open interest of commercial end-users is more heavily weighted to the OTC market whereas the financial end-users is more weighted to the futures and options market.
According to Parson’s documentation and writing, with the establishment of liquid trade in futures contracts, price discovery moved from spot market to the futures market. In 2016, roughly 78% of the open interest was concentrated in maturities of less than a year, 16% of the open interest in maturities of 1-2 years, 4% in maturities of 2-3 years,
4.2 Size of the physical LNG market compared to oil sea-borne
trade
Figure 14: LNG volume imports vs transport volume of crude oil in global sea-borne trade
Source: Own computation, data from Statista 2020 and GIIGNL annual reports (2010-2020)
The LNG data found in GIIGNL reports from 2010 to 2020 have been converted from million tons of LNG into millions of tons of oil equivalent, using a ratio of 1.169, according to BP’s energy conversion. It enables energy equivalent comparison. In 2010, the LNG physical market represented 13.79% of the total of oil traded through sea-borne trade. Such ratio kept growing to finally reach 18% in 2018. No data have been found for the volume of oil sea-borne traded in 2019. By supposing that in 2019, the same volume of oil was traded than in 2018, such ratio would be over 20%, taking 2019’s LNG’s data (415 million tons of oil equivalent). The graph was built to show the size of both markets transported at sea. It can be concluded that LNG is growing more rapidly than oil traded on waterways during the last decade. Within this time, the biggest increase in terms of ratio is between 2016 and 2020, where the ratio of LNG volume traded to oil traded at sea went from 15.81% in 2016, to 18% in 2018, to finally 20.35% in 2019.
1 867 1 857 1 906 1 836 1 803 1 872 1 949 1 999 2 038 257 281 276 277 280 287 308 339 367 0.00% 2.00% 4.00% 6.00% 8.00% 10.00% 12.00% 14.00% 16.00% 18.00% 20.00% 500 1 000 1 500 2 000 2 500 2 010 2 011 2 012 2 013 2 014 2 015 2 016 2 017 2 018 % L N G v o lu m e to se a-b o rn e cru d e o il v o lu m e Milli o n t o n n es o il e q u iv alent Years
4.2.1 An increasing number of countries involved in the LNG market
Figure 15: Evolution of the number of countries involved in LNG
Source: Own computation, data from GIIGNL annual reports (2011-2020)
The overall countries involved in LNG is increasing. In 2011, 25 countries were considered importers and 18 countries considered importing. By 2016, 39 countries were considered importers and 19 exporters. Clearly, more country become new exporter than new importer during this time lag. In 2017, Malta joins the market as importer. In 2018, Bangladesh and Panama accounts as new importer and Cameroun as new exporter. In 2019, Argentina started to export LNG. It is interesting to notify that new countries involved are emerging countries.
4.2.2 Where has been most of LNG demanded, and supplied from?
The trade flow chart in the literature review illustrates flows in 2019. During the last decade, a little less than 75% of yearly total imports were demanded and delivered to Asia globally. Regarding the supply side, the Middle East was and is still the major exporter of LNG. In 2013, the Pacific Basin (Asia) supplied 37% of total imports, and such share has been growing year-on-year and was of 41% in 2019. Europe has been a supply and demand player within the decade.0 10 20 30 40 50 60 70 2011 2012 2013 2014 2015 2016 2017 2018 2019 N u m b er o f co u n tries Years
4.2.3 Growing share of LNG traded on spot
Figure 16: Share of spot & short-term vs total LNG trade
Source: GIIGNL annual report 2020
Short-term trades are term contract trades with duration of 4 years or less. It means that the real ratio of spot trades is lower than the one calculated by GIIGNL. In 2010, a little more than 30 MT (million tons) of LNG were traded on spot and short-term, representing roughly 14% of total LNG imported (220 MT) in 2010. In 2011, the amount of LNG traded on spot and short term doubled, with 61.2 MT, representing 25% of total LNG imports in 2011. From 2012 to 2017, this share remained quite stable, averaging 27%, but a substantial increase occurred in 2018 (32%) followed by a further increase in 2019 (34%). It is only for the years 2017, 2018 and 2019 that data on truly LNG traded on spot can be found is these reports, this share was of 20%, 25% and 27% respectively. It represents 57.96 MT of LNG for 2017, 78.45MT for 2018 and 95.8 MT in 2019.