Publisher’s version / Version de l'éditeur:
Vous avez des questions? Nous pouvons vous aider. Pour communiquer directement avec un auteur, consultez la première page de la revue dans laquelle son article a été publié afin de trouver ses coordonnées. Si vous n’arrivez pas à les repérer, communiquez avec nous à [email protected].
Questions? Contact the NRC Publications Archive team at
[email protected]. If you wish to email the authors directly, please see the first page of the publication for their contact information.
https://publications-cnrc.canada.ca/fra/droits
L’accès à ce site Web et l’utilisation de son contenu sont assujettis aux conditions présentées dans le site LISEZ CES CONDITIONS ATTENTIVEMENT AVANT D’UTILISER CE SITE WEB.
Proceedings of the Joint NSC-NRC Workshop on Construction Technologies: 26
April 2004, Taipei, Taiwan, pp. 57-68, 2004-04-01
READ THESE TERMS AND CONDITIONS CAREFULLY BEFORE USING THIS WEBSITE. https://nrc-publications.canada.ca/eng/copyright
NRC Publications Archive Record / Notice des Archives des publications du CNRC :
https://nrc-publications.canada.ca/eng/view/object/?id=0ef65d58-3231-403e-9f8f-4be6f9dae710 https://publications-cnrc.canada.ca/fra/voir/objet/?id=0ef65d58-3231-403e-9f8f-4be6f9dae710
NRC Publications Archive
Archives des publications du CNRC
This publication could be one of several versions: author’s original, accepted manuscript or the publisher’s version. / La version de cette publication peut être l’une des suivantes : la version prépublication de l’auteur, la version acceptée du manuscrit ou la version de l’éditeur.
Access and use of this website and the material on it are subject to the Terms and Conditions set forth at
Condition assessment of structural components using non-destructive
techniques
Condition assessment of structural components using
non-destructive techniques
Pernica, G.; Glazer, R.; Salloum, T.; Chan, G.;
Law, T.; Wiseman, A.
NRCC-47059
A version of this document is published in / Une version de ce document se trouve dans :
Proceedings of the Joint NSC-NRC Workshop on Construction
Technologies, Taipei, Taiwan, April 26-27, 2004, pp. 57-68
CONDITION ASSESSMENT OF STRUCTURAL COMPONENTS USING
NON-DESTRUCTIVE TECHNIQUES
Gerry PERNICA1, Rock GLAZER2, Tareq SALLOUM3, Gordon CHAN4, Tim LAW5 and Allan WISEMAN6
ABSTRACT
Condition assessment of components is an important aspect for determining repair strategies of ageing structural systems and for ascertaining the durability of the repairs once they are effected. Two projects have been undertaken by the “Concrete Materials and Structural Technologies Group” at the Institute for Research in Construction of the National Research Council Canada for studying both aspects of repairs. The first project is investigating the effectiveness of a sonic wave technique in accurately determining the in-situ length of newly installed soil nails. Once soil nails are inserted into the ground, their length can only be readily verified by destructively removing them. This project examines the efficacy of using the impulse-response technique to ascertain the length of grouted and ungrouted soil nails containing one or more coupled sections of steel bars.
The second project is studying the effect of a fibre-reinforced polymer (FRP) laminate on the internal conditions of a steel reinforced concrete column. Two adjacent columns, one wrapped with a FRP laminate and the second left in its existing condition have been monitored over a period of many years. The monitoring comprises annual non-destructive sonic and electro-chemical surveys and continuous on-site recording of relative humidities and temperatures. The objective of the study is to determine whether the laminate affects the internal electro-chemical environment within the wrapped column so as to reduce the durability of the primary steel reinforcement. This paper gives a brief overview of the two projects and summarises what has been learned to date.
Keywords: soil nail, nondestructive techniques, impulse response, FRP laminate, condition monitoring.
BACKGROUND FOR SOIL NAIL STUDY
Soil nailing is an in-situ soil reinforcement technique for cut-slope retaining and slope stabilization systems. It has been an alternative technique to other conventional supporting systems as it offers flexibility, rapid construction and competitive costs. As a result, a tremendous number of soil nails are installed worldwide every year. Because nails can be rapidly inserted into a slope (up to 10 per hour), satisfactory quality control of the nailing technique has been difficult to achieve in some jurisdictions. A fast, reliable non-destructive field technique has therefore been sought to satisfy the requirement for comprehensive quality control of soil nailing systems.
The first half of this paper presents the study being conducted at the Institute for Research in Construction (IRC) of the National Research Council Canada (NRC) to adapt (if possible) the impulse-response (IR) technique into a procedure that can accurately estimate the length of in-situ soil nails. The initial part of the study comprised experimental tests in which, 4-m long laboratory and in-ground soil nails were constructed and tested using the IR technique. Finite element models (FEMs) of the laboratory and in-ground nails were also developed and calibrated by comparing the numerical set of longitudinal natural frequencies with those obtained
1 Research Officer, Institute for Research in Construction, National Research Council Canada, e-mail: [email protected] 2
Technical Officer, Institute for Research in Construction, National Research Council Canada, e-mail: [email protected] 3 Graduate Student, Dept. of Civil and Environmental Engineering, Carleton University, Canada, e-mail: [email protected] 4 Technical Officer, Institute for Research in Construction, National Research Council Canada, e-mail: [email protected] 5 Professor, Dept. of Civil and Environmental Engineering, Carleton University, Ottawa, Canada, e-mail: [email protected] 6 Engineer, Public Works and Government Services Canada, Ottawa, Canada, e-mail: [email protected]
experimentally. The models were then used to obtain the dynamic response of the nails to actual impacts so that the efficacy and suitability of the IR technique in estimating the length of soil nails from their modal frequencies could be judged. However, only the experimental portion of this study is presented within this paper. Information on the development and calibration of the FEMs is given in Salloum (2003).
EXPERIMENTAL PROGRAM Principals of Impulse-Response Technique
The IR technique is a non-destructive sonic method, which is generally used to determine the dynamic properties (frequencies, damping ratios and mode shapes) of structural systems. The technique consists principally of two stages; striking the system being tested with a mechanical device such as a hammer and then monitoring the response by attaching a motion sensor to the system. The impact (force) produced by the mechanical device is transient (short duration). It induces stress waves, which reflect back and forth within the structural system between boundary interfaces until the energy is consumed by material damping, dispersion and reflections. Description of Soil Nails
One in-ground and four laboratory soil nails were built and tested using the IR technique. The laboratory nails
were assembled and housed in a large structures laboratory at NRC/IRC (Fig.1). Three of the laboratory nails
were constructed using a single steel bar surrounded by a cover of normal strength concrete. The bar was 4.03 m long and 28.5 mm in diameter. The concrete cover had a 152-mm square cross-section and a 20-MPa compressive strength. The fourth nail, however, had only one constituent, the steel bar.
Figure 1. Laboratory Soil Nails at NRC/IRC Figure 2. Impact Delivery and Sensor Attachment
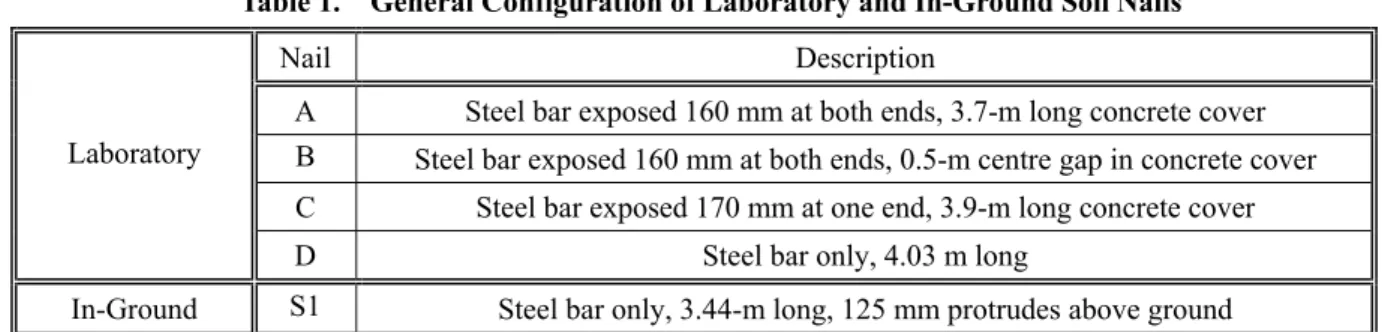
The in-ground nail was installed vertically on the NRC campus in Ottawa, Ontario. The nail consisted simply of a steel bar, 25-mm in diameter and 3.44-m long, which had been carefully driven into the ground. The ground consisted of a deep layer of soft clay topped by a thin layer of surface vegetation. Table 1 briefly notes the general configuration of the laboratory and in-ground soil nails.
Table 1. General Configuration of Laboratory and In-Ground Soil Nails
Nail Description
A Steel bar exposed 160 mm at both ends, 3.7-m long concrete cover
B Steel bar exposed 160 mm at both ends, 0.5-m centre gap in concrete cover
C Steel bar exposed 170 mm at one end, 3.9-m long concrete cover
Laboratory
D Steel bar only, 4.03 m long
Instrumentation
Hammers: Different sizes of hammers producing forces with various frequency contents were used to impact
the laboratory and in-ground soil nails at NRC/IRC. Each hammer was equipped with a force transducer to capture the force induced by the impact. The instrumented hammers ranged in weight (0.3-4 kg) and each came equipped with a variety of impact heads (steel, plastic or rubber). By varying both the hammer size and impact head, the duration and amplitude of the impact force could be controlled.
Sensor: To monitor the response induced by the impact, a motion sensor, for this procedure an
accelerometer, was attached to the exposed end of the steel bar in each nail. The accelerometer was mounted with its axis of sensitivity aligned with the longitudinal axis of the nail, because only the axial response of the nail was of interest. Various types of piezo-electric accelerometers were tried in the study. The accelerometers, all of which had similar physical dimensions but a range in dynamic response characteristics, were selected because of their broadband frequency (minimum 20 kHz) and full-scale acceleration ranges (minimum 500 g).
Frequency Analyser: Signals from the instrumented hammer and accelerometer were fed into a 2-channel
frequency analyser with signal storage capabilities. The analyser had the ability to display the waveforms generated by the impacts and the frequency spectra (Fourier transforms and transfer functions) derived from the time signals using algorithms built into the analyser.
Experimental Procedure
Impact Delivery: Exciting the soil nail was simply accomplished by impacting the exposed end of the steel bar
perpendicular to its surface, as only the axial response of the nail was of interest.
Accelerometer Attachment: The bottom of each accelerometer came with a screw, which was screwed into a
small steel prism. The prism, in turn, was attached with a screw to the side of the steel bar. This attachment scheme resulted from observed inadequacies in other mounting techniques, which had been evaluated in a series of earlier tests on the laboratory and in-ground nails (Pernica et al. 2002).
Figure 2 depicts both the technique used to excite the axial response of the nail and the attachment device (about 150 mm from the impacted end) connecting the accelerometer to the side of the steel bar.
Frequency Range of Analyser: The frequency range of the analyser was initially set to either 5 kHz or 10 kHz
for all nails, because only the higher modes of the soil nail system, which were thought to be primarily associated with the response of the steel bar, were of interest. However, that assumption turned out to be incorrect for composite nails. Modal frequencies below 10 kHz within the induced stress wave were not mainly restricted to the bar but travelled within the complete composite nail system (steel bar and concrete cover). Therefore, the frequency range finally chosen for tests on the composite lab nails was 2 kHz to better capture the lower modal responses of these nails, which were now desired.
Analysing the time signals in the frequency domain focuses on identifying the dominant modal frequencies within the stress waves, as the waves reflect primarily between the two ends (head and toe) of the nail. At frequencies, which correspond to the resonances of the nail system, reflections are maximum. The resonant
frequencies are thus a function of nail length (L) and the composite longitudinal wave velocity (Vc) associated
with the two nail components. By determining the frequency spacing between resonant frequencies and knowing the wave velocity, the length of a nail can be estimated from the following relationship (Malhotra and Carino 1991):
f
V
L
c∆
=
2
(1) EXPERIMENTAL RESULTS Experimental results for just three of the nails are given in this paper.Soil Nail D (Laboratory – Steel Bar Only)
Figures 3 and 4 show the Fourier transforms of the force and response induced in Nail D using a small instrumented hammer with a steel head. Numerous spectral peaks, which correspond to the resonant frequencies of the steel bar, can readily be identified in the response spectrum (Fig. 4).
The constant frequency spacing between the lowest spectral peaks (about 637 Hz), coupled with the known mode shapes for these simple bar modes (Clough and Penzien 1975), suggested that these modal components travelled at about the same velocity (phase velocity) as that of the wave. As the longitudinal wave velocity of the steel bar from actual time-of-travel measurements was about 5100 m/s, the length of the nail can be estimated at about 4.0 m from Equation (1). Force Spectrum 0 1 2 3 4 5 6 7 8 0 2000 4000 6000 8000 10000 Frequency [Hz] A m plit ude Response Spectrum 0 20 40 60 80 100 120 140 0 2000 4000 6000 8000 10000 Frequency [Hz] A m p lit u d e 625 1275 1900 25503175
Figure 3. FFT of Hammer-Induced Force Figure 4. FFT of Soil Nail D Response
Soil Nail A (Laboratory - Uniform Concrete Cover)
Figures 5 and 6 show the Fourier transforms of the force and the response induced in Soil Nail A using the medium instrumented hammer equipped with a stiff plastic head. It can be seen in Figure 6 that the first resonance occurred at about 0 Hz. It arose because Soil Nail A was not directly supported in the axial direction but simply rested on the floor slab of the structures laboratory (Davis et al. 1974).
Force Spectrum 0 5 10 15 20 25 30 35 40 0 500 1000 1500 2000 Frequency [HZ] Am p lit u d e Response Spectrum 0 5 10 15 20 25 0 500 1000 1500 2000 Frequency [Hz] A m p lit ude 250 485 685845 1080
Figure 5. FFT of Hammer-Induced Force Figure 6. FFT of Soil Nail A Response
Also seen in Figure 6, are five successive spectral peaks (below 1.5 kHz) with frequency intervals ranging from 160–235 Hz. The breadth of these peaks indicated that a high amount of damping was present in the nail whereas their frequencies suggested that the concrete cover had mechanical properties well below those anticipated for 20-MPa concrete. Both the fundamental frequency and frequency intervals between modes were considerably less than the anticipated minimum (about 375 Hz for a wave velocity of 3000 m/s). In fact, the frequency content gave rise to a composite wave velocity slightly below 2000 m/s for the 4-m nail. This extremely low wave velocity combined with the high amount of modal damping reinforced the suspicion, that visible transverse cracks in the concrete cover had substantially affected the mechanical properties of the composite nail. The variable frequency spacing of the peaks also implied that the phase velocities of the modal components within the longitudinal stress wave varied with frequency.
Verification of the phase velocity phenomenon was accomplished by performing additional experimental tests using cross-correlation and cross-spectral techniques (Magrab and Blomquist 1971). Results showed that there was a drop in phase velocity as the modal frequency increased. The drop was also corroborated numerically using the developed FEMs by verifying both the mode shapes and wavelengths that had earlier been assumed for each of the modes of vibration.
Estimating the length of a soil nail that possesses varying phase velocities was a challenging endeavour in a laboratory setting. In the field, that task would be insurmountable, as there would be no way of determining phase velocities with only one end of the nail being accessible.
Soil Nail S1 (In-Ground – Steel Bar Only)
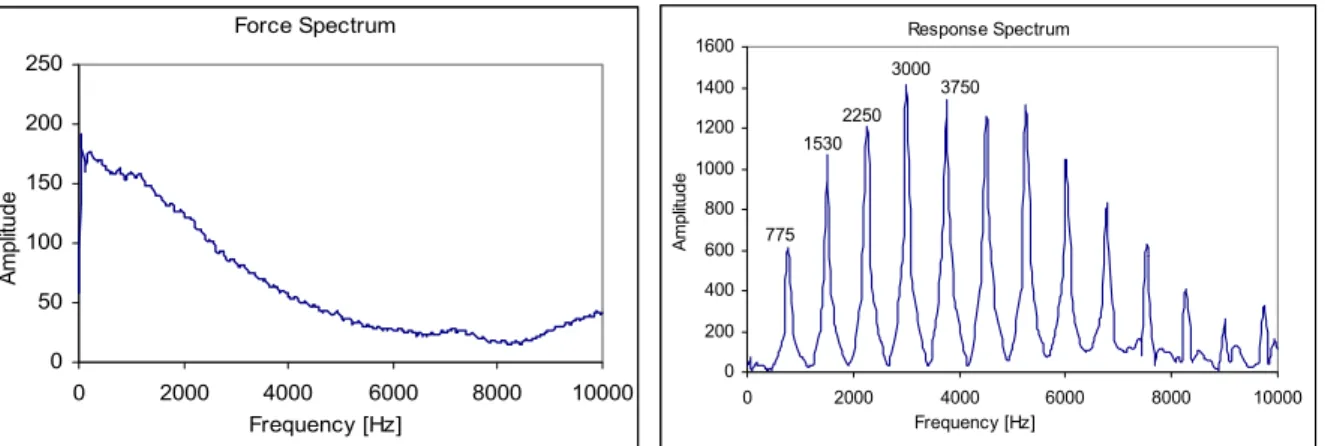
Figures 7 and 8 show the frequency spectra of the force and the response induced in Soil Nail S1 using the medium instrumented hammer equipped with a steel head. For this nail, the force produced by the hammer (Fig. 7) had sufficient energy above 5 kHz to excite many of the higher modes of the ground-embedded bar. Numerous modal peaks are well defined in the response spectrum of this simple nail. The 775-Hz fundamental frequency and frequency spacing of the modes corresponded well with the actual length (3.44 m) of the nail (steel bar), assuming a longitudinal wave velocity in the steel bar of about 5100 m/s.
Force Spectrum 0 50 100 150 200 250 0 2000 4000 6000 8000 10000 Frequency [Hz] A m pl itude Response Spectrum 0 200 400 600 800 1000 1200 1400 1600 0 2000 4000 6000 8000 10000 Frequency [Hz] A mpl itud e 775 1530 2250 3000 3750
Figure 7. FFT of Hammer-Induced Force Figure 8. FFT of Soil Nail S1 Response
CONCLUSIONS
1) The mechanical properties of the concrete cover in the composite laboratory nails tested at NRC/IRC effectively controlled the properties of the induced longitudinal waves. Cracks in the concrete cover of these nails significantly altered their expected modal properties.
2) Stress waves induced in the laboratory soil nails with cracked concrete covers may contain modal components, which possess different phase velocities. For Soil Nail A, the phase velocity of the lowest four modes decreased as the modal frequency increased. The decrease in frequency spacing of the lower modes was indicative of the variability of the phase velocity and its decrease with increasing modal frequency. In keeping with the poor condition of the concrete covers, wave velocities in the three composite laboratory nails were below 2000 m/s, considerably below that anticipated for normal strength concrete.
3) The medium instrumented hammer equipped with the stiff plastic head produced impacts best suited for determining the dynamic properties of the short (about 4-m long) composite laboratory nails. The impacts contained sufficient energy to excite most modes below 2 kHz. On the other hand, the small or medium instrumented hammer equipped with the steel head produced impacts best suited for determining the dynamic properties of the simple (steel bar only) laboratory and in-ground nails. These impacts contained sufficient energy to excite modes to 10 kHz.
4) A favourable estimate of nail length can be made for short composite nails using the frequencies of the lowest few modes. However, establishing a suitable wave velocity in nails with deteriorated concrete covers will be the key for obtaining an accurate estimate of nail length.
5) Determining the phase velocities in composite laboratory nails with deteriorated concrete covers was an extremely onerous task. The IR technique may thus be inappropriate as a stand-alone procedure for determining the length of in-ground composite nails with substantial variability in the grout covers. Using the IR technique in conjunction with suitable FEMs may lead to a better understanding of the response of composite nails and thus prove to be a useful combination for estimating the length of grouted in-ground nails.
BACKGROUND FOR FRP LAMINATE STUDY
Fibre-reinforced polymer (FRP) laminates are being used more often to repair, rehabilitate and upgrade concrete beams and columns. The laminates are composed of high-strength fibres and a polymer, generally an epoxy resin. The fibres, usually glass, aramid or carbon, are made into continuous sheets of woven fabric about 0.5 m wide. The fibres are generally woven unidirectionally with cross-weave polyester threads holding the strands of high-strength fibres together. The sheets are cut onsite to custom fit the member, impregnated with resin and then applied with rollers and brushes to the surface of the concrete member. The resin, the polymer component of the laminate, performs several functions, which include
• holding/binding the threads together so that the entire fabric sheet acts and behaves as a single component
• attaching the sheet to the concrete member
• protecting the fibres in the sheet by forming an tough, impermeable layer.
Laminates form a non-corroding, lightweight material with very high strength-to-weight and stiffness-to-weight ratios. The use of these composite materials has increased because they tend to be a cost-effective technique for repairing and improving the performance of concrete members. The laminates
• protect the concrete from corrosive environments by forming an impermeable surface layer
• confine the concrete and thereby increase the ultimate strength of columns
• increase member load capacity by acting as additional tensile reinforcement.
However, because the laminates are impermeable, they will affect the movement of gases, moisture and ions within the sections of concrete they cover. What effect this impermeability has on conditions within the concrete core is unknown. Questions posed by the engineering community and owners and operators of infrastructure facilities have focused on this issue and on the durability of the laminate.
• Do the laminates alter the properties of the concrete or the chemical environment within the concrete, which
is critical to the survival of the steel reinforcing?
• How well and for how long do the laminates stayed bonded to repaired and sound concrete surfaces?
• How resistant are the laminates to the environmental and climatic conditions found in Canada?
In response to these questions, a multi-year study to obtain some answers was undertaken by the Institute for Research in Construction (IRC) of the National Research Council Canada (NRC) in partnership with Public Works and Government Services Canada (PWGSC) and Autocon Composites Inc., the industrial supplier of the FRP products (Tonen Corporation) used in the study.
DESCRIPTION OF COLUMNS
A pair of columns, located inside a heated underground parking garage, were selected for the study. The garage, situated beneath two major roadway arterials, forms part of a high-rise government complex situated in the downtown section of Gatineau, Quebec. The underground garage was built in the early 1970s and comprises a reinforced concrete structure, with one-way slabs supported on precast, prestressed beams and beams supported on cast-in-place girders and columns. The multi-level garage is divided into numerous structures by a system of expansion joints. The column pair, consisting of nearly identical 620-mm square columns, is located at one end of the garage on the first level below grade.
The columns, about 2.3 m in height and about 200 mm apart, straddle an expansion joint (Fig. 9). They are situated about 20 m from entrance and exit ramps to the overhead arterial and are heavily reinforced, as they support the garage roof and the roadway with its vehicular traffic. During the past decade (1990s), the garage underwent numerous conventional repairs to its slabs and columns, which had sustained corrosion damage from the effects of winter deicing salts. Two sources of salt contributed to the damage; that carried into the heated
garage in snow attached to the undercarriage of cars and that leaked into the garage from the overhead roadways through deteriorated expansion joints.
In December 1995 about six months following major repairs to the columns, slabs and expansion joints, one of the columns (designated as Column 2) was completely wrapped with a double layer of CFRP sheets. The fabric sheets were applied orthogonal to each other with the carbon fibres of the first sheet being placed in the circumferential direction around the column. The work was performed by a qualified contractor using wet lay-up procedures recommended by the manufacturer. Additional information on the column pair including reasons for selecting Column 2 for the application of the laminate and the procedure for applying the laminate are given in a progress report to PWGSC (Pernica et al. 1999).
Figure 9. Pair of Concrete Columns in Underground Parking Garage Selected for FRP Laminate Study
DESCRIPTION OF FRP LAMINATE
The following three products from Tonen Corporation comprised the laminate that was applied to Column 2:
• carbon fabric, Grade FTS-C1-20
• epoxy primer, Grade FP-NS, Type Standard
• epoxy resin, FR-E3P, Type Standard
The sheets, which came in rolls 0.5 m wide, was cut onsite with scissors to the correct length and then applied to the column using the recommended procedure. Eight sheets of fabric, each about 1.4-m long, were required for the first layer and five sheets each about 2.1-m long for the second layer. A 100-mm overlap was used for forming joints perpendicular to the direction of the fibres and a 10- to 20-mm overlap for joints parallel to the direction of the fibres. The top layer of the epoxy saturant was not covered by a topcoat but was left exposed.
During the 30-hour installation period, the temperature in the parking garage ranged between 10°C and 15°C.
MONITORING PROGRAM Concrete Cores
Prior to the wrap being applied to Column 2, 63-mm diameter cores were removed from the columns to obtain the following properties of the concrete:
• variation of chloride ion concentration with surface depth
• moisture content
• air-void content
• aggregate type and size.
Cores ranging from 50-75 mm in depth were taken from the top, middle and bottom portions of each column to determine the variation of these properties with column height. Only locations containing original concrete were considered. Areas repaired with patching materials were avoided. Cores will again be taken at the end
of the study to determine if changes have occurred in the moisture content and chloride ion concentration with depth as a result of the addition of the laminate.
Annual Surveys
Prior to the laminate being applied to Column 2, several surveys were conducted on each column to determine the existing conditions at the start of the multi-year study. The surveys comprised a set of non-destructive tests (sonic and electro-chemical) at grid points established on each column. The rectangular grid comprised two centrally spaced vertical lines, 205-mm apart, on each column side (Fig. 10) and a set of seven horizontal lines at 305-mm intervals. The horizontal grid began about 305 mm above the garage floor and the vertical grid at 205 mm from either column face. Following the application of the laminate, sonic surveys were retaken on Column 2 to obtain the new baseline with the laminate in place. At the end of each study year (towards the end of February), the entire set of non-destructive tests was repeated on each column. Because the laminate formed an impermeable membrane, the annual electro-chemical measurements (ASTM C 876-91) were conducted only on Column 1. They thus served solely as an indicator of electro-chemical changes wrought by conditions within the heated garage on uncovered concrete members.
Through-transmission pulse velocity measurements between various combinations of grid points on opposite sides of the two columns were performed using a pair of 54-kHz transducers attached to a Pundit ultrasonic unit (ASTM C597 – 97).
← Column 2 (Wrapped Column)
← Expansion Joint
← Column 1 (Unwrapped Column)
a b c d e f g h 2 a b c d e f g h 1
Figure 10. Layout of Vertical Grid Lines on Concrete Columns in Underground Parking Garage Onsite Monitoring
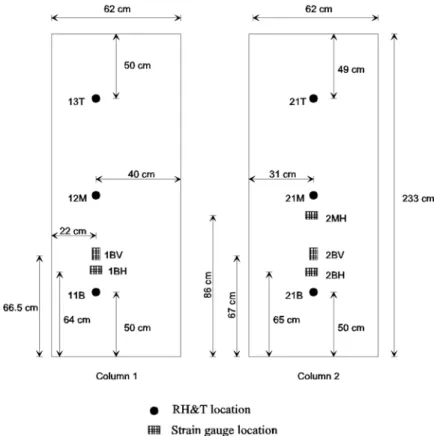
An onsite data acquisition system, comprising a multi-channel data recorder and an array of relative humidity and temperature (RH&T) sensors and strain gauges (Fig. 11), was installed at the start of the project to monitor the performance of the two columns during the multi-year study. The battery-powered recorder was connected to line power to recharge the batteries and to a telephone line for transferring data via modem. Signals from the seven RH&T sensors and five strain gauges were sampled on a continuous basis (once a minute), and converted and stored in the data recorder as hourly parameters (average, minimum, maximum and standard deviation) from where they were downloaded monthly to NRC/IRC.
The RH&T sensors had a temperature range from –10°C to +60°C and a relative humidity range from 0% to
100%. They were inserted into 75-mm deep holes, which were predrilled into both columns prior to the application of the laminate. The holes in Column 2 were capped and accurately mapped so that they could be readily accessed and reopened following wrapping. Sensors were installed at different locations on each column to ascertain variations with column height. An additional sensor was mounted above the data recorder station (just below the ceiling slab) to monitor conditions within the parking garage in the immediate vicinity of the columns.
Five strain gauges (25.4-mm gauge length and a 6.35-mm gauge width) were mounted on the exterior surface of the two columns to monitor strain behaviour. Of these, one pair of horizontal and vertical gauges was mounted in the lower half of each column with the fifth and final gauge being installed in the horizontal direction on the upper half of Column 2. However, because of space limitations, strain gauge data is not presented or discussed within this paper.
Figure 11. Layout of Instrumentation on Concrete Columns in Underground Parking Garage
RESULTS Concrete Cores
Transverse sections of 5-mm and 25-mm thickness were dry cut from each of the six cores and used to determine the moisture content, chloride ion concentration and air-void content of the concrete in the two columns. Tests performed on the sections indicated that the moisture content within the concrete cover surrounding the steel reinforcement in both columns increased with surface depth but remained fairly constant with respect to vertical location on the columns. Near the surface, moisture content was just below 1.5% while at the depth of the rebar, moisture levels were about 3% or about twice those near the surface. Except near the bottom of the columns, chloride ion concentrations stayed nearly constant within the concrete cover (about 0.004%). Near the bottom, surface concentrations (about 0.05%) were about ten times higher than those at the depth of the steel reinforcement suggesting that salt-contaminated snow from parked vehicles was the main contributor of chloride ions.
Although the columns sit side by side, they reside on opposite sides of an expansion joint and thus represent vertical components in two separate structures. Cores taken from the columns indicated that different concrete mixes were used to construct the two structures. Sections from the cores showed that the two columns contained about the same size (about 20 mm) but different types of coarse aggregate. Column 1 was made with angular limestone and Column 2 rounded granite. However, the dissimilarity between the two concrete mixes was further highlighted by the substantial disparity in their air content, about 2.0% for Column 1 and 8.5% for Column 2. This suggested that an air-entraining agent had only been incorporated into the mix for Column 2. As Column 1 appeared to have undergone considerably more repairs to its surface than Column 2, this deficiency in entrained air may have been an important factor in the column’s poorer performance to the influx of road de-icing salts during its initial 20-year in-service life.
Annual Surveys
The surveys were most often performed in the evening during the workweek after most of the vehicles had
Half-Cell Potential
Measurements conducted on the surface of the columns in 1996 indicated that the two columns had comparable potentials at the start of the study. At all grid points, potentials were above –200 mv, indicating a low probability of rebar corrosion activity in the columns. In fact, potentials were well above –100 mv at most locations. These small negative potentials combined with difficulty in obtaining consistent readings at most column locations suggested that the moisture content of the concrete near the surface of the two columns was quite low.
Half-cell potentials measured on the unwrapped column (Column 1) have undergone few changes with time. Potentials along most vertical grid lines continued to lie between -100 mv and +100 mv indicating that the outer layer of concrete on the column was still quite dry in spite of the garage being inundated with moisture during and following rain and snow storms. As a result, a fairly low potential for rebar corrosion has existed within the column during the past six years, which suggests that conditions within the garage have been favourable for the long-term survival of the reinforced columns.
Ultrasonic Pulse Velocity
Through-transmission pulse velocities were measured from each grid point on one side of a column to the two grid points at the same elevation on the opposite side. In keeping with the experimental procedure developed at the start of the study, several readings were taken for each measurement to minimize experimental errors in determining the time of travel between pairs of grid points. For some pairs on Column 1, it was difficult to obtain repeatability, as the time-of-travel readings varied considerably with slight shifts (1-6 mm) at grid points in the placement of the 53-mm diameter transducers.
Column 1: Nearly all velocities obtained in Column 1 (unwrapped column) at the start of the study lay
between 4000-5000 m/s. Thereafter, both the uniformity and amplitude of measured velocities changed dramatically. For measurements conducted in 2001 and 2002, velocities generally ranged between 1000-4000 m/s. A large part of the changes that appeared to be taking place within the column have been linked to the massive repairs, which were made to the column about a decade ago. Map cracking was readily evident throughout the height of the column in all surface repair material. Separation of repair patches from the original concrete substrate was also visible on column surfaces. The sonic measurements, combined with these visual observations, have strongly suggested that the repair material was slowly cracking and separating from the substrate as it aged. Both aspects of patch deterioration would contribute to the difficulty in obtaining repeatable time-of-travel readings and to the significant drop in pulse velocity at numerous grid point locations throughout the column.
Column 2: Through-transmission velocities in Column 2, the column selected for wrapping because of its
superior visual condition at the start of the study, have also shown some signs of diminution. However, measurements to date have suggested that both the affected area and rate of deterioration within the column were considerably less than those surmised for Column 1, as decreases in velocity have only been consistently obtained in the annual surveys at a few points in the upper half of the column. Possible reasons for the decreases included cracking and separation of repair patches, and delamination of the laminate from the substrate. At present, it is difficult to say which of the above deterioration mechanisms is most applicable without undertaking additional ultrasonic testing of the laminate.
Onsite Monitoring
Relative Humidity and Temperature
Average hourly relative humidities and temperatures (RH&Ts) collected on the two columns during 2001 are shown in Figure 12. RH&Ts recorded in the garage for the same time period are also shown with the right-hand ordinate as the Y-axis. RH&Ts measured in the two columns in previous calendar years displayed similar profiles.
Temperature: Temperatures measured in the two columns during the past six years closely followed that recorded in the garage. Although it cannot be readily seen in the graphs of Figure 12, the average hourly temperature in the garage fluctuated considerably more than those in the columns, primarily as a result of the openings and closings of the nearby exit and entrance doors to the garage.
Temperatures in the garage and columns generally ranged between 10°C and 30°C with the lowest temperatures for the year being recorded between December and February and the warmest in either July or August. As the garage is heated, it is unlikely, for the average hourly temperature in the garage to fall below 10°C. Because the underground garage is not air-conditioned, the warmest temperatures depend simply on the outdoor conditions and the length of time the garage doors stay open.
COLUMN 1
Average Hourly Temperature, Year 2001
10 15 20 25 30 35
Jan-1 Jan-31 Mar-2 Apr-1 May-2 Jun-1 Jul-2 Aug-1 Sep-1 Oct-1 Nov-1 Dec-1 Jan-1 DAY Temperat ure, °C 10 15 20 25 30 35 G a ra ge Temper at ur e, ° C
1-Bot 1-Mid 1-Top Garage RH & T Sensors
COLUMN 2
Average Hourly Temperature, Year 2001
10 15 20 25 30 35
Dec-31 Jan-30 Mar-1 Mar-31 May-1 May-31 Jul-1 Jul-31 Aug-31 Sep-30 Oct-31 Nov-30 Dec-31 DAY Temperat ure, °C 10 15 20 25 30 35 G a ra ge Temper at ur e, ° C
2-Bot 2-Mid 2-Top Garage RH & T Sensors
COLUMN 2
Average Hourly Relative Humidity, Year 2001
40 45 50 55 60 65 70
Jan-1 Jan-31 Mar-2 Apr-1 May-2 Jun-1 Jul-2 Aug-1 Sep-1 Oct-1 Nov-1 Dec-1 Jan-1 DAY Re la tiv e Hu mid ity , % . 0 10 20 30 40 50 60 70 80 90 100 Ga ra g e Re la tiv e Hu m id ity , % .
2-Bot 2-Mid 2-Top Garage RH & T Sensors
COLUMN 1
Average Hourly Relative Humidity, Year 2001
40 45 50 55 60 65 70
Jan-1 Jan-31 Mar-2 Apr-1 May-2 Jun-1 Jul-2 Aug-1 Sep-1 Oct-1 Nov-1 Dec-1 Jan-1 DAY Re la tiv e Hu mid ity , % . 0 10 20 30 40 50 60 70 80 90 100 Ga ra g e Re la tiv e Hu m id ity , % .
1-Bot 1-Mid 1-Top Garage
uu
RH & T Sensors
Figure 12. Average Hourly Temperatures and Relative Humidities in Garage Columns During 2001
Relative Humidity: Relative humidities (RHs) obtained in each column had similar profiles to those obtained in
previous years. However, the yearly signatures differed not only with that measured in the garage but also with each other. While the RH in the garage fluctuated readily between 10-80% during 2001, the RHs in Column 1 (unwrapped column) decreased slowly by about 1% RH between January and the end of April, rose by about 5% RH during May and June and fell again by about 8% RH between the middle of August and the end of December. As a result, column RHs which began the year between 45-50% RH ended the year between 40-46% RH. In previous years, the change generally represented a decrease in moisture content within the column, as comparable temperatures were recorded in the column at the start and end of each calendar year. However, as
temperatures in the column during January 2001 were about 8°C higher than those in December 2001, it is
difficult to say whether the moisture content within the unwrapped column actually decreased during 2001. The RHs in Column 2 (wrapped column) during 2001 showed a slightly different profile than Column 1 with respect to both sensor location and time of year. RHs in Column 2 remained fairly constant during the first four months of the year then rose slowly from the beginning of May to reach annual highs, which for the most part were maintained from the middle of June until the end of August. Thereafter, RHs slowly decreased attaining lows at the end of December, which were only marginally less (about 2% RH) than those recorded at the beginning of January. As the RHs in the column at the end of December were only slightly less than those in
January despite the 8°C difference in temperature, it would appear that the moisture content within the column
has remained unchanged during 2001. The RH&T curves thus suggested as they had for measurements taken in previous years that in spite of the relatively dry conditions within the heated garage, the moisture content within Column 2 had remained relatively constant since the laminate was applied to the column.
As a final observation, RHs in both columns also followed temperature trends, increasing when temperatures rose and decreasing when temperatures fell. This relationship suggests a link between pore water and water
vapour; namely, as the temperature in the column rises, pore water within the concrete evaporates whereas when the temperature falls, water vapour condenses and is reabsorbed as pore water.
CONCLUSIONS
1) Relative humidity and temperature measurements suggest that the moisture content within the wrapped column has undergone only a marginal decrease during the past six years. In comparison, a much larger drop was sustained by the control column.
2) Half-cell potentials measurements taken on the control column suggest that a fairly dry environment has existed and continues to exist within the heated underground parking garage. When combined with the RH&T measurements, a low probability of ongoing rebar corrosion within the two columns is indicated. 3) Mechanical changes detected in the control and wrapped columns by ultrasonic pulse velocity
measurements appear to be associated with repairs made to the columns in the early 1990s. Decreases in pulse velocities combined with visual observations have suggested that repair material in both columns has continued to crack and slowly separate from the concrete substrate as it ages. Differences produced by the presence of the laminate on the mechanical properties of the concrete substrate were thus not apparent from this study.
REFERENCES
American Society for Testing and Materials (1997), ASTM C 597-97, Standard Test Method for Pulse Velocity
Through Concrete, Philadelphia, PA
American Society for Testing and Materials (1991), ASTM C 876-91, Standard Test Method for Half-Cell
Potentials of Uncoated Reinforcing Steel in Concrete, Philadelphia, PA
Carino, N.J. (2001), “The Impact-Echo Method: An Overview”, Proceedings of the 2001 ASCE Structures
Congress & Exposition, Washington, D.C., Reston, Virginia, USA, 18 p.
Clough, R.W. and Penzien, J. (1975), Dynamic of Structures, McGraw-Hill, Inc., New York, New York, USA. Davis, A.G. and Dunn, C.S. (1974), “From Theory to Field Experience with the Non-Destructive Vibration
Testing of Piles”, Proceedings of the Institute of Civil Engineers, Vol. 57, Part 2, pp. 571-593.
Magrab, E.B. and Blomquist, D.S. (1971), The Measurement of Time-Varying Phenomena, John Wiley & Sons, Inc., New York, New York, USA, 347 p.
Malhotra, V.M. and Carino, N.J. (1991), Handbook on Nondestructive Testing of Concrete, CRC Press, Boca Raton, Florida, USA, 343 p.
Pernica, G., Daoud, J. and R. Glazer (1999), Monitoring the Performance of CFRP-Wrapped Concrete Columns,
Progress Report for FY 1998/1999, Institute for Research in Construction, National Research Council
Canada, Ottawa, Ontario
Pernica, G., Law, T., Glazer, R., Lee, C.F., Tham, G. and Yue, Q. (2002), “Development of a Non-Destructive
Procedure to Determine the Length of In-Situ Soil Nails”, 55th Annual Canadian Geotechnical Conference,
Niagara Falls, Ontario, Canada
Salloum, T. (2003), Using the Impulse-Response Technique to Estimate the Length of In-Situ Soil Nails, Master Thesis Presented for the Master of Applied Science Degree, Carleton University, Ottawa, Ontario, Canada, 186 p.