Publisher’s version / Version de l'éditeur:
Vous avez des questions? Nous pouvons vous aider. Pour communiquer directement avec un auteur, consultez la
première page de la revue dans laquelle son article a été publié afin de trouver ses coordonnées. Si vous n’arrivez pas à les repérer, communiquez avec nous à PublicationsArchive-ArchivesPublications@nrc-cnrc.gc.ca.
Questions? Contact the NRC Publications Archive team at
PublicationsArchive-ArchivesPublications@nrc-cnrc.gc.ca. If you wish to email the authors directly, please see the first page of the publication for their contact information.
https://publications-cnrc.canada.ca/fra/droits
L’accès à ce site Web et l’utilisation de son contenu sont assujettis aux conditions présentées dans le site LISEZ CES CONDITIONS ATTENTIVEMENT AVANT D’UTILISER CE SITE WEB.
Internal Report (National Research Council of Canada. Institute for Research in Construction), 1994
READ THESE TERMS AND CONDITIONS CAREFULLY BEFORE USING THIS WEBSITE. https://nrc-publications.canada.ca/eng/copyright
NRC Publications Archive Record / Notice des Archives des publications du CNRC :
https://nrc-publications.canada.ca/eng/view/object/?id=03473776-e37d-4122-9c96-6b68ab88eba9 https://publications-cnrc.canada.ca/fra/voir/objet/?id=03473776-e37d-4122-9c96-6b68ab88eba9 For the publisher’s version, please access the DOI link below./ Pour consulter la version de l’éditeur, utilisez le lien DOI ci-dessous.
https://doi.org/10.4224/20375812
Access and use of this website and the material on it are subject to the Terms and Conditions set forth at The Energy Conservation Potential of Power Management for Fax Machines
,'
BLDG1
n o . GGGJ u n e
1 9'34
National Research Conseil national Council Canada de recherches Canada Institute for lnstitut de
Research in recherche en Construction construction
The Energy Conservation Potential of
Power Management for Fax Machines
by Guy R. Newsharn and Dale K. Tiller
Internal Report No. 666
Date of issue: June 30, 1994
I n t e r n a l r e p o r t : I n s t i t u t e
--
Rev C r e i g h t u n ANAILYSE ANALYZED C I S T I / I C I S T NRCiCNRC IRC: Ser R e c ci v e d ot-t : 9 8 - 0 4 - 9 4 I n t e r n a l r r p a r t : I n s t i t u t e f o r R e s e a r c h i n C n n s t r u c t i o n C a n a d aThis is an internal report of the Institute for Research in Construction. Although not intended for general distribution, it may be cited as a reference in other publications
Guy R. Newsham, Ph.D. and Dale K. Tiller, D.Phi1. Institute for Research in Construction
National Research Council of Canada Ottawa, Ontario, KIA OR6
IRC Internal Report No. 666
Fax Machines Newsham & Tiller 2
Acknowledgement
This project would not have been possible without the participation of many
organizations who were willing to make the raw data on their fax machine usage available to us, and the co-operation of those individuals who devoted time to collecting these data and sending them to us. Contributing organizations were (in alphabetical order):
A.T. & T. (USA);
California Energy Commission (USA); CENBG (France);
Computer & Business Equipment Manufacturers Assoc. (USA);
Electric Power Research Institute (USA); Environment Canada (Canada);
Lawrence Berkeley Laboratory (USA);
Los Angeles Department of Water and Power (USA); National Institute of Standards and Technology (USA); National Research Council Canada (Canada);
Natural Resources Canada (Canada);
North Carolina Alternative Energy Corporation (USA); Northern States Power Company (USA);
NUTEK
& OMVarden (Sweden); Ontario Hydro (Canada);Pacific Gas & Electric (USA); Southern California Edison (USA); U.S. Department of Energy (USA);
U.S. Environmental Protection Agency (USA); Wisconsin Centre for Demand Side Research (USA).
Thanks are also due to the staff of iScan (Ottawa, Canada) who efficiently converted
Fax
Machines Newsham & TillerAbstract
We measured the power draw, power quality, and operating profiles of a number of fax machines. Our aim was to quantify fax machine energy consumption and to evaluate the potential of energy conservation through power management. The results established that fax machines, when idle, draw between 7 and 30 % of nameplate rated power, with power factors around 0.5, and total harmonic distortion in the current of over 150 %. We then used fax machine activity reports to analyze the usage of 32 fax machines over a 12 week period.
These fax machines were active for an average of only 3.7 % of the time they were switched on, although there was considerable variation about this mean. Further, an average of 86.4 % of on-time could be eliminated by automatically switching off the fax machines after 15
minutes of inactivity. Such power management could realize savings of around $ 1 9 per fax machine per year. In addition, we found that around 9.3 % of fax transactions were halted due to transaction errors, and that up to 23.8 % of faxed pages were cover sheets. Efforts to reduce transaction errors and the use of cover sheets could realize additional energy, time and paper savings, and reduce telephone charges.
Contents
Section
1 INTRODUCTION
1.1 Fax machine energy consumption
1.2 Office equipment use patterns
2 METHODS AND PROCEDURES
2.1 Electrical operating characteristics 2.2 Operating profiles
3 RESULTS
3.1 Electrical operating characteristics
3.2 Operating profiles
4 DISCUSSION
4.1 Electrical operating characteristics
4.2 Operating profiles
5 CONCLUSIONS
Fax
Machines Newsham & Tiller 61. Introduction
1.1 Fax machine energy consumption.
The fax machine was patented in 1843,30 years before the telephone, and became popular with newspapers in the 1920s for transmitting photographs. Nevertheless, it was only with the anival of cheap, fast, digital machines that the fax machine became a popular, and
now indispensable, feature of the office workplace [Hunkin, 1993; Lovins & Heede, 19901.
Fax machine inventories have increased rapidly since the late-1980s. One estimate [Lovins & Heede, 19901 put the U.S. fax machine inventory in 1984 at 0.47 million, in 1989 at 2.47 million, and in 1993 at 12.1 1 million; another estimate [Patel, Teagan & Dieckrnann, 19931 put the 1989 inventory at 3.7 million. Flavelle [I9931 put the number of fax machines in Canada at about 1 million. Although sales reached a peak in 1988, when inventories almost doubled in that single year [Piette, Eto & Hanis, 19911, inventories are still predicted to increase by between 5 and 10 % until the end of the decade [Piette, Eto & Harris, 1991; Patel,
Teagan & Dieckmann, 19931. In Canada, fax machine inventories increased by 11 % in 1991, when $106 million was spent on hardware [Haggett, 19931. However, it is expected that fax
modems and seamless electronic data transfer will eventually replace stand-alone fax machines'
.
In terms of U.S. energy consumption, fax machines represented the fastest growing office equipment category2 in the years 1983 to 1991 [Piette, Eto &Harris, 19911. This is a
suiking statistic since office equipment itself is the fastest growing electrical end-use, now consuming anywhere between 25 and 65 TWh per yea? in the U.S., and responsible for
between 5 and 20 % of electrical loads in office buildings [Piette, Eto & Harris, 1991; Patel, Teagan & Dieckrnann, 1993; Lovins & Heede, 19901. Nevertheless, fax machines account for only about 1 % of all office equipment energy consumption patel, Teagan & Dieckrnann,
1993; Harris, 1992; Szydlowski & Chvala, 19941. This relatively small fraction is explained
by two facts: (1) individual fax machines draw far less power than most other pieces of office
equipment (e.g. a typical fax machine might draw 25 W when idle, a typical PC and VDU
might draw 125 W); and (2) fax machine inventories are relatively small compared to some
other office equipment items (for example, whereas most office workers each have a PC,
twenty or more office workers might share one fax machine). Estimates for the total annual
1
Indeed, fax modem sales in the U.S. are already i n m i n g rapidly. Sales reached 655,000 in 1991 (double the previous year's sales), and Ihere were expected to be 8 million in place by 1995, with 1995 sales worth $ 1.1 billion [Gianturco, 19921.
2 The other categories being: PCs, printers, VDUs, copiers, typewriters, mainframes, and mini-computen.
3
Fax Machines Newsham & Tiller 8
energy consumption by fax machines in the U.S. in 1989190 are between 140 and 400 GWh [Lovins & Heede, 1990; Patel, Teagan & Dieckrnann, 19931. At a conservative 5 $/kwh, this
relatively small fraction of office equipment still amounts to between $ 7 and $ 2 0 million per
year in energy costs alone.
1.2 Office equipment use patterns and power management
Despite the fax machine's unprecedented rate of market penetration, there are little data on fax machine power draw and use profdes that can be used to systematically address potential energy savings.
Numerous studies have observed that the actual power draw of the vast majority of office equipment is considerably lower than nameplate ratings [e.g., Piette, Eto & Harris, 1991; Lovins & Heede, 1990; Norford & Dandridge, 1993; BRECSU, 1993; Tiller &
Newsham, 1993; Szydlowski & Chvala. 19941. However, these studies have generally been
limited to a narrow range of the available equipment. Typical true power draws are between
20 to 50 % of the nameplate values, and can vary widely between manufacturers of
comparable machines, or (particularly for imaging equipment) between operating cycles. Therefore estimates based on nameplate values, or assumed power draws unrepresentative of the general population, are likely to be substantially in error.
In observing use profiles, PCs have probably received the most attention, and detailed use profies have been recorded for a number of sites [Tier & Newsham, 1993; Szydlowski &
Chvala, 19941. These data have significantly changed the prevailing opinion about desktop PC use, and highlighted the tremendous potential for energy savings which would otherwise have gone unrecognized. Indeed, the Energy Star guidelines [Quain, 19931, and Swedish initiatives [NUTEK, 19921. requiring low power "idling" modes, have been derived with direct input from the use patterns observed by Tiller & Newsham [1993]. Most of the major manufacturers which supply PCs to the U.S. market have agreed to build machines to Energy Star specifications. Demand for such machines will be strongly driven by a U.S. Federal Government decision to procure only Energy Star equipment from 1994 onwards. Energy
Star computers could eventually produce $ 1 billion annual electricity savings across the U.S. [Gutfeld, 19921; put another way, by the year 2000 Energy Star and other programs that promote energy efficient computer equipment should prevent 20 million tonnes of carbon dioxide emissions. In addition, a number of manufacturers have developed add-on devices to
switch off PCs and peripherals when inactivity is detected [Stickney & Lovins, 19921. These retrofit devices enable existing PCs to meet Energy Star guidelines.
However, progress in evaluating the potential energy savings, appropriate efficiency guidelines, and implementation of the guidelines into hardware has proceeded much more slowly for office equipment other than PCs. While concentration on PCs is justified by the fact that they are likely responsible for the majority of office equipment energy consumption [Piette, Eto & Harris, 1991; Szydlowski & Chvala, 19941. it would seem likely that similar
Far Machines Newshum & Tiller 10
studies of the operating profiles of other pieces of office equipment will also yield significant tangible benefits.
With few exceptions [Dandridge, 1994; Zemos. 19931 current fax machines do not utilize power management technology, despite the proven potential of power management for PCs [Norford & Dandridge, 19931. Indeed, despite evidence to the contrary, several authors
propose that energy savings for fax machines are best achieved through a more efficient printing process, rather than power management. For example, Patel, Teagan & Dieclanann
[I9931 take this line, despite estimating that fax machines are active for only 3 % of the time they are switched on, and that 31 1 of 389 GWh annual U.S. fax energy consumption
represents consumption while idle.
In this study we collected available data on the true power draw of fax machines, and
added a small number of field measurements of our own. Then we compiled hourly and weekly operating profiles for fax machines under normal office operation. From these data we calculated the energy saving potential of power management for fax machines, that is,
automatically switching them into a "sleep" mode when they are not being used, and bringing them back to an active state in response to an incoming telephone call, or on demand from the host user.
2. Methods and Procedures
2.1 Electrical operating characteristics
A BMI 3060 Power Profiler was used to make field measurements of the power draw,
and other electrical operating characteristics, of a small number fax machines. I h e majority of measurements were made when the machines were switched on but idle. This is the operating
state of most interest to this study since it is only when machines
are
idle that power management savings can be achieved. Measurements taken when idle were: power, total harmonic distortion in the current, and power factor. Various active power measurements (when feeding paper, when printing a report) were also made whiie a sample fax page was sent to the same receiver machine. The BMI 3060 samples at one second intervals, and theidle-state values are the average of several (typically around 12) one second samples. The active-state values are the peak values that were observed during a single, relevant action, and it is important to recognize that the sampling frequency may cause the true peak value to be
missed. The nameplate power draw was also recorded. Some machines do not specify a rated wattage on the nameplate, listing instead a rated current value. In these cases, the current was simply multiplied by the operating voltage (typically 115 V) to obtain a nameplate power value.
Fax
Machines Newsham & Tiller I 22.2 Operating profiles
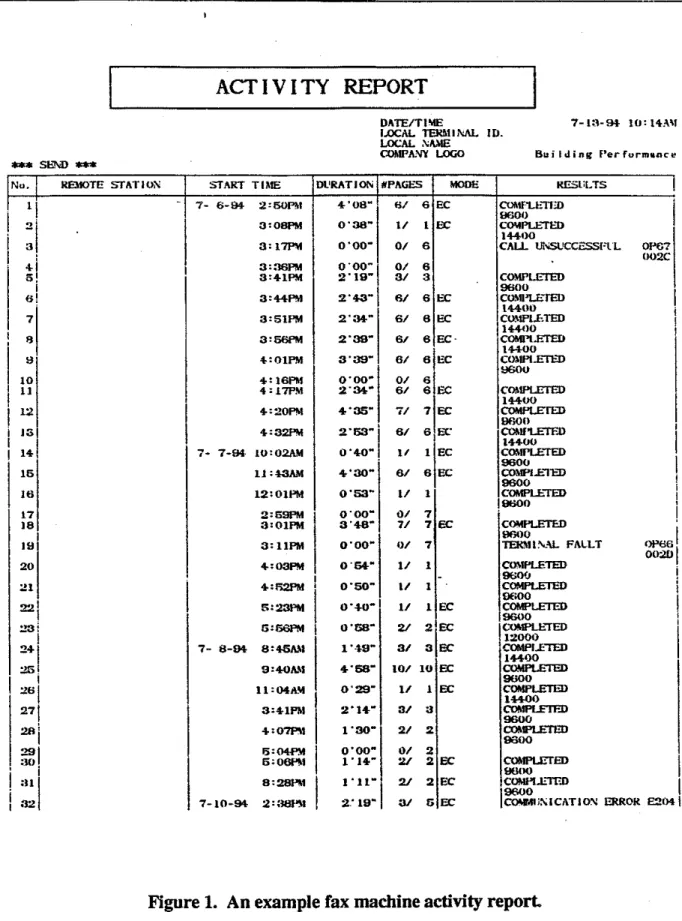
Most fax machines automatically produce hard-copy reports summarizing incoming and outgoing transactions (for example, see Figure 1). These reports are generally issued after specific intervals of time (e.g. daily), or after a given number of transactions (typically 30
to 50). Such reports contain all the information needed to compile a composite operating profile for a given fax machine: mode (transmit or receive), telephone number of the remote fax machine, date and time of transaction, time taken for transaction, and number of pages. In other words, the machine monitors its own activity, and making use of these data, rather than utilizing other monitoring hardware, provided us with a relatively cheap and flexible means of characterizing fax machine use profiles.
A number of organizations in several countries were solicited for their help in this
project The organizations were approached through contact with individuals within the organizations who had previously expressed an interest in office equipment energy issues. The individuals were asked to send us, periodically, the activity reports from one or more fax
machines in their organization. They were told that they could mask the telephone numbers on the reports (though, in the end, none of them chose to do so). The only incentive offered for participation was access to the results of the project, in the form of a complete fmal report.
A total of 21 organizations (mostly government departments or public utilities) in 4 countries agreed to participate, and sent activity reports from
a
t o t i o f 66 fax machines. Data werecollected over the period 1st January to 30th June, 1993, though, for a limited number of machines, data were made available for a period of up to 18 months.
Hard copy data were converted to digital form for analysis using a commercial scanning service, as the large quantity of data made key entry impractical.
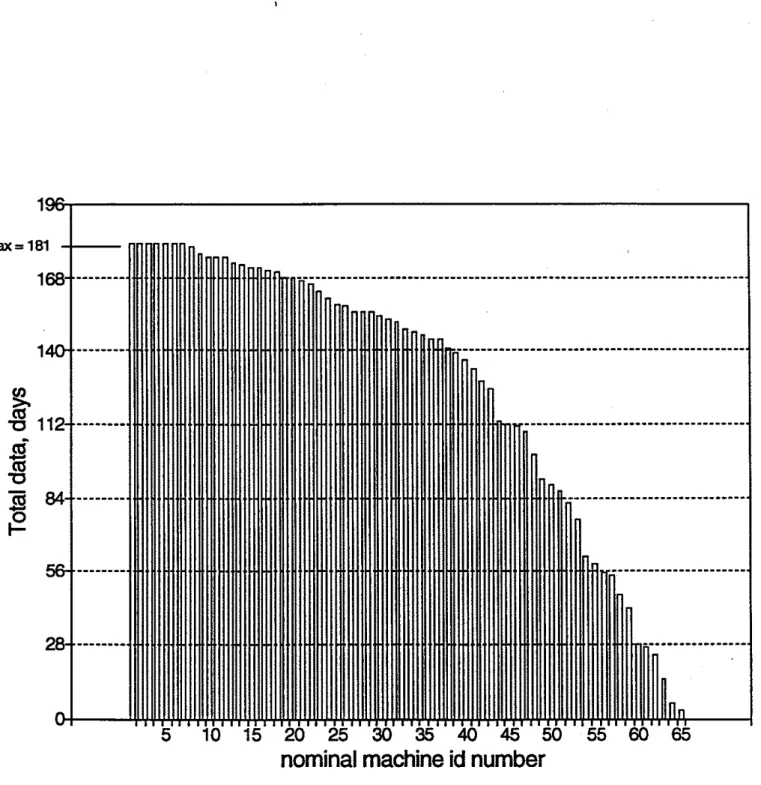
2 shows the number of days data received for each of the fax machines; the
machines are ordered according to the number of days for which data were available. However, the data were only useful if data were available in long series of continuous days. Figure 3 shows the longest string of continuous days of data for each of the fax machines; the machines are ordered according to the number of days for which continuous data were available.
At this point, it was decided we would have to sample from the total data set as
resources were not available to analyze all the data collected. Figure 3 demonstrates that to
compile the use profiles of at least 30 machiines (deemed a reasonable sample'size) would mean selecting machines from which continuous data were available for 84 days, or 12 weeks.
In fact, a 12 week "cut-off' yields a sample of 32 machines.
The data from the 32 machines in the sample with at least 12 weeks of continuous activity reports were scanned and converted into a standard ASCXI format It is important to stress that although the 12 week series all fell within the six month period January to June,
Far Machines Newsham & Tiller 14
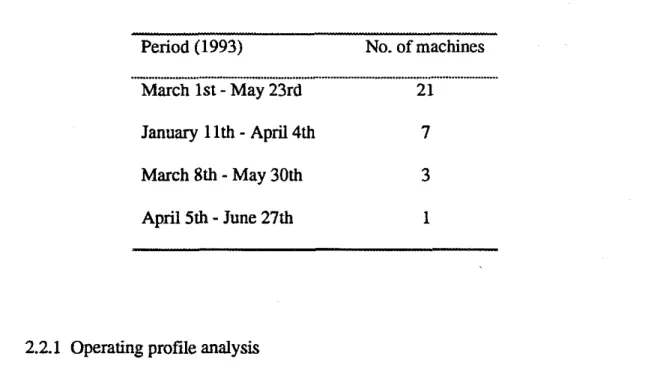
1993, the 12 weeks selected for each machine differed. Table 1 lists the 12 week periods used, and the number of machines associated with each.
The data files were checked visually for errors by both the staff of the scanning company, and, by ourselves; comparison with a limited, key entered, data set revealed that the error rate in the scanned data was considerably lower than the scanning companys claimed 0.5
%.
Table 1. The 12 week data periods used, and the number of fax machines associated
with each.
Period (1993) No. of machines
" -.- "
March 1st
-
May 23rd 21January 1 lth
-
April 4th 7March 8th
-
May 30th 3April 5th
-
June 27th 12.2.1 Operating profile analysis
We had already developed softwaz,-- tools for the analysis of time series activity data m l e r & Newsham, 19931, and therefore, for the sake of efficiency, we converted the data
files into a form which could be read and analyzed by these tools. This involved converting
the activity data into a continuous string of characters, each character representing one minute of real time. The character ' N represented a minute with no fax activity, the character " T represented a minute with fax transmission activity, the character "R" represented a minute
during which the fax machine received a message. We assumed that the machines were on 24
hours a day. Since the finest resolution is one minute, all fractions of a minute in the original
activity data set were rounded up. In other words, a transmission taking 2 minutes and 17
seconds, would be assigned three " T s in the converted data file.
For example, if we consider a single hour of the 12 week period, a string of characters representing an hour of fax idle time would appear as a string of 60 "Ws, as follows:
N N N N N N N N N N N N N N N N N N N N N N N N M \ M N N N N N N N N N N N N N
NNMVNNNN
If a 1 minute 45 second fax transmission occurred at a quarter past the hour, and
a
5 minute 3 second fax was received at thirty-five minutes past the hour, the data Fie would look like this:NNNNNNNNNNNNNNNNNNNRRRRRRNNNNNNNNNNN
NNMVNNNN
This rounding up of minutes might lead to a small overestimate in the active time of the fax machine. However, it is also true that fax machines remain "active" for longer than the time it takes to send or receive the message (which is what is recorded in the original data). Since it takes time for the operator to key in the telephone number, and time for the machine to print a c o n f i a t i o n report. Consequently, such rounding up is not unreasonable.
Fax Machines Newsham & Tiller 16
Our existing data analysis tools were then employed to read the strings of data for each fax machine (each suing being 120960 characters long; 12 weeks x 7 days x 24 hours x
60 minutes), and to "bin" the data into daily or cumulative hourly totals. The data were subdivided into transmission and reception activity, and into weekday and weekend activity.
We attempted to estimate the potential for energy savings through power management for fax machines, that is, automatically switching fax machines to a "sleep" mode when they have been idle for a certain period, and switching them back on again whenever the next transaction occurs. We chose 15 minutes of inactivity as a reasonable, conservative switching criterion. To estimate the potential for power management, we scanned the character strings (using a software analysis tool) and removed all "N"s occurring after the fifteenth in a row, up until the next transaction, indicated in the string by an "R" or a " T . Taking the first of the earlier one hour examples (and assuming activity just before this hour started) after the fifteenth "N" the machine is considered to have entered sleep mode automatically. All "N"s
following (shown underlined) would be removed from the string, thus saving 45 minutes of
on-time, as follows:
NNNNNNNN
For the second example, (again, assuming activity just before this hour started) the
transmission activity in the fifteenth minute prevents the fax machine switching to sleep mode automatically, there are only fourteen " N s in a row from the start of the string. Fifteen
minutes after the end of the transmission the machine automatically switches into sleep mode. However, only 4 minutes of on-time is saved (underlined) because in the thirty-fifth minute a
message is received. We assume that this returns the fax machine to active mode for
reception. Fifteen minutes after the end of the reception power management again switches the fax machine into sleep mode for the final 4 minutes of the hour (underlined), making a
total of only 8 minutes on-time savings in the hour:
N N N N N N N N N N N N N N T T N N P R R R R -
NNNmNm
Of course, if there is no activity during the next hour, a full sixty minutes of on-time would be
saved since the fax machine would already be off at the start of the hour.
3. Results
3.1 Electrical operating characteristics
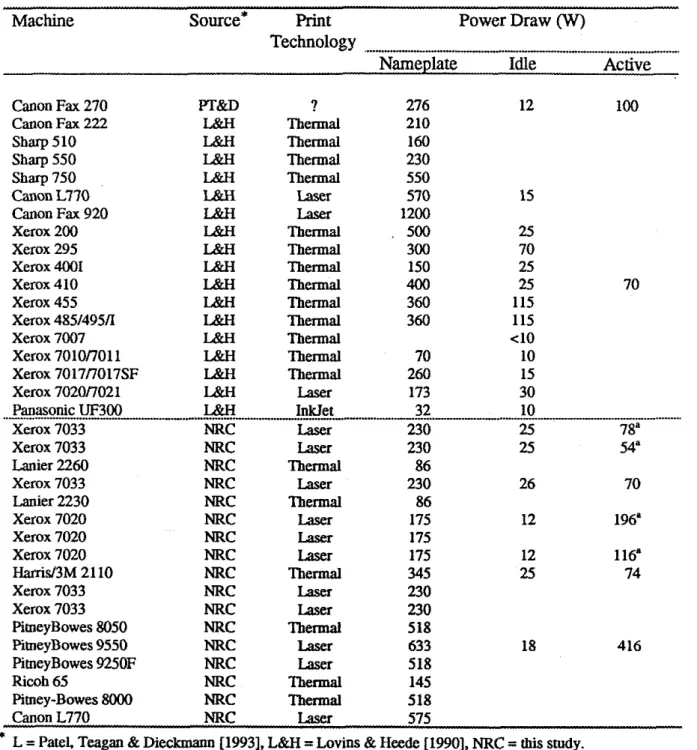
Table 2 shows the nameplate and measured power draw for various fax machines. The upper part of the table reproduces figures quoted in the literature, and the lower part of the table are the results measured in this study.
Two indicators of power quality, total harmonic distortion in the current waveform
(THD) and true power factor (PF) were also measured for a subset of the fax machines on the
Far Machines Newsham & Tiller I 8
Table 2. Nameplate and measured power draw for various fax machines. Figures are
from the literature, and our own measurements. Printing (or imaging) technology is also shown, if known.
Machine Source* hint Power Draw (W)
Technology
...
Nameplate Idle Active
Canon Fax 270 PT&D ? 276 12 100
Canon Fax 222 L&H Thermal 210
Sharp 510 L&H Thermal 160
Sharp 550 L&H Thermal 230
Sharp 750 L&H Thermal 550
Canon L770 L&H Laser 570 15
Canon Fax 920 L&H Laser 1200
Xerox 200 L&H Thermal 500 25
Xerox 295 L&H Thermal 300 70
Xerox 4001 L&H Thermal 150 25
Xerox 410 L&H Thermal 400 25
Xerox 455 L&H Thermal 360 115
Xerox 4851495A L&H Thermal 360 115
Xerox 7007 L&H Thermal <lo
Xerox 7010/7011 L&H Thermal 70 10
Xerox 7017I7017SF LBJI Thermal 260 15
Xerox 7020f7021 L&H Laser 173 30
Panasonic
-
UF300 L&H Inklet u 32".-
10Xerox 7033 NRC Laser 230 25 78' Xerox 7033 NRC Laser 230 25 54" Lanier 2260 NRC Thermal 86 Xerox 7033 NRC Laser 230 26 70 Lanier 2230 NRC Thermal 86 Xerox 7020 NRC Laser 175 12 196' Xerox 7020 NRC Laser 175
Xerox 7020 NRC Laser 175 12 116a
Hanid3M 21 10 NRC Thermal 345 25 74 Xerox 7033 NRC Laser 230 Xerox 7033 NRC Laser 230 PimeyBowes 8050 NRC Thermal 518 PitneyBowes 9550 NRC Laser 633 18 416 PimeyBowes 9250F NRC Laser 518 Ricoh 65 NRC Thermal 145 Pimey-Bowes 8000 NRC Thermal 518 Canon L770 NRC Laser 575
* L = Patel Teagan & Dieckmann [1993]. L&H = Lovins & Heede [1990], NRC = rhis study.
a note, the differences in peak active power draw beween identical machines is probably principally a
function of the one second sampling frequency, which is relatively long compared to the rate of change of power draw during aaivity.
Table 3. Total harmonic distortion in the current (THD) and true power factor (PF) for
various fax machines. Printing (or imaging) technology is also shown.
Machine Source Print Power Quality
Technology "
THD
PF "...
"....
" Xerox 7033NRC
Laser 200 0.44 Xerox 7033NRC
Laser 207 0.43 Xerox 7033NRC
Laser 20 1 0.44 Xerox 7020NRC
Laser 149 0.53 Xerox 7020NRC
Laser 147 0.54 Hanid3M 2 1 10NRC
Thermal 150 0.55 PitneyBowes 9550NRC
Laser 165 0.50 3.2 Operating profiles 3.2.1 Transaction rateFigure 4 shows the actual measured distribution of transactiondweek over the full 12
Fax Machines Newshum & Tiller 20
rate. The wide range in number of transactionsfweek (the busiest machine had an average of 709 transactiondweek, the least utilized had an average of only 9 transactionsfweek), suggests
that aggregate mean results alone are likely to be a poor representation of the data. Visual inspection of Figure 4 suggests it is possible to divide the sample of machines into three sub- samples, based on transaction rate. This division is also depicted in Figure 4. Sub-sample "A"
comprises the seven fax machines with the highest transaction rates, sub-sample "B" the
thirteen fax machines with intermediate transaction rates, and sub-sample "C" the remaining
twelve fax machines with lowest transaction rates.
3.2.2 Weekly profiles
Table 4 shows mean transaction activity for each of the 32 machines, with aggregate
means by sub-sample, and an aggregate mean for all machines; the standard deviation in the
total activity is also shown. It
is
clear that there is a wide variation in the ratio oftransmissions to receptions. Further, the relatively high standard deviations for many of the machines indicates
a
considerable variation in the transaction activity from week to week Although the standard deviations across the sub-samples are high they are far lower than the standard deviation across the whole sample of 32 machines, indicating that division by sub- sample is a better representation of the data than taking the sample of 32 machines as a whole.Table 4. Mean transaction activity for the 32 fax machines. Standard deviation (s.d.) in the total activity is also shown.
Fax Machine Transaction Activity (hourdweek)
"
TOTAL (s.d.) receive tmnsmit
sub-sample "A" 1 30.71 (1.98) 28.66 ' 2.06 2 19.87 (1.64) 12.65 7.22 3 17.15 (2.70) 9.86 7.30 4 18.37 (4.38) 4.11 14.26 5 14.50 (2.83) 5.60 8.90 6 12.51 (1.43) 6.04 6.47 7 8.21 (1.11) 4.62 3.59 ~ ~
sub-sample "A" mean 17.33 h.02) 10.22 7.11 subsample "B" 8 7.13 (1.07) 4.28 2.85 9 6.09 (3.01) 2.32 3.77 10 5.71 (1.97) 1.40 4.31 11 4.71 (1.32) 1.81 2.91 12 4.80 (1.01) 2.46 2.34 13 4.08 (1.46) 1.51 2.57 14 5.27 (1.64) 1.59 3.69 15 4.30 (0.60) 1.91 2.39 16 3.47 (1.10) 0.89 2.58 17 3.20 (0.901 1.60 1.60 18 2.79 (0.67) 1.43 1.36 19 3.67 (1.01) 1.56 2.11 20 3.55 (0.97) 0.77 2.78 sub-sample " B mean
---
-
4.52 (1.83) ... 1.81-
2.71 sub-sample "C" 21 3.34 (0.56) 1.42 1.93 22 1.32 (0.49) 0.76 0.56 23 1.73 (0.44 1.05 0.68 24 2.66 (0.83) 1.72 0.95 25 2.09 (0.64) 1.07 1.03 26 1.62 (0.45) 0.78 0.84 27 1.57 (0.71) 0.82 0.76 28 1.71 (0.34) 0.85 0.86 29 1.69 (0.61) 0.93 0.77 30 1.17 (0.67) 0.40 0.77 31 0.45 (0.35) 0.38 0.07 32 0.32 (0.10) 0.18 0.14 sub-sample "C" mean 1.64 (0.96) 0.86 0.78 Grand mean 6.24 (24.5) 3.29 2.95Fax Machines Newsham & Tiller
Mean transaction activity over alt 32 machines is 6.24 hourdweek (or 3.7 % of
assumed on-time). The mean transaction activity for sub-samples "A", "B", and "C" is: 17.33
hourdweek (10.3 % of assumed on-time), 4.52 hourdweek (2.7 % of assumed on-time), and 1.64 hourdweek (1.0 % of assumed on-time), respectively.
Figures 5 (a), 5 (b), 5 (c), 5 (d), 5 (e), 5 (0 are example plots of weekly transaction activity, for fax machines 1,4,9,17,20, and 21 respectively, and will be referred to again in
the discussion. These particular examples were selected to demonstrate the variation in fax machine activity that can occur from week to week. Each point represents mean activity over the previous week. The upper curve is the total transaction activity, and is the sum of the two curves below it, which plot weekly transmission and reception activity separately.
It is from the weekly profiles that we can calculate the energy savings potential of fax machines. The on-time savings due to power management with a 15 minute switching criterion are simply the difference between the prevailing on-time and the predicted on-time with 15 minute inactivity switch. Since the assumed prevailing on-time is continuous 24 hour operation, the prevailing weekly on-time is 168 hourstweek for a l l machines. Table 5 presents
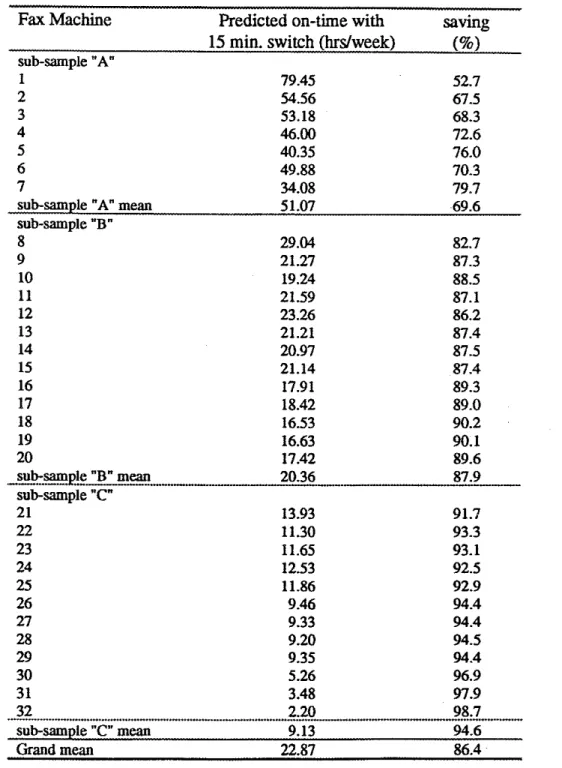
the predicted mean on-time with automatic switching after 15 minutes of inactivity, and the percentage on-time savings for each of the 32 machines. The potential on-time savings range from 52.7 % to 98.7 %, from the highest to the lowest activity machines respectively. Mean on-time with power management for all 32 machines is 22.87 hourdweek (or 86.4 % savings).
Table 5. Predicted on-time with automatic switching after 15 minutes of inactivity, and percentage on-time savings for each of the 32machines.
Fax Machine Predicted on-time with saving
15 min. switch (hrdweek)
(%I
sub-sample "A" 1 79.45 52.7 2 54.56 67.5 3 53.18 68.3 4 46.00 72.6 5 40.35 76.0 6 49.88 70.3 7 34.08 79.7sub-sample "A" mean 51.07 69.6 sub-sample "B" 8 29.04 82.7 9 21.27 87.3 10 19.24 88.5 11 21.59 87.1 12 23.26 86.2 13 21.21 87.4 14 20.97 87.5 15 21.14 87.4 16 17.91 89.3 17 18.42 89.0 18 16.53 90.2 19 16.63 90.1 20 17.42 89.6 sub-sample "B" mean
-
--.-- 20.36---
87.9 sub-sample "C" 21 13.93 91.7 22 11.30 93.3 23 11.65 93.1 24 12.53 92.5 25 11.86 92.9 26 9.46 94.4 27 9.33 94.4 28 9.20 94.5 29 9.35 94.4 30 5.26 96.9 31 3.48 - ~ 97.9 32 " " " 2.20 98.7 "".
sub-sample "C" mean 9.13 94.6 Grand mean 22.87 86.4Fax
Machines Newsham & Tiller 24The mean on-time with power management for sub-samples " A , "B", and "C" is: 51.07
hourdweek (mean savings of 69.6 %), 20.36 hourdweek (mean savings of 87.9 %), and 9.13 hourdweek (mean savings of 94.6 %), respectively.3.2.3 Hourly profiles
Figure 6 (a) is an hourly fax use profile. The curves are averages over all 32 machines
and 60 weekdays (Monday to Friday) in the 12 week period. Each point represents the mean fax use over the previous hour. The upper curve is the assumed prevailing on-time, in minutes per how, since the assumed prevailing on-time is continuous 24 hour operation, the upper curve
is
a horizontal lime at 60 minutes per hour. The lower curve shows the mean minutes per hour for which there was activity. The middle curve shows the predicted mean on-time if power management automatically switched fax machines into a sleep mode after 15 minutes of inactivity.More details on the transmit and receive activity
are
shown in Figure 6 (b). The upper curve represents mean transaction activity, and is the sum of the two curves below it, which plot mean hourly transmission and reception activity separately.Figure 7 (a) shows the hourly fax use profile for sub-sample "A". The curves are averages over the 7 machines in the sub-sample, for all 60 weekdays (Monday to Friday) in the 12 week period. The transaction activity of sub-sample
"A"
is shown in Figure 7 (b).13 machines in the sub-sample, for all 60 weekdays (Monday to Friday) in the 12 week period. The transaction activity of sub-sample "B" is shown in Figure 8 (b). Figure 9 (a) is
the hourly fax use profile for sub-sample "C". The curves are averages over the 12 machines
in the sub-sample, for all 60 weekdays (Monday to Friday) in the 12 week period. The transaction activity of sub-sample
"C"
is shown in Figure 9 (b).3.2.4 Pages per transaction
Figure 10 shows the frequency, over all 32 machines, and over the whole 12 weeks, of transactions of a given number of pages; a pageshansaction rate of zero ( " 0 ) indicates an
error in the transaction. The modal pages/transaction is 1 for receptions and 2 for
transmissions, though the difference in frequency between these two intemals for each type of transaction is small. The mean number of pages per transaction across the whole sample was 3.05.
Figures 11 (a) and 11 (b) show, by sub-sample, the normalized frequency of faxes of a given number of pages received and transmitted respectively.
Fax Machines Newsham & Tiller 26
4. Discussion
4.1 Electrical operating characteristics
It is clear from Table 2 that the true power draw of fax machines is considerably lower
than their nameplate rating. The idling power draw is between 7 and 30 % of nameplate, whereas the active power draw is typically 20 % of nameplate, though it can reach 65 or even
100 % of nameplate for some machines (Xerox 7020, PitneyBowes 9550). Obviously, basing estimates of fax machine energy consumption on nameplate power values would be likely to lead to signifcant overestimates.
Table 3 illustrates that fax machines exhibit very poor power quality, even worse than other electronic offtce equipment with switching power supplies Filler & Newsham, 19931.
Poor power quality may cause serious electrical problems in some installations. Various utilities and standards organizations are seeking standards to improve the power quality of electrical equipment. Targets are an upper limit on
THD
of, typically, 20-
33 %, with PFs no lower than 0.9 [Gileskie, 1993; CSA, 19921. Our results show fax machines operate welloutside these tolerances. Nevertheless, it is important to remember that fax machines are a very small fraction of the total building load, and improving their power quality would likely
4.2 Operating profiles
4.2.1 Weekly profiles
In section 3.2 we established that the range of transaction rates across our sample of fax machines indicates that it would be inaccurate to assume that any one fax machine is
representative of the whole population of machines. Our analysis of weekly data indicated further that any single week's data from any particular fax machine is unlikely to be
representative of the activity of that fax machine over a longer period. Some of the variability from week to week can be explained by a statutory holiday during Monday to Friday. For example, a number of machines (see Figures 5 (a), 5 (b), 5 (c), 5 (d), 5 (e), 5
(0)
show dips in activity for one or both of the weeks of April 1 lth and 18th. which might be explained by statutory holidays around Easter.The weekly proffles established that the potential on-time savings with power
management utilizing a 15 minute idle switching criterion are considerable. To translate these on-time savings into annual energy savings
(avcd,
kwh), we simply multiply the predicted on-Fax Machines Newshnm & Tiller 28
time savings, extrapolated from 12 weeks to a year (TaVd, hourslyear), by the machine idling power (Pidie, Watts), and divide by 1000~ :
To further estimate the dollar value of these savings (CaVd, $) we then multiply the energy savings by an appropriate electricity rate
(Em,
W h ) and divide by 100:Unfortunately, because most of the machines in the sample were located at great distances from our laboratory, getting idling power measurements for each of the machines was impossible. Therefore, to estimate energy and dollar savings, we chose a nominal idling power rate, based on the limited set of measurements recorded in Table 2, of 25 W.
Obviously, savings estimates for a different power draw can easily be made by multiplying by
an appropriate factor.
4
Note, we have assumed that when the machine is power managed due to inactivity its power draw drops to
zero. In practice it might be necessary to maintain some ''trickle" current to the machine to enable it to be available for immediate use.
Additionally, electricity rates vary by region, customer, total billed energy, and a number of other factors. Therefore, for the sake of simplicity, we chose a nominal electricity rate of 10 $/kwh (0.10 $/kwh). While this may be high for most commercial sites in Canada,
it may not be inappropriate for other world locations. Obviously, savings estimates for a different electricity rate can easily be made by multiplying by an appropriate factor.
Note that we have made no attempt to account for associated savings in peak electrical demand or reduced HVAC load. While energy savings at the fax machine appear directly on the meter, peak electrical demand and HVAC loads depend heavily on what other equipment is in the building, utility billing structures, system characteristics, and a whole host
of other site specific parameters. The kind of detailed, site-specific analysis necessary to assess these parameters was beyond the scope of this study. At any rate, the power density of fax m a c h i i is obviously so low that it is unlikely they will have a significant effect on whole
building electrical demand or W A C operation.
Table 6 summarizes the savings calculations, for each of the three sub-samples, and for
the whole sample taken together.
The predicted savings, for the assumed idling power and electricity rate, are between $ 15 and $ 2 1 per year, depending on the transaction rate. From this figure we can calculate
what the capital cost of power management must be in order to meet a given pay-back period. For example, if a simple pay-back period of 3 years is required any retrofit power
Far Machines Newshmn & Tiller 30
management device for fax machines should cost no more than $45 to $60. A similar
limitation should be applied to the incremental cost of building power management into new
fax machines. Naturally, what is considered a reasonable pay-back period for energy- efficiency capital investment is another site specific parameter.'
Table 6. Annual on-time, energy and dollar savings for fax machines, by sub-sample,
extrapolated from 12 week activity measurements.
Fax
MachinesTsw,
pidle %rsd &rgy c~svcd@ours) (W)
W m )
($kwh)($1
"-
sub-sample "A" 6097 25 152.4 10 15.24 sub-sample "B" 7698 25 192.5 10 19.25 sub-sample "C" 8284 25 207.1 10 20.7 1 Grand mean 7567 25 189.2 10 18.92Fax
machines with built-in power management are appearing on the market [Dandridge, 19941, and more will surely follow if Energy Star or similar guidelines areNote that a 15 minute switching criterion might be conservative. For the lower use machines it might be reasonable for the fax machine to enter a sleep mode almost as soon as a transaction is complete. In this case on-time would approach active time (Table 4) and the savings potential of power management would be greater than that shown in Table 6.
extended to encompass fax machines. In addition, at least one retrofit power management device for stand-alone fax machines already exists [Zemos, 19931. However, its cost of
U.S.
$100 suggests its pay-back in energy savings may be a little too long for most applications. Feedback I19941 describes a retrofit device to power manage fax modems, eliminating the need to leave a PC on 24 hours a day to receive faxes. Though its price seems high (U.K. f 200) one should remember it controls a relatively high power PC rather than a low power fax machine.
4.2.2 Hourly profiles
figure 7 (a) indicates that even for the highest use machines, fax transactions overnight were rare; mean activity rate in the middle of the night being around 1 minute per hour. However, there is significant transaction activity in the early morning and early evening, with activity picking up at around 5 am, and not reaching "background" levels again until 8
pm. Considerable on-time (and therefore energy) could be saved during the night with
automatic power management with a 15 minute inactivity switching criterion. However, on- time during the day for these busy machines would remain at around 50 minutes per hour; because of the high transaction rate, there are relatively few extensive idle periods during the working day.
Figure 7 (b) shows the transaction activity in more detail. Differences between the hourly profiles of the transmission and reception activity are evident Transmission activity
Fax Machines Newsham & Tiller
clearly depends on the schedules of the occupants of the office in which the host fax machine
is located. If the occupants work traditional office hours, then the transmission activity will be largely limited to these hours. Figure 7 (b) shows virtually no transmissions overnight, with
transmission activity picking up around 7 am as some occupants arrive, and peaking in the
morning around 10 am, by which time, presumably, all the occupants would have arrived.
There is a dip in transmission activity with a minimum at 1 pm, indicating a decline in office
activity over lunch. Transmission activity increases after lunch to a maximum at 3 pm, and
then falls off again; some activity at 6 and 7 pm results from "after hours" work. This profile
is very similar to that observed in studies of computer keyboard activity [Tiller & Newsham,
19931.
In contrast, the time at which faxes are received depends on the schedules of workers in the offices from which the faxes were sent ("remote offices"). If these offices are
predominantly in the same time zone, the reception activity should have a profile similar to that of transmission activity. If, on the other hand, the remote offices are predominantly in
different time zones, the reception profile might be quite different to the transmission profile, as it would super-impose schedules at various remote offices. Figure 7 (b) shows reception picking up as early at 5 am. This can be explained by the fact that of the 7 machines in sub-
sample " A 5 were on the west coast of the U.S. (the other 2 being in Ontario, Canada). The
majority of the faxes received from other time zones would presumably come from U.S. cities further east, particularly cities in the Eastern U.S. time zone, which is three hours ahead of the west coast
--
therefore, 5 am on the west coast is 8 am on the east coast, Figure 7 (b) showsthat at 8 am (local time) transmission activity is already half-way to its morning peak.
Reception activity peaks at 1 pm, 1 pm on the west coast is 4 pm on the east coast, and 4 pm
is when we observe close to peak transmission activity.
Figure 8 (a) indicates that, amongst sub-sample "B", fax transactions overnight were
rare. Compared to sub-sample "A", transaction activity in the early moming and early evening was also curtailed, with activity not picking up until 8 am. Considerable on-time (and
therefore energy) could be saved during the night and day with automatic power management with a 15 minute inactivity switching criterion, on-time during the day being reduced to less
than 30 minutes per hour.
Figure 8 @) shows no differences in the form of the hourly transmission and reception activity profiles. The reception profile follows the same mditional office schedule as the transmission profile. This likely indicates that for the intermediate transaction activity machines of sub-sample "B", most of the remote fax machines were in the same time zone as
the receiver. If the remote machines were in many different time zones, the reception activity profile would have been "smoothed out" over the day, with
a
less evident dip at lunchtime, and activity in early morning and early evening. However, since we did not collect specific data on the locations of remote machines, we cannot answer this question unequivocally.Figure 9 (a) indicates that, amongst sub-sample "C", fax transactions overnight were
Far Machines Newsham & Tiller
early evening was also curtailed, with activity not picking up until 9 am, and dropping to
almost zero by 6 pm. Considerable on-time (and therefore energy) could be saved during both night and day with automatic power management with a 15 minute inactivity switching
criterion, on-time during the day being reduced to less than 15 minutes per hour.
Figure 9 (b) shows no differences in the form of the hourly transmission and reception
activity profdes. As with sub-sample "B", the reception profile follows the same traditional
office schedule as the transmission profile. This likely indicates that for the lowest transaction activity machines of sub-sample "C", most of the remote fax machines were in the same time zone as the receiver.
4.2.3 Transmission to reception ratio
An indicator of the representativeness of the sample of 32 machines to the worldwide
population of fax machines is the ratio of the number of transmitted pages to received pages.
If we had a closed sample of fax machines, where all the machine transactions were with other machines in the sample, then the number of transmitted pages would be equal to the number of pages received. Therefore, if we were able to monitor a l l the fax machines in the world, the number of uansmitted pages would be equal to the number of pages received. It follows that
any sample of machines which seeks to be representative of the world population should approach the ideal of equal numbers of transmitted and received pages. For the sample of 32 machines in this study the total number of pages transmitted on all days of the 12 week period
was 89,205, and the total number received was 94.281. This amounts to a discrepancy from equality of only 2.8 9%:
Therefore, our sample of 32 machines would appear to be representative of the general population of machines, at least for the this rough indicator of representativeness.
Interestingly, we might expect the number of receptions to exceed the number of transmissions, even in a closed system. This is due to the use of fax modems, likely to
displace stand-alone fax machine transmissions in preference to receptions.
A further, stronger, indicator of representativeness is the frequency distribution of pagedtransaction in the transmit and receive mode. For the world population, the
distributions in transmit and receive modes should be identical. Figure 10 shows the
distributions for our sample of 32 machines. The distributions are indeed obsemed to be very similar. This further, though still rudimentary, indicator of ~presentativeness indicates that our sample of 32 machines is representative of the general population of machines.
Fax Machines Newsham & Tiller 36
The data on pagedtransaction can be presented by sub-sample to investigate
differences across sub-samples. Figure 11 (a) demonstrates that the normalized frequency distribution of the number of pageslreception is very similar across sub-samples. The
normalized frequency distribution of the number of pagedtransmission is also similar across sub-samples, as shown in Figure 11 (b). There is a tendency toward shorter transmissions in the highest use sub-sample ("A), though overall there is little evidence that more frequent
faxing means shorter length faxes.
4.2.5 Error rate and cover pages
If we assume that a zero ("0") page transaction indicates a transaction error, then
Figure 10 provides information on error rates during faxing. Of a total of 55,355 observed
transactions, there were 5,169 zero page transactions, or an error rate of 9.3 %. This is significant since transaction errors can waste employee time, boost telephone charges, and increase paper and electricity consumption. Errors can be due to the operator or the function of the machine. While it was not within the scope of this project to identify the causes of faxing errors in any greater detail, this may be an area worthy of further investigation.
The data of Figure 10 atso allow us to speculate on the implications of the use of cover sheets for fax messages. If we assume that every transaction of 2 or more pages used a cover sheet, then we can estimate the maximum potential for savings through replacing cover sheets with stick-on labels. We observed 43.498 transactions of 2 or more pages, therefore,
up to 43,498 cover sheets could have been saved. There were a total of 183,486 observed faxed pages, meaning that up to 23.8 % of faxed pages are cover sheets. In other words, almost onequarter of transaction time, with its attendant electricity and telephone costs, could be saved by eliminating the cover page and replacing it with a stick-on label; almost one- quarter of the paper consumed by fax operations could also be saved. This potential source of savings was recognized by Haggett [19931.~ The figure of 23.8 % is clearly an upper
estiimate since some users in our sample might already be in the habit of using stick-on labels.
Although more detailed investigation of cover sheet use was outside the scope of this study, it clearly warrants further investigation.
5. Conclusions
The main conclusions drawn from this study are:
Fax machines, like other electronic office equipment, draw considerably less power than their nameplate rating, and exhibit poor power quality. Our measurements on a small sample of machines showed that when idle, they drew between 7 and 30 % of nameplate
rated power, with power factors around 0.5 and total harmonic distortion in the current of over 150 %.
6
Another option, which saves only the paper consumed by cover sheers, is a re-usable, plastic laminate cover sheet [Picton, 19941.
Fax Machines Newsham & Tiller
Fax machines are generally active for only a small fraction of the time they are switched on. Thirty-two machines over a 12 week period were active for an average of only 3.7 %
of the time they were switched on. However, there was considerable variation about this
mean; active time ranged between 18.2 % and 0.2 % of on-time.
The above result suggests the potential for energy savings through power management: an
average of 86.4 % of on-time could be eliminated by automatically switching the fax machine into a sleep mode after 15 minutes of inactivity.
The dollar value of such power management depends on a number of site-specific
parameters. Assuming an electricity rate of 10 GkWh and a fax machine power draw of 25 W, power management could realize savings of around $19 per fax machine per year.
Given a three year pay-back criterion for energy-efficient retrofit, an add-on device for power managing fax machines should cost no more than $60.
Around 9.3 % of fax transactions failed due to transaction errors. Reducing this error rate could save employee time, telephone charges, paper, and energy consumption.
Up to 23.8 % of faxed pages may have been cover sheets. Efforts to reduce the use of cover sheets, perhaps by replacing them with a stick-on label, could realize additional energy and paper savings, and reduce telephone charges.
6. References
BRECSU (1993). Energy efficiency in offices -small power loads. BRECSU Guide 35.
CSA (1992). Technical Information Letter No. B-36B. Canadian Standards Association.
Dandridge, C. (1994). Department of Architecture, MlT, Cambridge, Massachusetts, personal communication.
Feedback (1994). New Scientist, April 2nd, p. 68.
Flavelle, D. (1993). Toronto Star, August 24th. pp. B1-B2.
Gianturco, M. (1992). The $ 188 fax machine. Forbes. March 2nd. p. 106.
Gilleskie, R. J. (1993). Illustrating the power quality aspect of demand side management with
compact fluorescent lamps. Proceedings of IEEE-IAS Annual Meeting (Toronto), Volume 3, pp. 2225-2230.
Far Machines Newsham & Tiller 40
Gutfeld, R (1992). Intel's energy-saving chip will send computers to sleep. Globe and Mail,
November 4th.
Haggett, S. (1993). Fax of cost cutting companies ignore. Financial Post, January 29th, p. 26.
Harris, J. P. (1992). Office technologies and energy. Panel presentation to the Partnership in
Administration Conference (Indianapolis).
Hunkin, T. (1993). Just give me the fax. New Scientist, 13th February, pp. 33-37.
Lovins, A. B., & Heede, R. H. (1990). Electricity saving office equipment. The State of the
An: appliances (Shepard, M. et al.), Chapter 6, pp. 279-450.
Norford, L., & Dandridge, C. (1993). Near-term technology review of electronic off~ce equipment Proceedings of IEEE-IAS Annual Meeting (Toronto), Volume 2, pp. 1355-1362.
NUTEK (1992). Auto turn-off monitors save money and improve working conditions.
Patel, R. F., Teagan, P. W.. & Dieckmann, J. T. (1993). Characterization of commercial
Picton, J. (1994). Toronto Star, March 28th. p. Dl.
Piette, M. A., Eto, J. H., & Harris, J. P. (1991). Office equipment energy use and trends.
Lawrence Berkeley Labs. Report No. 31308.
Quain, J. (1993). Put a computer to sleep and save money. Globe and Mail, October 6th.
Siegel, S., & Castellan, N. J. (1988). Nonparametric Statistics for the Behavioral Sciences.
McGraw-Hill.
Stickney, B. L., & Lovins, A. B. (1992). New power management strategies for personal computers and other office equipment. E SOURCE tech Update, No. 2.
Szydlowski, R. F., & Chvala, W. D. Jr. (1994). Energy consumption of personal computer workstations. PNL-9061, Pacific Northwest Laboratory.
Tiller, D. K., & Newsham, G. R. (1993). Desktop computers and energy consumption: a study of current practice and potential energy savings. Canadian Electrical Association Report No. 9 101 U 829.
Fax Machines Newsham & Tiller 42
Zemos (1993). Automatic power controller Faxmaster. Product literature, Zemos U.S.A., Fremont, CA 94539.
I
ACTIVITY
REPORT
Fax Machines Newsham & Tiller 44
nominal machine id number
Figure 2. The number of days of data received for each fax machine; the machines are
nominal machine id number
Fi y r e 3. The longest string of continuous days of data for each fax machine; the
Fax Machines Newsham & Tiller
machine
id
number
Figure 4. The measured distribution of transactionslweek over the full 12 week period
januar~ f e b ~ march april
receive
*
transmit
Figure 5 (a). Weekly transaction activity for fax machine 1. Each point represents mean activity over the previous week; points on the x-axis represent weeks with no
data. The upper curve is the total transaction activity, and is the sum of the two curves
Far Machines Newsham & Tiller
Figure 5 (b). Weekly transaction activity for fax machine 4. Each point represents
mean activity over the previous week; points on the x-axis represent weeks with no data. The upper curve is the total transaction activity, and is the sum of the two curves
march aprii may june
receive
transmit
TOTAL
Figure 5 (c). Weekly transaction activity for fax machine 9. Each point represents
mean activity over the previous week; points on the x-axis represent weeks for with no
data The upper curve is the total transaction activity, and is the sum of the two curves
Fax Machines Newsham & Tiller 50
receive
transmit
TOTAL
march june
Figure 5 (d). Weekly transaction activity for fax machine 17. Each point represents
mean activity over the previous week; points on the x-axis represent weeks with no data. The upper curve
b
the total transaction activity, and is the sum of the two curvesmarch april -Y iune
receive
transmit
TOTAL
Figure 5 (e). Weekly transaction activity for fax machine 20. Each point represents mean activity over the previous week; poinfs on the x-axis represent weeks with no data. The upper curve is the total transaction activity, and is the sum of the two curves
Fax Machines Newsham & Tiller 1
*-=--
receive
transmit
TOTAL
Y a,!z
\r
3 0c
march april june
Figure 5 (f). Weekly transaction activity for fax machine 21. Each point represents
mean activity over the previous week; points on the x-axis represent weeks with no
data. The upper curve is the total transaction activity, and is the sum of the two curves below it, which plot weekly transmission and reception activity separately.
time
of
day
Figure 6 (a). Mean hourly fax use profile over all 32 machines and 60 weekdays in the
12 week period. The upper curve is the assumed prevailing on-time, in minutes per hour. The lower curve shows the mean minutes per hour for which there was activity.
The middle curve shows the predicted mean on-time if power management automatically switched off fax machines after 15 minutes of inactivity.
Fax Machines Newsham & Tiller
receive
-e-
transmit
+
TOTAL
time
of
day
Figure 6 (b). Mean hourly transaction activity over all 32 machines and 60 weekdays in
the 12 week period. The upper curve represents mean transaction activity, and is the
sum of the two curves below it, which plot mean hourly transmission and reception activity separately.
prevailing
15
mins.
time of day
Figure 7 (a). Mean hourly fax use profile for sub-sample "A" over all 60 weekdays in
the 12 week period. The upper curve is the assumed prevailing on-time, in minutes per
hour. The lower curve shows the mean minutes per hour for which there was activity. The middle curve shows the predicted mean on-time if power management
Fax Machines Newsham & Tiller
receive
time
of
day
Figure 7 (b). Mean hourly transaction activity for sub-sample "A" over all 60
weekdays in the 12 week period. The upper curve represents mean transaction activity,
and is the sum of the two curves below it, which plot mean hourly transmission and
Fax Machines Newsham & Tiller 58
receive
transmit
TOTAL
time
of
day
Figure 8 (b). Mean hourly transaction activity for sub-sample
"B"
over all 60 weekdaysin the 12 week period. The upper curve represents mean transaction activity, and is the
sum of the two curves below it, which plot mean hourly transmission and reception activity separately.
i
-
-
-
.
-
.
a
'
h.
- - -
-
T
time
of
day
prevailing
15
mins
Figure 9 (a). Mean hourly fax use profile for sub-sample "C" over all 60 weekdays in
the 12 week period. The upper curve is the assumed prevailing on-time, in minutes per hour. The lower curve shows the mean minutes per hour for which there was activity.
The middle curve shows the predicted mean on-time if power management automatically switched off fax machines after 15 minutes of inactivity.
Fax Machines Newsham & Tiller
--=--
receive
transmit
TOTAL
time
of day
Figure 9 (b). Mean hourly transaction activity for sub-sample "C" over all 60
weekdays in the 12 week period. The upper curve represents mean transaction activity,
and is the sum of the two curves below it, which plot mean hourly transmission and reception activity separately.
9000
8000
7000
2.
6000
Ks
5000
0-2
4000
3000
2000
1000
mit
0
0
1
2
3
4
5
6
7
8
9 1 0 +
Figure 10. The frequency, over all 32 machines and 12 weeks, of transactions of a given number of pages; the data are sub-divided into transmissions and receptions. Zero
Fax Machines Newsham & Tiller
Figure 11 (a). The normalized frequency distribution over the 12 week period, of receptions of a given number of pages; the data are sub-divided by sub-sample.
Figure 11 (b). The normalized frequency distribution over the 12 week period, of transmissions of a given number of pages; the data are sub-divided by sub-sample.