HAL Id: hal-02998769
https://hal-amu.archives-ouvertes.fr/hal-02998769
Submitted on 6 May 2021
HAL is a multi-disciplinary open access
archive for the deposit and dissemination of
sci-entific research documents, whether they are
pub-lished or not. The documents may come from
teaching and research institutions in France or
abroad, or from public or private research centers.
L’archive ouverte pluridisciplinaire HAL, est
destinée au dépôt et à la diffusion de documents
scientifiques de niveau recherche, publiés ou non,
émanant des établissements d’enseignement et de
recherche français ou étrangers, des laboratoires
publics ou privés.
Distributed under a Creative Commons Attribution| 4.0 International License
types in mouse and human teeth
Jan Krivanek, Ruslan Soldatov, Maria Eleni Kastriti, Tatiana Chontorotzea,
Anna Nele Herdina, Julian Petersen, Bara Szarowska, Marie Landova,
Veronika Kovar Matejova, Lydie Izakovicova Holla, et al.
To cite this version:
Jan Krivanek, Ruslan Soldatov, Maria Eleni Kastriti, Tatiana Chontorotzea, Anna Nele Herdina,
et al.. Dental cell type atlas reveals stem and differentiated cell types in mouse and human teeth.
Nature Communications, Nature Publishing Group, 2020, 11 (1), �10.1038/s41467-020-18512-7�.
�hal-02998769�
Dental cell type atlas reveals stem and
differentiated cell types in mouse and human teeth
Jan Krivanek
1,2,18
, Ruslan A. Soldatov
3,18
, Maria Eleni Kastriti
1,4
, Tatiana Chontorotzea
1
, Anna Nele Herdina
4
,
Julian Petersen
1,4
, Bara Szarowska
1
, Marie Landova
5
, Veronika Kovar Matejova
6
, Lydie Izakovicova Holla
6
,
Ulrike Kuchler
7,8
, Ivana Vidovic Zdrilic
9
, Anushree Vijaykumar
9
, Anamaria Balic
10
, Pauline Marangoni
11
,
Ophir D. Klein
11,12
, Vitor C. M. Neves
13
, Val Yianni
13
, Paul T. Sharpe
13
, Tibor Harkany
1,14
,
Brian D. Metscher
15
, Marc Bajénoff
16
, Mina Mina
9
, Kaj Fried
14
, Peter V. Kharchenko
3
✉
&
Igor Adameyko
1,4,17
✉
Understanding cell types and mechanisms of dental growth is essential for reconstruction
and engineering of teeth. Therefore, we investigated cellular composition of growing and
non-growing mouse and human teeth. As a result, we report an unappreciated cellular complexity
of the continuously-growing mouse incisor, which suggests a coherent model of cell
dynamics enabling unarrested growth. This model relies on spatially-restricted stem,
pro-genitor and differentiated populations in the epithelial and mesenchymal compartments
underlying the coordinated expansion of two major branches of pulpal cells and diverse
epithelial subtypes. Further comparisons of human and mouse teeth yield both parallelisms
and differences in tissue heterogeneity and highlight the specifics behind growing and
non-growing modes. Despite being similar at a coarse level, mouse and human teeth reveal
molecular differences and species-specific cell subtypes suggesting possible evolutionary
divergence. Overall, here we provide an atlas of human and mouse teeth with a focus on
growth and differentiation.
https://doi.org/10.1038/s41467-020-18512-7
OPEN
1Department of Molecular Neuroscience, Center for Brain Research, Medical University of Vienna, Vienna, Austria.2Department of Histology and Embryology, Faculty of Medicine, Masaryk University, Brno, Czech Republic.3Department of Biomedical Informatics, Harvard Medical School, Boston, MA, USA.4Department of Physiology and Pharmacology, Karolinska Institutet, Stockholm, Sweden.5Institute of Animal Physiology and Genetics, CAS, Brno, Czech Republic.6Clinic of Stomatology, Institution Shared with St. Anne’s Faculty Hospital, Faculty of Medicine, Masaryk University, Brno, Czech Republic.7Department of Oral Biology, Medical University of Vienna, Vienna, Austria.8Department of Oral Surgery, Medical University of Vienna, Vienna, Austria.9Department of Craniofacial Sciences, School of Dental Medicine, University of Connecticut Health Center, Farmington, CT, USA. 10Research Program in Developmental Biology, Institute of Biotechnology, University of Helsinki, Helsinki, Finland.11Program in Craniofacial Biology and Department of Orofacial Sciences, University of California, San Francisco, CA, USA.12Department of Pediatrics and Institute for Human Genetics, University of California, San Francisco, CA, USA.13Centre for Craniofacial and Regenerative Biology, Faculty of Dentistry, Oral & Craniofacial Sciences. King’s College London, London, UK.14Department of Neuroscience, Karolinska Institutet, Stockholm, Sweden.15Department of Evolutionary Biology, University of Vienna, Vienna, Austria.16Centre d’Immunologie de Marseille-Luminy, Aix Marseille Université, INSERM, CNRS UMR, Marseille, France.17Department of Neuroimmunology, Center for Brain Research, Medical University of Vienna, Vienna, Austria.18These authors contributed equally: Jan Krivanek, Ruslan A.
Soldatov. ✉email:peter.kharchenko@post.harvard.edu;igor.adameyko@ki.se
123456789
M
ammalian teeth are formed by the ectoderm of the
first
pharyngeal arch and neural crest-derived
ectome-senchyme. Developmental interactions between these
tissue types enable the construction of solid dental
struc-tures composed of epithelium-derived crown enamel and
ectomesenchyme-derived dentin
1–4. In humans, teeth primordia
are formed in utero and complete their growth before adulthood,
at which point the progenitor populations disappear. In contrast
to this, in mice and many other species, teeth can continue to
grow throughout life, providing the major model system to study
progression of various tooth cell lineages from the dental
stem-cell populations located in the apical end of the tooth. In mice, the
incisor stem-cell population continuously self-renews and
replenishes tissues that are lost due to gnawing, making this
model attractive for studies of stem-cell generation, cell
differ-entiation, homeostasis, and injury-induced regeneration. In
addition, the mouse incisor represents a model of continuously
self-renewing organ with cell dynamics conceptually similar to
gut epithelium, hair follicles, and nails. Even though major tooth
cell types have long been identified, the spectrum of rare and
transient cell populations and interactions that enable tooth
growth remain poorly understood. The identity of epithelial and
mesenchymal stem populations and their possible spatial and
functional diversity remains unresolved, especially when it comes
to such populations in growing and nongrowing human teeth.
Besides, whether rodent teeth represent a bioequivalent model
system for studying specific aspects of human tooth development
and physiology is not yet clear. The long held-view is that the
human teeth contain mesenchymal stem cells analogous to mouse
incisor mesenchymal stem cells
5–8. However, at this point, no
clear consensus has been reached about the molecular identity of
such cells in vivo
6,9. In addition, the role and population structure
of other cell types, such as resident cells of the immune system,
is unclear in relation to the maintenance of local tissue
home-ostasis and beyond their major protective function in teeth. There
is growing evidence that macrophages are important constituents
influencing the stem-cell compartments, for instance, in control
of the intestinal stem-cell niche or in promoting wound-induced
hair follicle regeneration
10,11.
Towards answering these questions, we applied single-cell
transcriptomics and lineage tracing techniques with a specific aim
to examine the organizational complexity and self-renewal of
growing mouse incisor, contrasting it with nongrowing mouse
molars, and evaluating the extent to which the mouse model
reflects the growth of human teeth. Our data revealed stem and
differentiated cell subtypes in epithelial and mesenchymal
com-partments and heterogeneity of tissue-residential immune cells in
mouse incisor. We provide a comparative map of cell types
inhabiting mouse and human growing vs. nongrowing teeth.
Results
sc-RNA-seq reveals cell heterogeneity of the self-renewing
mouse incisor. To address the entire course of differentiation of
cell types in the tooth during self-renewal, we
first isolated all
dental tissues from the adult mouse incisor and sequenced
indi-vidual cell transcriptomes with the Smart-seq2 protocol to obtain
high sequencing depth
12(Fig.
1a, b). Clustering using PAGODA
revealed 17 major cell subpopulations (Fig.
1c–e; Supplementary
Figs. 1–3 and Supplementary table 1,2,3 and Supplementary Data
File 1), including the major immune, epithelial, and mesenchymal
compartments. The relative in vivo cell-type abundances might
not be reflective of clusters proportions due to cell isolation biases
and strategies
13. All general cell types show considerable degree of
internal heterogeneity (Supplementary Figs. 1e–g, i, 3)
empha-sizing complexity of interactions and physiological processes in a
growing and self-renewing tooth. We next focused on the most
striking aspects of population complexity of epithelial (Figs.
2–4)
and mesenchymal (Figs.
5–7) compartments, their human
ana-logues (Figs.
8,
9), and
finally immune (Fig.
10) populations.
Heterogeneity of the epithelial compartment in mouse incisor.
The epithelial compartment of the tooth is essential to generate
the enamel, as well as for the morphogenetic guidance of tooth
development and self-renewal. Focused reanalysis of the epithelial
(Krt14 and Cdh1 co-expressing) subpopulation showed a complex
mixture of at least 13 distinct epithelial clusters (Fig.
2a). These
include mature subpopulations, such as enamel-generating
ame-loblasts, and a heterogeneous pool of stem/progenitor cells.
During sequencing, we enriched for epithelial progenitors by
using Sox2-driven GFP in Sox2
GFPanimals and subsequent FACS
of
fluorescent cells. Ameloblasts and enamel development in the
incisor is not restricted to early developmental stages as it is in
molars. Continuous replenishing of enamel is essential for the
incisor growth. Thus, we can
find all the ameloblasts’ stages:
closer to the labial cervical loop we can
find early stages and
closer to the tip more differentiated stages. Differentiation of
ameloblasts starts at the preameloblasts stage (early fate decision
and
first differentiation), then continues through secretory stage
during which the enamel backbone is formed. Subsequently,
the secretory ameloblasts are further differentiated in a
matura-tion phase during which the
first enamel backbone is fully
cal-cified
2. During the last phase, known as a postmaturation phase,
the enamel epithelium diminishes and enamel production is
completed. Consistent with these stages, we observed spatially
separated stages of ameloblast differentiation, including
pre-ameloblasts (Shh
+cluster 11), secretory (Enam
+cluster 5),
maturation (Klk4
+cluster 10) and postmaturation (Gm17660
+cluster 6) stages (Fig.
2a, e, Fig.
4a, c, h, i)
14–16. Our results show
that transitions in gene expression profiles between the canonical
stages are rather abrupt, consistent with the fact that the stages
were previously characterized based on significant morphological
and functional changes during ameloblast differentiation. The
data show progressive modulation of transcription factor
expression during different stages of ameloblast development
(Fig.
4d–f), connecting known spatial and morphological
transi-tions associated with the ameloblast differentiation with
pre-viously uncharacterized intermediate transcriptional states. In
addition to these spatially separated populations, we observed a
subset of RYR2
+cells scattered in the ameloblasts layer (cluster 3)
(Fig.
2a, b). The function of these cells is unknown, however this
population
expresses
different
mechanotransduction-related
genes: Piezo2, Trpm2, Trpm3, and Trpm6 cation channels, as
well as calcium-dependent genes (Itpr1, Ryr1, and Ryr2) (Fig.
3b
and Supplementary Table 1)
17–19. To clarify if these cells can
respond by changing their numbers to the lack of mechanical
load, we clipped the incisor on one side of the jaw to prevent the
usage of this tooth for a significant period of time. This unilateral
tooth clipping experiment did not reveal any changes in the
number and distribution of RYR2
+cells (Fig.
3i).
Other mature populations in the tooth epithelium included
stratum intermedium (clusters 8, 9, and 1) and outer enamel
epithelium (cluster 4), whose functions are poorly understood
(Fig.
2a). The identity of cluster 1 was unclear, but
immunohis-tochemistry using THBD as a marker specific to this population,
revealed that these previously uncharacterized cells reside in a
distinct anatomical structure that we named the cuboidal layer of
stratum intermedium (Figs.
2b,
3g, h). The broader gene
expression signature of these cells (Cygb, Nphs1, and Rhcg)
suggested
that
they
maintain
the
functional
interphase
Such function might be important for proper ameloblasts’ activity
essential for the efficient enamel synthesis.
The repertoire of stem and progenitor cells supporting these
diverse tooth epithelial populations is poorly characterized. A
combination of putative markers for dental epithelial stem cells
(Sox2, Lrig1, Bmi1, Gli1, Igfbp5, and Lgr5) identified from studies of
late embryogenesis
24–28, showed most consistent expression in
a subset of cluster 13 (Figs.
2a,
4b, c, g). Even this small
subpopulation, however, was heterogeneous. For instance, Sox2,
Acta2 and many other genes were specifically co-expressed in a
single cell from the cell subcluster, suggesting a distinct
stem-cell subtype. Indeed, lineage tracing with Acta2
CreERT2/R26
tdTomatoStem cell area Mesenchymal Odontoblasts Odontoblasts Pulp Ameloblasts Epithelial Continuously growing mouse incisor LaCL LiCL Pulp Dentin Enamel Incisor Molars Growth area with stem cells
Glia Endothelial cells Macrophages Lymphocytes Dental pulp Perivascular cells (Pericytes and smooth muscle cells)
Dental follicle cells Alveolar osteocytes Distal pulp Apical pulp Innate leukocytes Ameloblasts OEE SI + SR Lyve1+ macrophages
Cells isolation and single cell sequencing
Validation
Dental cell type atlas
a
b
c
d
Deciphering heterogeneity Cdh5 Plvap Tie1 Ptprb Eltd1 Ecscr Robo4 Ushbp1 Myct1 Podxl COL4 CDH1 DAPI Pulp Blood vessels Aif1 Emr1 Fcgr1 Ly86 C1qa C1qc Cx3cr1 Ms4a7 Ms4a6c Ms4a6b Rgs5 Aoc3 Itga7 Tusc5 Casq2 Aspn Ndufa4l2 Higd1b Rasl12 Olfr558 ACTA2 DAPI erythrocytes Blood vessel Dpp4 Flt3 H2-Oa Klrd1 Tnip3 Cd244 Itgb7 Napsa Gpr132 Map4k1 Pulp Plp1 Sox10 Col28a1 Scn7a L1cam Kcna2 Gfra3 Gpr37l1 Gjc3 Foxd3 SOX10 DAPI Pulp LiCL Fgf3 Sall1 Gsc Notum Thy1 Etv4 Dkk1 Smpd3 Frmd5 Mpped1 Sox9 Tle2 Dlx5 Dlx3 Msx2 Vcan Cox4i2 Olfml1 Twist2 Scube1 LaCL DLX5 DAPI Pulp Cdh1 Col17a1 Fxyd3 Dsc3 Pitx2 Isl1 Trp63 Dsp Krt14 Ckmt1 CDH1 SOX9 DAPI LaCL Pulp Dmp1 Spp1 F2rl2 Stac2 Ibsp Bmp3 C1qtnf7 Mdga2 Bmp8a 5430421F17Rik Incisor Molar Alveolar bone DMP1-Cherry Aldh1a2 Gdf10 Foxc2 Cnn1 Acta2 Ntn1 Pdzrn4 Ltbp2 Hpse2 Podnl1 ACTA2 DAPI LaCL Pulp MacrophagesDental epithelium (Pre-) Odontoblasts
Dental follicle Alveolar bone
Dental pulp cells Glia
NK-cells, T-cells Endothelial cells Perivascular cells
e
Dentin Odontoblasts Pulp AIF1 COL4 DAPI SALL1 DAPI LaCL Pulp DPP4 COL4 DAPI Expression level Low High Dental epithelium (pre)odontoblastsFig. 1 Unbiased identification, validation, and spatial mapping of major dental cell types and subpopulations. a Schematic drawing of continuously growing mouse incisor with highlighted stem-cell area.b Cell dynamics during self-renewal and growth based on the activity of the dental epithelial and mesenchymal stem cells.c Unbiased identification of dental cell types and subpopulations. t-SNE dimensional reduction visualizes the similarity of the expression profiles of 2889 single cells (individual points). Colors demonstrate 17 clusters as defined by PAGODA clustering. All major clusters correspond to cell types in the mouse incisor, defined by expression of known markers. d Schematic drawing summarizing validation and mapping of the observed cellular subpopulations back onto the incisor tissue preparations.e Validations and mapping of unbiasedly identified populations based on the expression of selected marker genes. All validations were performed by immunohistochemistry except of alveolar bone panel where DSPPcerulean/DMP1Cherrymice was used (only red channel showed). Note. SOX9 is well-known marker for pulp cells, COL4 for blood vessels, CDH1 for epithelium, and ACTA2 for dental follicle (and perivascular cells). All these marker genes are highly and specifically expressed in corresponding clusters (Supplementary Table 1), but do not belong to top10 genes shown in plots above the images. (LiCL Lingual Cervical Loop, LaCL Labial Cervical Loop, SI Stratum Intermedium, SR Stellate reticulum, OEE Outer Enamel Epithelium). Scare bars: 50µm.
Am. Post-maturation Gm17660 Slc5a8 Ptpn22 Am. Maturation Klk4 Gpr155 Slc34a2 Am. Secretory Enam Amelx Ctnna2 Preameloblasts Col22a1 Vwde Kif5c Stellate reticulum Vat1l Fam19a4 Hey2 Stratum intermedium Rab3il1 Pmch Cyp2s1 OEE progenitors Fos Egr1 Vrtn Outer enamel epithelium Slco4a1 Th Amer1 SFRP5+ progenitors Sfrp5 Grp Rhoc SI progenitors Cdh6 Lrp11 Cpne5 Stratum intermedium Psmb10 C1qb Ibsp Cuboidal layer of SI Thbd Gnrh1 Jph4 Differentiation trajectory of ameloblasts
Identification of previously unrecognized OEE progenitors Identification of previously unrecognized
epithelial subtypes Apical Distal Fos Ryr2 Thbd Putative Lgr5+ SC’s Lrig1 Disc1 Fez1 8 4 1 2 3 5 6 7 9 11 12 13 10 Mitotic cells Pseudotime Cuboidal layer THBD DAPI SI LaCL SI RYR2 DAPI am.
In-depth single cell analysis of dental epithelium
Am. Ryr2+ Ryr2 Mylk Sox5 I C i n t e n s i t y L o w H i g h Expression level Low High
a
b
e
c
f
3 days traced LaCL pulp 10 days traced LaCL pulpIncisors from adult FosCreERT2/R26ZsGreen1mice
c d c d Expression level Low High Egr1 ACTA2 DAPI Acta2
Mandibular incisor from adult Acta2 CreERT2/R26tdTomatomice traced for 2 months
Calb1 tdTomato DAPI CALB1 Distal Apical CL Incisor
d
Slc38a1 Ccnd1 Shh Vwa2 Fzd3 Igsf9 Gdf5 Chst1 Ckb Stac3 Sox21 Klk4 Gpr155 Gad1 Gm17,660 Ptpn22 Dsg3 Vit Slc1a1 Ptchd4 Slc39a2 Slc24a4 Wisp1Fig. 2 In-depth single-cell analysis of dental epithelium. a t-SNE dimensional reduction shows subpopulations of 268 single epithelial cells. 13 unbiased clusters (colors) reveal previously unrecognized stem, progenitor and mature epithelial subtypes. Inset: mitotic signature as defined by average expression of cell-cycle-related genes.b Identification of a previously unrecognized cellular subtypes of epithelial layer. RYR2+cells in ameloblasts’ layer and THBD+ subpopulation of stratum intermedium organized into cuboidal layer found by immunohistochemistry.c Panel on the right shows localization of ACTA2-expressing cells inside the labial cervical loop (immunohistochemistry) and corresponding expression of Acta2 predicted from RNA-seq analysis (left panel).d Long-term (2 months) lineage tracing of a Acta2CreERT2/R26tdTomatodental epithelial stem cells shows the traced cells in both apical (near the cervical loop) and distal ameloblasts. Ameloblast character was proved both morphologically and by expression of CALB1 (immunohistochemistry). e Transcriptional program of ameloblasts differentiation. Four clusters corresponding to different stages of ameloblasts maturation (upper). Transcriptional states of ameloblasts progenitors were modeled as a single trajectory, which reveals sequence of cell state transitions and linked activity developmental gene modules (bottom). Heatmap: the cells (columns) are arranged according to estimated pseudotime, genes (rows) were clustered in nine modules. Smoothed gene expression profiles are shown. f Transient progenitor population found in labial cervical loop is demarcated by the expression of Egr1 and Fos. Panels in the bottom part shows the lineage tracing of FosCreERT2/R26ZsGreen1. Insets show the lineage traced cells in outer enamel epithelium. Of note, FosCreERT2/R26ZsGreen1traced cells in epithelial and mesenchymal compartments are of distinct origins since compartments are spatially separated. (LaCL Labial Cervical Loop, SI Stratum Intermedium, Am. Ameloblasts). Scale bars:b, d, e: 50µm; c and insets of e: 10 µm.
mice traced ameloblasts and other cell types of dental epithelium in
adult animals after 3 days, 2 weeks, 1 month and 2 months after
tamoxifen injection (Figs.
2d and
3f). The presence of ACTA2
+cells
was confirmed by immunohistochemistry (Fig.
2c) in the outer half
of stellate reticulum, outer enamel epithelium and dental follicle.
Lineage tracing data using the Acta2
CreERT2/R26
tdTomatomice
appeared consistent with this immunohistochemical staining. In
the short-term lineage tracing experiment (3 days), numerous cells
appeared traced within dental epithelium. However, the mature
ameloblasts were not traced, which is different from long-term
lineage tracings (1−2 months), where mature ameloblasts are
robustly detected (Figs.
2d,
3f). At the same time, the overall
numbers of all traced cells decreases over time because these cells are
being replaced by the progeny of non-labeled stem cells. Only a
small fraction representing traced epithelial cells is derived from
ACTA2
+epithelial stem cells, which retain self-renewing capacity
and can produce a minor proportion of epithelial progeny
constantly during incisor self-renewal.
The expression patterns of the epithelial stem-cell markers show
partial overlap with diverse clusters of proliferating progenitors.
These include Shh
+cells
25,29(Sox2
+/Shh
+clusters 12 and 2, as
well as more differentiated Sox2
−/Shh
+clusters 11, 5, 1, 13;
Figs.
2a,
4c). Expression of Egr1 and Fos in cluster 7 suggested a
distinct type of an epithelial progenitor. Immunohistochemistry
labelling showed that Egr1
+epithelial cells were positioned
adjacent to the stem-cell niche (Figs.
2f,
3c). Lineage tracing in
Fos
CreERT2/R26
ZsGreen1mice revealed epithelial progeny inside the
cervical loop, and predominantly in the outer enamel epithelium
10-days after the induction of lineage tracing in Fos
CreERT2/
R26
ZsGreen1mice (Fig.
2f). These Egr1
+/Fos
+cells, thus, although
being Sox2 negative, represent a long-lasting progenitors that
disappear after 1 month of the lineage tracing from the cervical
Egr1 Piezo2 Gjb3 Cldn10 CLDN10 DAPI SI am. Gjb3 LaCL pulp LaCL pulp OEE Igfbp5 Igfbp5 am. SI PDL THBD DAPI am. SI PDL THBD COL4 DAPI CDH1 COL4 DAPI am. PDL SI CDH1 COL4 DAPI EGR1 DAPI SI PIEZO2 DAPI am. od. LaCLa
b
c
d
e
f
g
h
3 days 2 weeks 1 month
Acta2 CreER T 2/R26 tdT omato
Adult mandibular incisors traced for
i
RYR2+ cellsafter tooth clipping
Healthy Clipped
R
YR2+ cells per FOV
20
15
10
5
0
Fig. 3 Identification of previously unrecognized cell types in dental epithelium and stem cells. a–e In situ hybridization (Igfbp5, Gjb3) and
immunohistochemistry (PIEZO2, EGR1, and CLDN10) validations of selected markers demarcating different progenitor and differentiated states in epithelial layer. Note: Validation of expression of Igfbp5 enables identification of outer enamel epithelium clusters on a t-SNE representation (a). Validation of PIEZO2-expressing cells shows sporadic cells inside the ameloblast layer (b). Egr1+cells are present in the progenitor area on the edge of stellate reticulum and outer enamel epithelium (c). Mapping of Gjb3 on the section tissue consistently reveals the position in stellate reticulum within the labial cervical loop (d). Validation of Cldn10 expression helps to outline all non-ameloblastic parts of epithelial differentiation including developing stratum intermedium and outer enamel epithelium (e). f Acta2CreERT2/R26tdTomatogenetic tracing shows significant contribution of Acta2+cells of the labial cervical loop to more differentiated cell types of dental epithelium including ameloblasts, stellate reticulum, outer enamel epithelium, and stratum intermedium after 3 days, 2 weeks, and 1 month long tracing period.g, h Immunohistochemistry identification of the Cuboidal layer of stratum intermedium (expressing THBD) and spatial relation to the neighboring blood vessels submerged into the papillary structure of stratum intermedium. COL4 expression characterizes the blood vessels on left panel.h Papillary structure of stratum intermedium with submerged blood vessels (COL4) and CDH1 expressing ameloblasts and cells from stratum intermedium. Note. Cuboidal layer characterized by THBD expression (g) forms subpopulation of stratum intermedium cells (h).
Immunohistochemistry.i Comparison of RYR2+ameloblasts in healthy (mean 6.71 ± 0.93 SEM per FOV, Field Of View) and unilaterally clipped (mean 6.04 ± 0.61 SEM per FOV) mouse incisor. Counts of RYR2+ameloblasts per FOV are plotted, and the color-code of dots corresponds to 3 individual animals per healthy or clipped condition. (am. ameloblasts, od. odontoblasts, LaCL Labial Cervical Loop, SI stratum intermedium, OEE Outer Enamel Epithelium, am. Ameloblasts, PDL periodontal ligamentum). Scale bars: 50µm.
loop, and that are fate-biased towards outer enamel epithelium.
Overall, our analysis of the epithelial compartment revealed a
complexity of stem, progenitor and mature cell types, many of
which were previously unknown and provide opportunities for
further characterization.
Heterogeneity of the mesenchymal compartment in mouse
incisor. Mesenchymal cell types in teeth build cementum, dentin,
and soft tissue of pulpal cavity, and have diverse spatial
locali-zations inside and around the tooth. Our data revealed that the
tooth is surrounded by two subtypes of the dental follicular cells
Am. Post-maturation Gm17660 Slc5a8 Ptpn22 Am. Maturation Klk4 Gpr155 Slc34a2 Am. Secretory Enam Amelx Ctnna2 Preameloblasts Col22a1 Vwde Kif5c Stellate reticulum Vat1l Fam19a4 Hey2 Stratum intermedium Rab3il1 Pmch Cyp2s1 OEE progenitors Fos Egr1 Vrtn Outer enamel epithelium Slco4a1 Th Amer1 SFRP5+ progenitors Sfrp5 Grp Rhoc SI progenitors Cdh6 Lrp11 Cpne5 Stratum intermedium Psmb10 C1qb Ibsp Cuboidal layer of SI Thbd Gnrh1 Jph4 Putative Lgr5+ SC’s Lrig1 Disc1 Fez1 8 4 1 2 3 5 6 7 9 11 12 13 10 Am. Ryr2+ Ryr2 Mylk Sox5 Lgr5 Lrig1 Sox2a
b
d
Selected known SC markers Mitotic cells
g
Population hierarchy
Lgr5
20 genes with similar expression pattern
Sox2
20 genes with similar expression pattern
TAC’s SC’s
Sox2, Bex1, Six1
MoxD1, Sox11, Etv4 Ascl5 Sox21 FoxQ1, FoxO1, Cdkn2b, Runx2 Mafb Ell2, Satb2 Klf5, Prdm1
SR Pre-Am. Secr. Mat. Post.
Transcription factors during ameloblast’s differentiation
e
f
Bex1 Cdkn2b Ell2 Etv4 Foxq1 Klf5 Moxd1 Sox21 Ascl5 Foxo1 Mafb Prdm1 Satb2Six1 Sox2 Sox11
c
Enam Klk4 Odam Gm17660h
i
Mki67 Shh Bex1 Cdkn2b Ell2 Etv4 Foxq1 Klf5 Moxd1 Sox21 Ascl5 Foxo1 Mafb Prdm1 Satb2 Six1 Sox11 Sox2 Runx2 Sfrp5 Clcnkb Arhgef33 Gm1110 Icam2 Ccdc80 Vsig2 Pla2g4a Fez1 Cd27 Prob1 Spock1 Grp Pcp4 Pknox2 Lgr5 Zscan10 Disc1 Slc35f3 Lrig1 Lgr5 Sox2 Mki67 Ccdc112 Dlgap5 Bex1 Gstm2 Ccdc34 Rfc4 AA465934 Moxd1 Myh10 Uhrf1 Cks1b Rrm2 Trpm4 Mex3a Gjb3 Mdk Rad54b Gins2 Dtl Klk4 Gm17660 Enam OdamSelected known ameloblasts’ markers Selected known ameloblasts’ markers
Trpm5
and is encapsulated by the alveolar bone (Fig.
6e–h,
Supple-mentary Fig. 3a, and SuppleSupple-mentary Table 1)
27,30,31. The dental
follicle populations express Aldh1a2 - the key enzyme for retinoic
acid production (Supplementary Fig. 3a, b). Retinoic acid, being a
key morphogen, is known to control dental development and
self-renewal
32,33. Correspondingly, complementary receptor genes
Rara, Rarb, and Rarg are expressed in some of the major
popu-lations of the tooth itself (Supplementary Fig. 3a, b). This suggests
previously unanticipated crosstalk between retinoic acid
produ-cing and sensing populations in incisor growth and maintenance.
Inside, the incisor contains a continuously replenished
mesenchymal compartment, comprised of odontoblasts producing
dentin (the most abundant type of hard matrix in teeth), and
heterogeneous sets of pulpal cells whose role and subtypes remain
to be understood from the functional point of view. Smart-seq2
data showed at least three major mesenchymal populations inside
of the mouse incisor: odontoblasts and two distinct pulp subtypes,
all connected by a continuum of transient cell states (Fig.
5a, b).
The
first pulp subtype, constitutively expressing Smoc2 and Sfrp2,
is localized specifically to the apical pulp in the area between
cervical loops according to validation experiments (Fig.
6d, f).
Expression of genes linked to self-renewal properties in the incisor
mesenchyme (Thy1 and Gli1) was restricted to cells of apical
subtype (Fig.
6a)
27,34. However, dividing cells (Mki67
+) are mostly
segregated to a distinct heterogeneous transcriptional
subpopula-tion localized in the pulp near the cervical loops, as evident from
Fgf3 and Foxd1 expression (Fig.
6a–c). This indicates that apical
pulp subtypes include diverse pools of quiescent stem cells and
stromal cells likely supporting the stem-cell niche. The other pulp
subtype corresponded to incrementally differentiating distal pulp
cells
finally labelled by the expression of Igfbp5 and Syt6 (Fig.
6d).
Transcriptional trajectory modelling of the three mesenchymal
populations, predicted a central branchpoint at a subpopulation
with a strong mitotic signature, suggesting a likely active pool of
stem/progenitor cells within the mesenchymal compartment
(Figs.
5a–c,
6g)
27,35. The potential area of active progenitors was
corroborated by RNA velocity (Fig.
5b)
36.
To improve the resolution of the active stem/progenitor
subpopulation, we profiled mouse incisor by sequencing a larger
number of cells using the 10× Chromium platform, which
recovered the same mesenchymal landscape and overall
popula-tion structure (Supplementary Fig. 4e, h). Branch analysis showed
that transcriptional programs of the three populations were
activated in a mutually exclusive manner in individual cells,
without a notable multilineage primed state (Fig.
6h)
37. A small
fraction of the dividing cells showed activation of
population-specific transcriptional biases, including an odontoblastic
pro-gram. Obtaining cells of odontoblast sublineage became possible
because we enriched for it by using Dspp
cerulean/Dmp1
Cherrytransgenic animals
38. The immunohistochemistry confirmed
activation of early odontoblast markers Notum and Sall1 in the
near cervical loop mesenchymal area, indicating that odontoblast
fate selection happens before embedding into the odontoblastic
layer (Figs.
5g, i.
7g). However, it is not clear if all Notum- and
Sall1-expressing progenitor cells always irreversibly and
selec-tively commit to the odontoblast fate or these factors convey a
strong bias towards odontoblast differentiation. This goes in-line
with the previously established fact that proximity of a stem cell
to the epithelial compartment was shown to modulate selection of
odontoblast fate, indicating the extrinsic signal from epithelium
might induce odontoblast program
39. This initial fate selection
step, as well as clear transcriptional progression through at least
three spatially separated stages of odontoblast differentiation
provide a useful resource for ongoing efforts for targeted
differentiation of odontoblasts (Fig.
5g,
7e–i).
Analysis of the apical progenitor subpopulation demarcated
several axes of transcriptional heterogeneity that could identify
programs specific to progenitor pools, one of which is marked by
Foxd1 expression (Figs.
5d,
7a–c). In situ hybridization confirmed
the expression of Foxd1 exclusively near the labial cervical loop
area (Fig.
5d). A fraction of these cells is mitotic (Fig.
7d). To test
whether Foxd1 expression designates a functionally distinct
subpopulation of biased stem cells residing in apical area, we
performed lineage tracing using Foxd1
CreERT2/R26
tdTomato.
Indeed, we found that Foxd1-traced cells gave rise predominantly
to periodontoblastic pulp cells and dentin-secreting odontoblasts
(Fig.
5e, f). Even after 3-months-long tracing, Foxd1-traced cells
in the apical stem-cell area were detected only near the labial
cervical loop revealing a spatially restricted structure of
self-renewal pathway in the mouse incisor (Fig.
5e). Thus, the initial
position of stem cells along the central-periodontoblastic axis is
associated with its transcriptional state, migratory trajectory, and
fates of progeny (Fig.
5c).
Comparisons of composition of growing vs. nongrowing
mouse teeth. Although the mouse incisor stands as a model for a
growing tooth, molecular features that distinguish it from
non-growing teeth remain unexplored. Therefore, we generated
single-cell transcriptional snapshots of a nongrowing adult mouse molar
using both 10X Chromium and Smart-seq2 platforms. To
lever-age total scale of multiple datasets, we analysed them jointly and
together with self-renewing incisor datasets using Conos data
integration strategy (Supplementary Fig. 4)
40. Coarse-grained
cell-type composition appeared similar between molar and
inci-sor, except for the lack of epithelial populations in adult molars
(Supplementary Fig. 4a–c). However, molar pulp appeared
Fig. 4 Extended analysis of the heterogeneity of dental epithelial subtypes. a t-SNE dimensional reduction visualizes the similarity of the expression profiles of 268 single dental epithelial cells. Thirteen unbiased clusters shown by different colors including revealed stem, progenitor and mature epithelial subtypes.b Previously unrecognized identified stem-cell subpopulation shows expression of Lgr5, Lrig1, and Sox2. Unlike Lgr5 and Lrig1, Sox2 is more widely expressed also in TAC’s (also shown in panel g). c Shh is expressed in the progenitor populations including the stellate reticulum, stratum intermedium progenitors or preameloblasts (clusters 2, 11, and 12).d–f Transcriptional factor code associated with ameloblasts differentiation. f Schematic drawing summarizing expression of various selected transcription factors in different stages of ameloblasts development.g Heatmap showing the expression of mitotic and stem-cell markers within identified clusters of dental epithelial cells. Population hierarchy axis colors resemble the same populations on tSNE from panela. Note that some of previously described stem-cell markers: Lrig1, Sox2, Bmi1, Gli1, Lgr5, or Igfbp5 are co-expressed only within a subcluster of cluster 13. This subcluster possesses a unique and extensive multigenic signature, including previously unknown markers Pknox2, Zfp273, Spock1, and Pcp4. The putative DESCs from cluster 13 might represent one type of epithelial stem cells in the tooth. The listed stem-cell markers show reasonably large and partly overlapping domains of expression that coincide with clusters containing proliferating progenitors. Sox2+DESCs give rise to Shh+populations including transient amplifying cells (TAC’s) in the epithelial compartment. In agreement with that, we observe that the Sox2+/Shh+clusters 12 and 2 contain the majority of TAC’s and most likely represent less differentiated states as compared to Sox2-/Shh+clusters 11, 5, 1, and 13.h, i Expression of well-known markers corresponding to a different ameloblast stage proving the gradual differentiation from secretory ameloblasts stage (Enam+) through maturation ameloblast stage (Klk4+, Odam+) into postmaturation ameloblast stage (Gm17660+).
significantly more homogeneous as compared to the pulpal
populations of the incisor given the resolution of the current
measurements. Joint Conos clustering of incisor and molar
datasets shows that molar mesenchyme falls into a single cluster
shared with the distal mouse-incisor pulp (Supplementary Fig. 4a,
b). Analysis of mesenchyme heterogeneity using separately 10×
and Smart-seq2 platforms corroborated the heterogeneous
population structure of mouse incisor and homogeneous
distal-like population of mouse molar (Supplementary Fig. 4d, e). At the
same time, gene expression programs of mouse molar and distal
incisor pulp have noticeable expression differences in 379 genes
(p value < 10
−2, t-test group means comparison and at least two
fold change in both Smart-seq2 and 10× Chromium datasets)
(Supplementary Fig. 4f). Mouse-incisor apical genes tend to show
high expression in a Smoc2
+compared to Smoc2
−human apical
papilla. On the other hand, mouse-incisor distal genes tend to
show high expression in a Smoc2
−and not Smoc2
+human apical
papilla. In adult teeth, mouse-incisor distal genes are uniformly
pulp od. am. pre-od. am. pulp LaCL SALL1 DAPI od.d
Late odontoblasts Dspp Dmp1 Nupr1 Early odontoblasts Wisp1 Col24a2 Slc8a3 Near-CL area Odontoblasts d ifferen tiatio nIdentification of FoxD1+ stem cells
FoxD1CreERT2/R26tdTomatolineage tracing
c pulp LaCL 5 Days pulp LaCL 1 Month Lypd1 Hsd11b2 Hhip Sostdc1 Foxd1 Shisa2 Pcp4 Dcbld1 Tnc Perp S100a10 Postn IC5 Foxd1 DAPI
g
Odontoblast branch analysis Progression of odontoblasts differentiantion
i
Odontoblasts Apical pulp Distal pulp Near LaCL areab
30 20 10 0 -10 -20 -20 -10 0 10 20c
Model of stem cell dynamics in the mouse incisor pulp
Sall1 Smpd3 Nupr1 Dkk1 Wisp1 Smpd3 Nupr1 3 Months dentin 3 Months pulp LaCL od. distal pulp dentin Wnt6 Wnt6 tdTomato SALL1 DAPI
FoxD1CreERT2/R26tdTomatovalidation of progeny on 1 month lineage traced animals
tdTomato SOX9 DAPI
e
a
h
f
Expression level Low High Wisp1 Dkk1 Pre-odontoblasts Sall1 Notum Dkk1In-depth single cell analysis of dental mesenchyme
-30
Fig. 5 Developmental dynamics of dental mesenchyme. a Analysis of mouse-incisor dental mesenchymal cells isolated for separate analysis from general dataset. Colors show unbiased clusters. The principal tree correctly captures positions of mature mesenchymal derivative and progenitor populations. b Analysis of RNA velocity shows major directions of cell progression in the transcriptional space. The arrow start- and endpoints indicate current and predicted future cell states.c Model of stem-cell dynamics in mesenchymal compartment with relation to dental follicle. d Prediction and validation of spatially restricted Foxd1+stem cells. The Foxd1-associated axis was selected for validation, and is shown on t-SNE (genes with the strongest positive and negative associations are shown in red and blue respectively). Foxd1+cells (in situ hybridization) are located in the mesenchyme surrounding the labial cervical loop.e Lineage tracing of FoxD1CreERT2/R26tdTomatostrain confirmed the predicted stem-cell nature of Foxd1+mesenchymal cells. In short-term tracing (5days) tdTomato+cells are predominantly around LaCL in contrast to long-term (1-month-long and 3 months) tracing where pulp and odontoblast progeny are observed. Importantly, tdTomato+cells are maintained in their original position in the long-term manner (3 months) and at the same time point tdTomato+distally located odontoblasts can be observed supporting the theory of Foxd1+cells being a long-living mesenchymal stem cells.f Nature of Foxd1+cells progeny confirmed by a combination of FoxD1CreERT2/R26tdTomatotracing and SALL1 and SOX9 immunohistochemical stainings. FoxD1CreERT2/R26tdTomato-traced cells contribute to both the SALL1+odontoblasts (arrows) and SOX9+pulp cells (arrowheads). Asterisks show the of subodontoblast layer FoxD1CreERT2/R26tdTomatotraced cells.g Variability of cells assigned to a branch leading to odontoblasts (inset) was reanalysed using principal component analysis. Colors markfive clusters obtained by unbiased hierarchical clustering. Left-right axis reflects developmental stages of odontoblasts.h Gradual odontoblast differentiation (suggested in g) from near-CL area into fully differentiated odontoblasts. Left: expression pattern acquired from scRNA-seq, right: in situ hybridization-based histological validations of the proximal part of the mouse incisor proving suggested gradual transition.i Spatial pattern of a discovered (pre)odontoblast transcription factor—SALL1 (Immunohistochemistry). (LaCL Labial Cervical Loop, pre-od. preodontoblasts, Od. Odontoblasts, Am. Ameloblasts). Scare bars: 50µm.
expressed in all populations, but incisor apical genes show the
affinity to the periodontoblastic pulp. The meaning of this
het-erogeneity is unknown and requires further investigation.
Alto-gether, these results support aetiology of the apical subtype in the
incisor as stromal and quiescent cells of the niche, the structure
absent in the nongrowing molar. We thus, suggest that the
distal-like subtype is a constitutive terminally differentiated population,
while the apical pulp state is an emergent property of growing
mesenchymal dental tissue. Importantly, the apical incisor pulp
shows a coherent expression of genes involved in regenerative
response in a tooth and production of a hard matrix in case of
physical damage (Sfrp2, Lef1, Fzd1, Sfrp1, Rspo1, Trabd2b, Gli1,
and Wif1)
41, which is much less present in the pulp populations
found in molars (Supplementary Fig. 4d, e).
Parallels and differences between growing and nongrowing
human teeth. The studies of mouse incisor are generally
moti-vated by the translational insights on human tooth development.
In humans, the growth of teeth stops postnatally after permanent
teeth erupt between 6–21 years of age (eruption of the 3rd molar
is variable). To determine the extent to which the observed pulp
contrast between growing and nongrowing teeth in mouse reflects
human biology, we conducted single-cell profiling of 39,095 cells
from healthy nongrowing and growing wisdom teeth in humans
(Figs.
8,
9). To focus on the growth-relevant populations, the
cells were isolated from the apical papilla located in most apical
part of developing wisdom tooth where the tooth is still growing.
The analysis revealed that human teeth contain cell types
ana-logous to those in mice, including vascular and perivascular cells,
glia and immune populations, and distinct subpopulations of
pulp cells (Figs.
8a–d,
9a, b).
Human pulp cells significantly differ between the growing apical
papilla and nongrowing molar, and form at least several
transcriptionally distinct subpopulations (Fig.
8c, d). In that regard,
the pulp of human nongrowing molars appeared to be much more
transcriptionally diverse compared to the mouse nongrowing
molars. In particular, human molar contained a pulp subpopulation
that was spatially localized in the periodontoblastic layer, previously
morphologically described as cell-free and cell-rich zones, which are
absent in mouse (Fig.
8i)
42. We detected a group of proliferative cells
g
Mapping to the pulp Sfrp2 Foxd1 DAPI SMOC2 DAPI SOX9 DAPI Mutually-exclusive programs Mitotic cells (pre)odont. Distal pulp Apical pulp Dental follicled
f
h
Pulp Follicle SMOC2 DAPI pulp LaCL Syt6 Igfb5Smoc2 Igfb5 Syt6 Tac1 Tac1
e
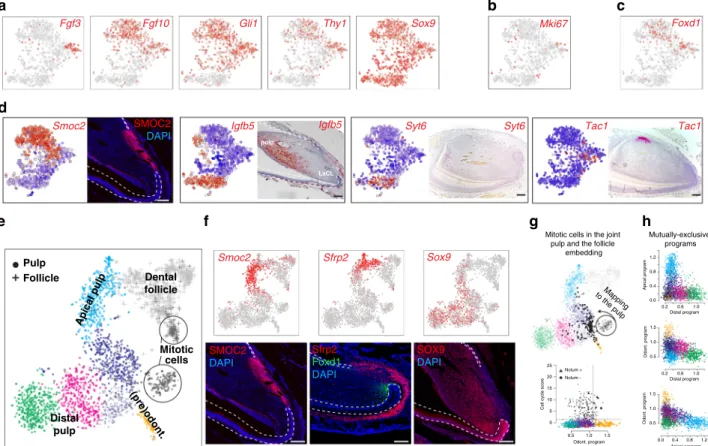
Fgf3 Fgf10 Gli1 Thy1 Sox9 Mki67 Foxd1
a
b
c
Sox9 Sfrp2
Smoc2
Mitotic cells in the joint pulp and the follicle
embedding
Apical program
Distal program
Odont. program
Odont. program
Cell cycle score
Odont. program Notum + Notum -1.2 0.8 0.4 0.0 0.2 0.6 1.0 1.5 1.0 0.5 1.5 1.0 0.5 Apical program Distal program 0.2 0.6 1.0 0.0 0.4 0.8 1.2 0.5 1.0 1.5 25 20 15 10 5 0
Fig. 6 Portrait of transcriptional heterogeneity in dental mesenchymal populations. a t-SNE representations of selected, previously known marker genes. b t-SNE representation showing position of Mki67+cells.c t-SNE representation showing position of Foxd1+cells.d Immunohistochemistry (SMOC2) and in situ hybridization (Igfbp5, Syt6, and Tac1) characterization of key populations in the mesenchymal population. Importantly, Igfbp5 and Syt6 demarcate more distal pulp and Tac1 is a unique marker for dental pulp attached to the lingual cervical loop.e Landscape of mesenchymal cells of dental pulp (dots) and follicle (crosses) is reproduced and extended with 10× Chromium. t-SNE embedding shows 2552 mesenchymal cells grouped in clusters, where clusters colours reflect colours of annotated Smart-seq2 pulp clusters (see Fig.3a). Of note, cells from apical pulp gradually extend into cells of dental follicle.f Experimental validations of gradual spatio-transcriptional gradient from apical pulp to dental follicle. Immunohistochemistry of SMOC2 highlights the position of the apical pulp state, corroborated by Smart-seq2 and 10× Chromium single-cell datasets. In situ hybridization of Sfrp2, consistent with 10x Chromium and Smart-seq2 t-SNE representations, labels coherent states between apical pulp and dental follicle. Immunohistochemistry for SOX9 labels all pulp cells but not odontoblasts or dental follicle.g In silico mapping of mitotic cells onto non-mitotic landscape pinpoints progenitor states of active cell division (upper). To remove effect of mitotic program, mitotic cells were re-positioned as average of 10 transcriptionally similar non-mitotic cells. Comparison of intensity of odontoblast (lower, X-axis) and cell cycle (lower, Y-axis) programs in each cell reveals a subset of mitotic cells with activated odontoblast program (lower). Dashed lines demarcate cells with active programs.h Mutually exclusive activation of fate-specific programs (odontoblasts, distal and apical fates). An estimate of activity of fate-specific programs in each cell was based on average expression of 20 fate-specific markers. Comparison of pairs of fates (three panels of fate pairs) shows activation of only one of fates indicating lack of noticeable multilineage priming.
in a growing human apical papilla, which showed pronounced
transcriptional similarity to a Smoc2
−human apical papilla pulp,
and dissimilarity with any subpopulations of nongrowing human
molars (Figs.
8e–g,
9e, g). To explore similarity of genetic programs
in a mesenchymal compartment of human and mouse teeth, we
compiled a set of marker genes that are differentially expressed
between apical and distal mouse-incisor subtypes in both
Chromium 10x and Smart-seq2 datasets (Supplementary Table 4).
Assessment of average expression of marker genes of apical and
distal incisor pulp subtypes showed their preferential expression in
corresponding populations of human pulp cells (Fig.
9f, h). In
particular, similar to incisor apical pulp, Smoc2
+human pulp cluster
tends to express apical incisor markers and repress distal incisor
markers. Immunostaining reveals localization of Smoc2
+human
subtype to mesenchymal regions demarcating apical papilla around
the Hertwig epithelial root sheath (Fig.
8e, f). Overall, these
data indicate that Smoc2
−and Smoc2
+human pulp subtypes might
form a maturation hierarchy similar to that in mouse incisor.
a
b
1.0 0.8 0.6 0.4 0.2 Pseudotime Tnc Postn Moxd1 Twist2 Alx3 Etv4 Tgfbr2 Klf4 Bmp4 Msx2 Fam20a Wif1 Wnt10a Notum Dkk1 Sall1 Fgf10 Gsc Wnt6 Wisp1 Col1a1 Ifitm5 Odontoblasts branch differentiationOdontoblast precursors Odontoblasts
e
NOTUM DAPI pulp od. Notum Sall1 Sall1d
f
g
h
i
non-mature pulp cluster progenitor population likely biologically driven ICs
commited to preodontoblasts
IC 1
stability
IC
shuffled expression matrix
Cell cycle score
Foxd1 expression Col1a1 Notum Dspp Dmp1
c
IC 2 Igfbp3 BhIhe41 Thbs4 Gpx3 H19 Dio3 Omd Lum Rspo4 Col12a1 Vit Cthrc1 Mcm5 Fam111a Mcm10 Chaf1b Cdc6 Cdk1 Rdh10 Sox9 Nell1 Cpm Prss35 Enpp2 Nts Wif1 Lef1 Nrp2 Dock10 Nr4a2 Gfra2 Ecel1 Fgf3 Nell1 Arpc5 Lypd1 Xist Trrap Col6a3 Arhgef17 MII1 Usp34 Ifngr1 Csf1r Cxcl12 Ano6 Scoc Dkk3 Lypd1 Hsd11b2 Hhip Sostdc1 Foxd1 Shisa2 Pcp4 Dcbld1 Tnc Perp S100a10 Postn IC 3 IC 4 IC 5 0.0 1 3 5 7 9 11 13 15 17 19 1.0 0.8 0.6 0.4 0.2 0.0 25 20 15 10 5 0 0.0 0.5 1.0 1.5 IC 1 3 5 7 9 11 13 15 17 19Fig. 7 Detailed analysis of mesenchymal branching point and odontoblast lineage. a Selection of non-mature subpopulation. An unbiased cluster of cells that do not represent mature pulp populations was selected (left, upper), and preodontoblasts (left, lower), were excluded from it, resulting in non-mature subpopulation (right).b Analysis of ICs stability revealsfive biologically driven aspects of heterogeneity of non-mature subpopulation. Average correlation of ICs to the most similar ICs across 100 runs of subsamplings of 70% of cells (right) reveals 5 out of 20 ICs with stability substantially higher than expected from shuffled control (left). Stability of all ICs of control shuffled matrix and 15 ICs of original matrix are around 0.4 indicating background expectations of spurious components.c Five ICs of non-mature subpopulation reveal processes related to (from left to right) apical gradient (IC 1), cell cycle (IC 2), Fgf3-mediated (IC 3), and Foxd1-mediated (IC 5) heterogeneity restricted to the progenitor states. Colors show intensities of identified ICs. Genes that have the highest (red) and lowest (blue) associations with corresponding IC are shown.d Graph showing cells expressing Foxd1 in comparison to cell-cycle score.e Transcriptional events during pulp differentiation trajectories. Each trajectory encompasses cell states from progenitor, as identified from analysis of preodontoblasts, to mature states with cells arranged by pseudotime reflecting maturation process. The black cells belong to the trajectory being shown, while other cells are shown in light gray (upper panels). Heatmap shows smoothed gene expression profiles with cells arranged by pseudotime and genes (rows) arranged by pseudotime of maximal expression (lower panels).f–i Expression analysis of the selected genes determining odontoblasts (Col1a1, Dmp1, and Dspp) and together with previously unrecognized identified odontoblast marker genes (Notum and Sall1). Notum expression is visualized on t-SNE embedding of the pulp dataset and immunohistochemistry proves NOTUM to be expressed in odontoblasts (g). Sall1 expression is visualized on t-SNE embeddings of the both pulp (h) and complete incisor dataset (i). Scale bars: 50µm.
However, individual genes inside both apical and distal incisor pulp
modules often have incoherent patterns across human pulp subtypes
(Fig.
9c, d). This suggests an evolutionary divergence between mouse
and human gene expression programs governing development and
homeostasis of dental pulp tissue (Fig.
9c, d) and precludes
establishing the homologous
fine subtypes between mouse and
human pulp. Thus, some human pulp subpopulations do not appear
to have clear parallel in mouse teeth.
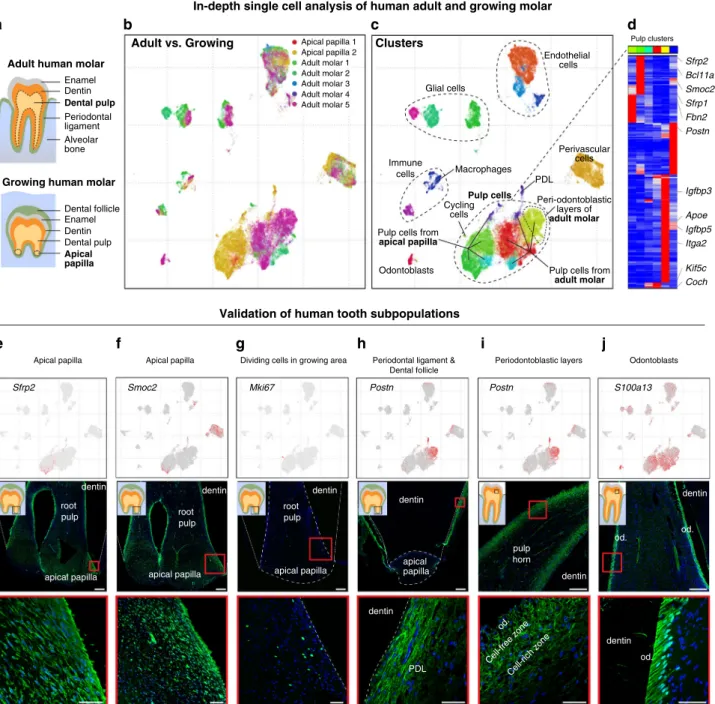
od. Cell-free zone Cell-rich zone pulp horn dentin root pulp dentin apical papilla root pulp dentin apical papilla
Validation of human tooth subpopulations
Enamel Dentin Dental pulp Periodontal ligament Alveolar bone Dental follicle Enamel Dental pulp Apical papilla Dentin
Adult human molar
Growing human molar
PDL dentin apical papilla dentin root pulp dentin apical papilla od. dentin Odontoblasts Periodontoblastic layers
Dividing cells in growing area
Apical papilla Periodontal ligament & Dental follicle Apical papilla
a
g
e
f
h
i
j
S100a13 Smoc2 Sfrp2 Clusters Odontoblasts Pulp cells from apical papillaPulp cells from adult molar Pulp cells Macrophages Immune cells Glial cells Endothelial cells Perivascular cells PDL Postn Peri-odontoblastic layers of adult molar Mki67 Cycling cells Adult vs. Growing
b
Postn Apical papilla 1 Adult molar 1 Adult molar 2 Apical papilla 2 Adult molar 3 Adult molar 4 Adult molar 5 od. od. dentin Pulp clustersc
d
Sfrp2 Bcl11a Smoc2 Sfrp1 Fbn2 Postn Igfbp3 Apoe Igfbp5 Itga2 Kif5c CochIn-depth single cell analysis of human adult and growing molar
Fig. 8 Single-cell analysis of human adult and growing teeth. a Scheme of pulp regions isolated for single-cell RNA-seq from adult human molars and apical papillae of growing human molars (dotted regions).b Characterization of cell composition acrossfive adult and two growing human molars using scVI deep learning framework. UMAP dimensionality reduction visualizes similarity of expression profiles of 39,095 single cells. Colors correspond to individual datasets and indicate clustering by cell types.c Characterization of dental cell types in human teeth. Colors demonstrate 17 clusters as defined by leiden clustering. Major clusters are defined by expression of known markers. d Human dental pulp have at least six transcriptionally distinct states. Top color bar reflects colors of clusters shown in c). Top 198 genes enriched in each cluster are shown (maximum to medium expression across clusters is at least four-fold and p value < 10−50, one-way ANOVA test).e, f Identification of apical-like-mouse-incisor regions in the growing apical papilla of human molar shown by the expression of SFRP2 and SMOC2 (immunohistochemistry) in the growing region of apical papilla.g Dividing, MKI67+cells are positioned in the growing part of the apical papilla.h, i Expression of POSTN shows very regionalized pattern in two main clusters: periodontal ligament (PDL) on the samples from apical papillae (h), but also demarcate the periodontal layers of adult dental pulp previously recognized as a cell-rich and cell-free zones (i). Immunohistochemical POSTN staining.j S100A13 was proposed as a marker of human odontoblasts. This gene is highly overexpressed in one of the subclusters, which is on t-SNE located in the close proximity to dental pulp. S100A13 was proved to be expressed in odontoblasts by immunohistochemistry. (Od. Odontoblasts; PDL periodontal ligament). Scale bars: 50µm, insets: 250 µm.
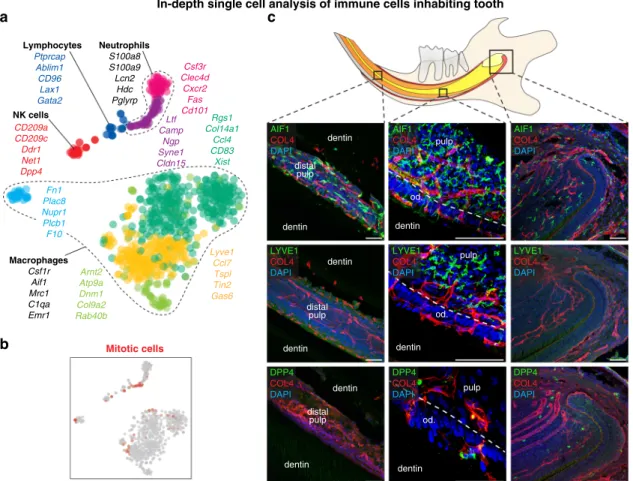
Heterogeneity of tissue-residential immune cells in mouse
incisor. Immune cells are the
first responders to any infection
invading the pulp cavity
43. Understanding the organization and
diversity of the dental immune system can help develop
approaches to improve dental treatments to preserve dental pulp
and odontoblasts. We observed eight well-defined immune cell
populations in the mouse incisor, dominated by an extensive
repertoire of macrophages and other innate immune cells
including intravascular and tissue-resident DPP4
+natural killer
(NK) cells (Fig.
10a, c; Supplementary Fig. 5a, b, e and
Supple-mentary Table 1).
The population of macrophages and dendritic cells contained
three subclusters (Fig.
10a). The most evident was presence of
Aif1
+/Lyve1
+and Aif1
+/Lyve1
−populations (Fig.
10,
Supplemen-tary Fig. 5a, b and SupplemenSupplemen-tary Table 1) Unexpectedly,
immunohistochemistry demonstrated regional specificity of LYVE1
+and LYVE1
−macrophage subpopulations: while LYVE1
+macro-phages resided in the pulp distant from odontoblast layers, LYVE
−macrophages were scattered ubiquitously and penetrated the
odontoblast layer (Fig.
10c, Supplementary Fig. 5c, d). Given the
importance of the tooth immune system in preventing caries,
we tested whether similar patterns are also present in human teeth.
Indeed, examination of analogous macrophage populations in the
human dentition confirmed regional specificity of the LYVE1
+population across species (Supplementary Fig. 5f). Interestingly, the
density of macrophages in an intact mouse unerupted incisor was
much higher than in the surrounding tissues (Supplementary Fig. 5c)
and this tooth shows the same patterns as fully developed adult
incisor in presence of of Aif1
+/Lyve1
+and Aif1
+/Lyve1
−macro-phages populations.
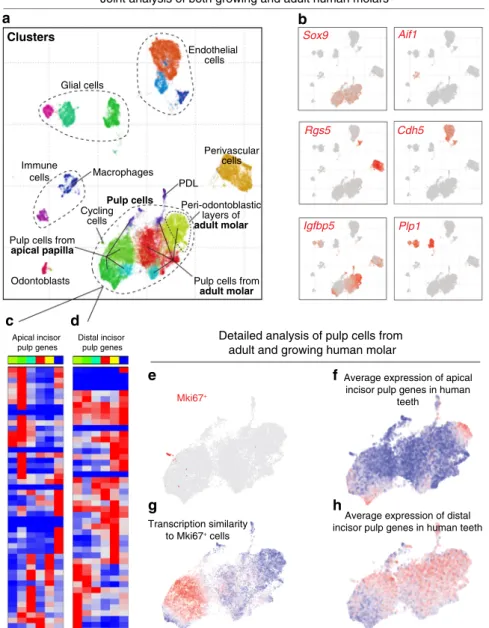
Clusters
Odontoblasts Pulp cells from
apical papilla
Pulp cells from
adult molar Pulp cells Macrophages Immune cells Glial cells Endothelial cells Perivascular cells PDL Peri-odontoblastic layers of adult molar Cycling cells Mki67+ Transcription similarity to Mki67+cells
Detailed analysis of pulp cells from adult and growing human molar
Average expression of apical incisor pulp genes in human
teeth
Average expression of distal incisor pulp genes in human teeth
a
e
g
f
h
Apical incisor pulp genes Distal incisor pulp genesc
d
Joint analysis of both growing and adult human molars
b
Rgs5 Cdh5
Igfbp5 Plp1 Aif1 Sox9
Fig. 9 Analysis of adult and growing human molars. a Dental cell types in human teeth, see Fig.4.b Expression of selected marker genes. c, d Expression of genes coordinately active in apical (51 genes,c) or distal (48 genes, d) incisor pulp across clusters of human mesenchyme reveals divergence of pulp expression programs. Apical incisor genes were defined as at least three-fold and significantly (p < 10−10, two-sided t-test) overexpressed in apical compared to distal incisor pulp in both 10× Chromium and Smart-seq2 datasets. The same for distal incisor genes.e Expression of MKI67 in cells of human pulp shows a group dividing cells.f Transcriptional similarity of the group of dividing cells to individual nondividing mesenchyme cells. g, h Average expression of apical incisor genes (g) and distal incisor genes (h) in cells of human mesenchyme outline tendency to expression in complementary cell states.
Discussion
Coordination of mesenchymal and epithelial compartments is a
common feature of self-renewing and developing tissues and
organs. Continuously growing mouse incisor has been widely
used as a model of tooth development as well as a model of
self-renewing organ in general
44,45. Earlier studies, using bulk
RNA-seq, have elucidated some of the transcriptional complexity,
characterizing differentiated and progenitor cells in stem-cell
niches
27. Our results based on a single-cell transcriptomics go
further to reveal previously unappreciated complexity of the
terminal and transient cell states that altogether enable
self-renewal and growth of mammalian teeth.
In addition to the previous lineage tracing studies reveling the
nature of the Sox2
+, Bmi1
+, and Lrig1
+dental epithelial stem
cells
24,25,27, we identified stem population of Acta2
+cells in the
labial cervical loop. The lineage tracing experiments presented
here or published by other authors never showed the entire
population of ameloblasts to be traced. Instead, the epithelial
progeny appears in characteristic patches, supporting the
diver-sity of epithelial stem cells. Furthermore, we identified Egr1
+long-lasting epithelial progenitors, which appeared to be similar
to a concept of short-living stem cells. Thus, the progenitor area
might rely on functional diversification of different stem cells
with a stemness gradation. Such diversity of epithelial progenitor
cell subtypes might also reflect the remarkable plasticity noted by
earlier studies
35,46.
Aside from the discovered epithelial stem-cell types, our unbiased
scRNA-seq approach uncovered different subtypes within incisor
epithelium including the subtypes of stellate reticulum, stratum
intermedium or a population of ameloblasts that expresses some
mechanotransduction-related genes. Future research is required to
clarify a precise role of this population. Although the functional and
histological structure of mouse-incisor enamel organ was previously
extensively investigated
25,27,46, we introduced a sublayer of stratum
intermedium—cuboidal layer, which is positioned immediately
underneath the ameloblast layer. The in-depth characterization of a
transition from progenitors to mature ameloblasts may benefit
ongoing attempts to establish a system of ameloblast differentiation
in vitro or to grow dental organoids.
Although our Smart-seq2-based analysis provided a
sequen-cing depth allowing to
find populations with fine transcriptional
differences, it is laborious and expensive, which precludes the
analysis of large cell numbers. Complementary to our
Smart-seq2-based study of the epithelial compartment, Sharir and
co-authors addressed heterogeneity and the plasticity of the incisor
epithelium at a single-cell level
46. In addition to major epithelial
groups, also described in their single-cell study, we identified a
number of small subpopulations with
finer transcriptional
dif-ferences, including cuboidal epithelial layer, Ryr2
+population
and subtypes of stem or progenitor cells (Acta2
+, Egr1
+). Sharir
et al. demonstrated the capacity of Notch1-expressing cells to
convert into ameloblasts upon injury, which significantly extends
a
Rgs1 Col14a1 Ccl4 CD83 Xist Lyve1 Ccl7 Tspl Tin2 Gas6 Arnt2 Atp9a Dnm1 Col9a2 Rab40b Csf3r Clec4d Cxcr2 Fas Cd101 Ltf Camp Ngp Syne1 Cldn15 CD209a CD209c Ddr1 Net1 Dpp4 Macrophages Csf1r Aif1 Mrc1 C1qa Emr1 Neutrophils S100a8 S100a9 Lcn2 Hdc Pglyrp NK cells Lymphocytes Ptprcap Ablim1 CD96 Lax1 Gata2 Fn1 Plac8 Nupr1 Plcb1 F10In-depth single cell analysis of immune cells inhabiting tooth
Mitotic cells
c
b
LYVE1 COL4 DAPI DPP4 COL4 DAPI AIF1 COL4 DAPI dentin dentin distal pulp dentin dentin distal pulp dentin dentin distal pulp LYVE1 COL4 DAPI DPP4 COL4 DAPI AIF1 COL4 DAPI od. pulp dentin od. pulp dentin od. pulp dentin LYVE1 COL4 DAPI DPP4 COL4 DAPI AIF1 COL4 DAPIFig. 10 Heterogeneity of immune cells in mouse incisor. a t-SNE dimensional reduction shows ten identified populations of immune cells. b Position of mitotic cells in the immune cluster.c Location of tissue-residential immune cells in the different parts of mouse incisor. AIF1+macrophages are located in the whole incisor including apical pulp, cervical loop, odontoblast layer, and distal pulp in contrast to LYVE+macrophages which mostly resides in the middle part of the pulp, but not inside the odontoblast layer. DPP4+immune cells are sporadically located in the apical part of the tooth and odontoblast layer. COL4 immunohistochemical staining visualize the blood vessels. (Od. Odontoblasts), Scale bars: 50µm.