READ THESE TERMS AND CONDITIONS CAREFULLY BEFORE USING THIS WEBSITE.
https://nrc-publications.canada.ca/eng/copyright
Vous avez des questions? Nous pouvons vous aider. Pour communiquer directement avec un auteur, consultez la
première page de la revue dans laquelle son article a été publié afin de trouver ses coordonnées. Si vous n’arrivez pas à les repérer, communiquez avec nous à [email protected].
Questions? Contact the NRC Publications Archive team at
[email protected]. If you wish to email the authors directly, please see the first page of the publication for their contact information.
NRC Publications Archive
Archives des publications du CNRC
This publication could be one of several versions: author’s original, accepted manuscript or the publisher’s version. / La version de cette publication peut être l’une des suivantes : la version prépublication de l’auteur, la version acceptée du manuscrit ou la version de l’éditeur.
Access and use of this website and the material on it are subject to the Terms and Conditions set forth at
Modeling ice-structure interactions in a geotechnical centrifuge
Lau, M.; Phillips, R.; McKenna, R. F.; Jones, S. J.
https://publications-cnrc.canada.ca/fra/droits
L’accès à ce site Web et l’utilisation de son contenu sont assujettis aux conditions présentées dans le site LISEZ CES CONDITIONS ATTENTIVEMENT AVANT D’UTILISER CE SITE WEB.
NRC Publications Record / Notice d'Archives des publications de CNRC:
https://nrc-publications.canada.ca/eng/view/object/?id=41ac6431-419e-430c-ad00-cab75c9e0882 https://publications-cnrc.canada.ca/fra/voir/objet/?id=41ac6431-419e-430c-ad00-cab75c9e0882
Modeling ice-structure interactions in a geotechnical centrifuge
M. Lau, R. Phillips, R.F. McKenna
C-CORE, Memorial University of Newfoundland, St. John's, NF, Canada
S.J. Jones
Institute for Marine Dynamics, National Research Council of Canada, St. John's, NF, Canada
ABSTRACT: Centrifuge modeling provides an efficient and cost-effective complement to conventional ice tank modeling to simulate the deformation of level ice and rubble. This paper gives an overview of the ice-structure interaction research conducted at C-CORE’s geotechnical centrifuge facility. The advantages of centrifuge modeling of ice problems are discussed in terms of the scalability of ice properties, the controllability of test environments, and the quality of test data. Recent results show that ice loads measured in the centrifuge are consistent with those predicted in the prototype for a wide range of ice-structure interaction scenarios.
1 INRODUCTION
Over the past 15 years, the centrifuge modeling technique has been applied to the mechanical behavior of floating ice sheets. Previous work (Clough & Vinson 1986a, b, Lovell and Schofield 1986, Tin 1996, Barrette et al. 1999, Langhorne et al. 1999) has documented the feasibility of centrifuge modeling as an efficient and cost-effective complement to conventional ice tank modeling. Nevertheless, the progress in the area has been sporadic over the years.
A significant advantage with centrifuge modeling in ice-related problems is that modification of the mechanical properties of ice (routinely done in large refrigerated tanks) is, in principle, not required. As a result, the mechanical properties of the model are more representative of the prototype in comparison with those presently achieved with artificial model ice (Barrette et al. 1999, Lau et al. 2001). Due to the small size of the model required, centrifuge modeling also has the advantage of simulating and maintaining a small controlled test environment with a fraction ofthe cost of a conventional ice tank.
The success of modeling ice sheets in the centrifuge has encouraged C-CORE to extend the existing knowledge base by conducting a comprehensive assessment of the centrifuge technique in modeling ice-structure interaction problems. The objective is to establish technique to simulate the interaction of an ice cover with conical and cylindrical structures, and provide a true starting point for future engineering applications of the techniques developed in addition to a knowledge base for future applied research in this area.
This paper gives an overview of the ice-structure interaction research conducted at C-CORE’s geotechnical centrifuge facility. The ice modeling
facility is described and the results of recent tests are highlighted. The advantages of centrifuge modeling of ice problems are discussed in terms of the scalability of ice properties, the controllability of test environments, and the quality of test data.
2 THE FACILITY
C-CORE’s centrifuge (Fig. 1) is an Acutronic 680-2 centrifuge (Phillips et al. 1984) with a radius of 5.5 metres to the swinging platform, which can accommodate a payload of up to 1.1 by 1.4 metres in plan and up to 1.2 metres in height over the full platform plan area. The headroom increases in the centre of the platform to 2.1 metres. At the maximum rotational speed of 189 rpm, the acceleration at a radius of 5 m is approximately 200 g. The centrifuge carries a maximum payload of 2.2 tonnes to 100 g at 5 m radius, which reduces to 0.65 tonnes at 200 g.
3 EQUIPMENT
For the present experiments, the test package consisted of a standard containment structure for centrifuge testing, enclosing an insulated water basin made of aluminum 840 x 1075 mm in plan, and 300 mm in height (Fig. 2). The lid of the package comprised an insulated pan assembly suspended above the water basin for the storage of bricks of frozen CO2 (dry ice) 80 x 200 x 50 mm in size. This material was used to extract the heat from the underlying water to form the ice sheets.
Figure 2. Test package
The model was joined to a stem, itself connected through pivoting joints to three custom-made load cells to measure the force and moment applied to the cone. The housing for the load was filled with DuPont’s Krytax GPL105 fluorinated oil (with specific gravity of 1.94 at 0o C) to prevent water from seeping into the load cell compartment at the high hydrostatic pressure generated in the centrifuge.
The model and load cell assembly was pulled along a pair of stainless steel rails, bolted to the bottom of the water basin by a cable/pulley system connected to a servo-drive. The latter consisted of an actuator and a gearbox with a universal joint and a cable drum.
Displacement of the model was monitored with a linear potentiometer located on top of the cold box. The temperature of the ice and the air above it was measured at 4-mm vertical intervals with a thermistor profiler supported from below the ice/water interface. A wide-angle CCD camera enclosed in an insulated box with two light sources was used to monitor and record the events taking place in the cold box from above the ice surface. For
rubble and ridge tests, an underwater CCD camera was added to record the interaction below waterline.
4 TEST PROGRAM
The experimental program involves the development of equipment and techniques for testing: 1) conical piers with level ice sheets; 2) unconsolidated ice rubble and ridges with cylindrical structures; and 3) consolidated rubble ice with conical structures. 4.1 Phase I: Level ice interacting with conical
structures
A total of 55 level ice tests were performed with ice thickness ranging from 5 to 18 mm, interaction velocities from 10, 40 to 100 mm/s, centripetal accelerations from 1, 30, 60, 80, 120 and 160g, and cones angles from 45, 60 to 75. These tests encompass the wide range of conditions found in the field.
4.2 Phase II: Unconsolidated rubble interacting
with cylindrical structures
First year rubble is commonly viewed as a two layer system: an upper consolidated (solid) layer and a lower unconsolidated layer. Due to their structural difference, these two layers behave differently under load. This difference in behavior has been utilized in the design of the Confederation Bridge piers (Brown et al. 1998), which have an underwater cylindrical section to resist the unconsolidated ridge keel and an upward breaking conical shield about the waterline to break the consolidated upper layer in flexure.
The goal of this phase is to consider the effect of size and shape on the mechanical behavior of unconsolidated rubble and loads on a cylindrical structure. A total of 28 rubble and ridge features were tested with depths up to 11m in full scale. Two cylindrical models that modeled prototype structures with 5 and 10 m waterline width, respectively, were used. The test ridges were up to 50 m wide and were located between a wood board on one side and two ice blocks on the other side, which simulated the boundaries imposed by the adjacent ice sheets. The rubble extended fully across the ice tanks (up to 120m extent in full scale). The model was pulled toward the ice features with a velocity of 0.04 m/s.
0.00 0.50 1.00 1.50 2.00 2.50 0.00 0.20 0.40 0.60 0.80 1.00 (Brine Volume)^0.5
Flexural Strength (MPa)
Growth 1g Growth high g
Williams and Parsons 1994 4.3 Phase III: Rubble interacting with conical
structures
The last phase of the project extends the centrifuge tests to conical structures and rubble consolidation. The model cone was tested at a waterline diameter of 0.123 m. A total of 12 rubble features of various degrees of consolidation were tested at simulated gravity up to 120 g. The objective is to see whether the existing load models for level ice can also be used to predict loads on a cone due to this layer of re-frozen ice.
5 ICE PARAMTERS AND CONSTRUCTION 5.1 Level ice
The ice sheets were grown at 30 g, followed by testing at the required level. This is to ensure that all ice sheets have similar physical properties. For the simulation of prototype saline ice, commercially available sea salt was dissolved into the chilled water prior to its transfer into the basin. Twenty-five kilograms of dry ice were distributed equally in the compartments before the lid was fastened on the cold box and the centrifuge chamber was prepared for spin-up to an inertial acceleration of 30 g for ice growth.
A fog formed above the water surface early during the flight. A nucleation episode was then established, during which ice crystals - or snow - settled on the water surface, representing the ‘seed’. The ice sheet was allowed to grow during the next 2 to 4 hours.
The resulting ice had a uniform, columnar-grained structure, resulting from the ‘seed’. The average grain diameter at the ice/water interface was about 1 mm. The variation of ice thickness along the central axis, near the path of the structure, was within 1 mm.
The salinity of the ice was obtained from melted specimens. The brine content was determined according to Frankenstein & Garner’s (1967) formulation. The flexural strength was derived from an empirical relationship relating the brine content and sample size of the ice to its strength (Williams & Parsons 1994). This equation was found to be valid for ice sheets grown in a centrifuge (Lau et al. 2001) (see Fig. 3). In situ cantilever strength tests, a common practice in large basin modeling, was therefore not carried out.
Figure 3 Flexural strength versus square root of brine volume for beam measurements under different g-level. Predictions from Williams and Parsons’ (1994) model are also given in the plot.
Classical centrifuge modeling requires the strength of ice at the model scale to be similar to that of the prototype. As with any material, real ice is subjected to size effect. We have found experimental evidence of this size effect in flexural strength based on measurements of small ice beams conducted at C-CORE and IMD (Lau et al. 2001). To achieve the correct ice strength, we decreased the brine volume of real ice at model scale to counteract the effect of decreasing size, so to maintain a proper classical centrifuge scaling relationship between the prototype and the model. This method has been routinely employed in conventional ice tanks in which the model ice is tempered to achieve an appropriate value.
5.2 Unconsolidated rubble and ridges
The package was cooled down to –20o C immediately before the freezing water was transferred to it with the aim of reducing the amount of ice melting during rubble construction. Since the mechanical properties of the constituent ice fragments would be of secondary importance with respect to the porosity and bulk density of the unconsolidated ice mass and the contact condition between ice fragments, we used freshwater ice for its ease of handling.
The rubble and ridges were assembled in the centrifuge by dumping 4-mm thick freshwater ice blocks (with size and composition representative to those found in the field) into a free-floating mound at location prior to spin-up. This resulted in a rubble or ridge with controllability and uniformity far exceeding those achieved in conventional ice tanks. Immediately after rubble construction, two kg of dry ice was put inside the package before the insulated lid was put on to maintain an air temperature slightly above 0o C at water level during spin up. Rubble depth measurements after test suggested negligible ice melting prior to tests.
The ridge profile was designed to be trapezoidal in cross-section with a keel angle of 30o and a
porosity of 0.27. A comparison of the actual and the targeted ridge cross-sections suggests a high controllability of model ridge geometry (Fig. 4).
Shear strength of 12 rubble features, representing full-scale rubble with depth up to 15 m, was measured at simulated gravity up to 120 g using an
in-situ punching shear configuration developed by
C-CORE and others (McKenna et al. 1996). The test data were interpreted using the method of Meyerhof & Adams (1968), and the results are shown in Figure 5. These measurements agree well with those obtained in other studies (McKenna et al. 1995, Lepparanta & Hakala 1992).
Figure 4 Comparison of the measured and targeted cross-sections of the test ridges
Figure 5 Mohr-Coulomb parameter estimates from the punch shear tests
5.3 Semi-consolidated rubble
Unconsolidated rubble features, which extended from wall to wall of the cold box, were assembled in the centrifuge as described previously. The freshwater ice blocks were refrozen in 6-ppt (0.6% concentration) saline water to achieve a flexural strength of 500 kPa. Ten kilograms of dry ice were distributed equally in the dry ice compartments before the lid was fastened prior to spin up. The rubble was allowed to consolidate at 30 g with freezing times ranging from 0, 0.5, 1 to 1.5 hrs before testing. The rubble features had a depth of 92 mm, of which the top 27.4 mm were in direct contact with the cone. The consolidated layer had a thickness of 11.2, 19.8 and 25.7 mm corresponding to a freezing time of 0.5, 1.0 and 1.5 hrs, respectively. The flexural strength of the consolidated layer was not measured, but estimated from a level ice sheet grown under identical condition. 0 50 100 150 200 250 300 350 400 0 100 200 300 400
Measured Keel Area (m2)
Ta rg e ted Ke e l A rea (m 2 )
6 HIGHLIGHTS OF TEST RESULTS 6.1 Level ice-cone interactions
Lau et al (1999) has proposed algorithms to predict the horizontal and vertical forces applied by floating ice sheets on conical structures. Their formulation takes into account various parameters, such as cone
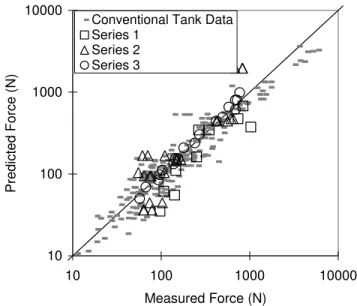
Figure 6 A comparison of horizontal load measured in C-CORE’s centrifuge and measurements from conventional refrigeration basins for level ice test series (comparison via predictions by Lau et al.’s 1999 model). Series 1, 2 and 3 are centrifuge tests conducted between 1998-1999.
10 100 1000 10000 10 100 1000 10000 Measured Force (N) Pr edicted For c e ( N )
Conventional Tank Data Series 1 Series 2 Series 3 φ = 41o; c = 1.7 kPa 0 1 2 3 4 5 6 7 8 9 10 0 2 4 6 8
Normal Stress (kPa)
Shea
r Stre
ss (k
morphology and size, the physical and mechanical properties of the ice and the friction between the ice and the cone surface. It affords a means of comparing the loads recorded by our model structures with those obtained from conventional refrigerated basins. Data from a total of 10 tests programs conducted in conventional refrigeration basins worldwide were used for this comparison. This is shown in Figure 6 for horizontal peak forces. The figure suggests a good consistency between centrifuge data and other conventional ice tank data. The figure also shows a gradual improvement of data quality with each successive centrifuge test
series. 0 1 2 3 4 5 6 7 8 9 0 100 200 300 400
Effective Keel Area (m2)
Fo rce ( M N ) McKenna et al, 1995 Centrifuge trial
Poly. (McKenna et al, 1995)
6.2 Unconsolidated rubble and ridges interacting
with cylindrical structures
McKenna et al. (1995a, b) modeled the 10-m wide Confederation Bridge pier at a scale of 12.5. The ridges were approximately 11m deep and 56 to 75 m wide in full scale. We modeled the same prototype in the centrifuge in a scale of 120. Additional data were also obtained for 5.5-m deep ridges. The centrifuge results were compared with their data to examine how well we can duplicate the results obtained from conventional refrigeration basins. Figure 11 shows the relationship between the horizontal peak force and the effective keel area for both test series. The comparison is given in full scale. The effective cross-sectional area for McKenna et al’s tests was estimated for the keel portion directly below the base of the conical shield. The best fit curve for McKenna et al’s data is also given. The figure shows good agreements between the two sets of data. C-CORE’s test set showed fewer scatters, which is due to the more uniform model ridges used.
Tests were also repeated three times for a selected ridge (with prototype keel area of 210 m2) to examine the repeatability of results. For these tests, the measurements were within 10% of the average values.
Another technique for checking for internal consistency is the ‘modelling of models’ technique routinely used in centrifuge modelling, in which centrifuge models of different scale are tested at appropriate accelerations such that they then correspond to the same prototype. The models should predict the same behaviour and thus provide
Figure 7 A comparison of data obtained from C-CORE’s centrifuge and IMD’s ice tank
a useful internal check on the modelling procedure. Four prototype test conditions were selected with each condition tested at two different scales, and the results were examined using the modelling of models technique. Figure 8 shows the results of the comparison. The four data sets gave prototype load values within 12, 1, 7 and 8% from the respective average, which suggest a high degree of internal consistency. 0.01 0.1 1 10 0.01 0.1 1 10
Forces Predicted from Smaller Scale (MN) Force s Pred ic ted fr om Larg e r Sca le (MN ) Rubble Ridges 1:1 fit
Figure 8 Comparison of prototype forces predicted by testing in two scales using the models of model technique
6.3 Semi-consolidated rubble interacting with
conical structures
The total load on the cone consists of contributions from the consolidated and the unconsolidated portion of the rubble in direct contact with the cone surface. The load contribution from the unconsolidated rubble was estimated from the results of unconsolidated rubble and by assuming the rubble load was proportional to the rubble thickness. This amount was subtracted from the total load to arrive at load contribution from the consolidated ice. The estimated load was then compared to that predicted by Lau et al.’s model to assess the validity of the test results. As shown in Figure 9, the test measurements compare well with the analytical model.
Figure 9 A comparison of load measurements in C-CORE’s centrifuge and predictions from Lau et al.’s model (1999) for load due to consolidated rubble
7 GENERAL DISCUSSION AND CONCLUSIONS
There was an excellent agreement amount data obtained from the centrifuge, an analytical algorithm and other conventional refrigerated model basins for level ice, ridges and rubbles interacting with structures. This agreement demonstrates the validity of centrifuge technique as an alternate means to model ice/structure interactions. Due to the small size of the model required, centrifuge modeling also has the advantage of simulating and maintaining a controlled test environment at a fraction of the cost of conventional tanks. Centrifuge modeling is
relatively new to the ice engineering community and additional comparisons are still needed with full-scale measurements to provide confidence in the end-users that this is a viable approach.
8 ACKNOWLEDGEMENT
The investigations presented in this paper were funded by a NRC/NSERC Research Partnership grant. P. Barrette carried the first two series of cone-ice interaction experiments.
9 REFERENCES
Barrette, P.D., Phillips, R., Clark, J.I., Crocker, G. & Jones, S.J. 1999. Flexural Behavior of Model Sea Ice in a Centrifuge, ASCE Journal of Cold Regions Engineering, Vol. 13, No. 3, pp. 122-138. 0 200 400 600 800 0 200 400 600 800 Measurement (N) P redic tion (N) Fh Fv 1:1 Fit
Brown, T.G., Croasdale, K.R., Bruce, J.R., and Azarnejad, A. 1998. Observations from the Confederation Bridge Ice Monitoring Program, Proceedings of the 17th International Conference on Offshore Mechanics and Arctic Engineering, OMAE, Montreal, Canada, Vol. II, pp.
438-442.
Clough, H.F. & Vinson, T.S. 1986a. Centrifuge model experiments to determine ice forces on vertical cylindrical structures, Cold Regions Science and Technology, V.12, no.3, pp. 245-259.
Clough, H.F. & Vinson, T.S. 1986b. Ice forces on fixed conical structures, Proceedings of the 5th Intl. Conf. on Offshore Mechanics and Arctic Engineering, Tokyo, V. 4, pp.
507-514.
Frankenstein, G. & Garner, R. 1967. Equations for determining the brine volume of sea ice from -0.5 to -22.9oC, Journal of
Glaciology, Vol. 6, pp. 943-944.
Lau, M., Molgaard, J., Williams, F.M. & Swamidas, A.S.J. 1999. Development and Verification of a 3-D Model for Ice Forces on Conical Structures, Proc. 18th Intl. Conf. on Offshore Mechanics and Arctic Engineering, OMAE Paper
No. 1150, St. John’s Newfoundland.
Lau, M, Phillips, R., McKenna, R.F. & Jones, S.J. 2001. Size Effect on the Flexural Strength of Ice in Model Testing, Proceedings of POAC’01, Ottawa.
Lepparanta, M. & Hakala, R. 1992. The Structure and Strength of First-Year Ridges in the Baltic Sea, Cold Regions
Science and Technology, Vol. 20, pp. 295-311.
Lovell, M.S. & Schofield, A.N. 1986. Centrifugal modelling of sea ice, Proceedings of the 1st International Conference on Ice Technology, Cambridge, pp. 105-113.
McKenna, R.F., Williams, F.M., Hill, B. & Kirby, C.S. 1995a. Forces on the Northumberland Strait Bridge Piers due to Ice Ridge Keels, Contract report prepared for the Public
Works and Government Services Canada, NRC/IMD
Report TR-1995-38.
McKenna, R.F., Bruneau, S.E., Guzzwell, J.A., Hill, B. & Kirby, C.S. 1995b. Pilot Experiments with a Cylindrical Structure in Unconsolidated Ridges, Contract report
prepared for the National Energy Board, NRC/IMD Report
McKenna, R.F., Bruneau, S.E. & Williams, F.M. 1996. In situ shear strength measurements of model ice rubble using a punch technique, Proceedings of the 49th
Canadian Geotechnical Conference of the Canadian Geotechnical Society, St. John’s, Newfoundland, pp.
297-286.
Meyerhof, G.G. & Adams, J.I. 1968. The Ultimate Uplift Capacity of Foundations, Canadian Geotechnical
Journal, Vol. 5, No. 4, pp. 225-244.
Phillips, R., Clark, J.I., Paulin, M.J., Meaney, R., Millan, D.E. & Tuff, K. 1994. Canadian national centrifuge
centre with cold regions capabilities, Proceedings of the International Conference Centrifuge 94, Singapore, p. 57-62.
Tin, T. 1996. Centrifuge modelling of sea ice and an investigation of its indentation strength (unpubl.)
Williams, F.M. & Parsons, B.L. 1994. Size Effect in the Flexural Strength of Ice, Proceedings of the 13th
International Conference on Offshore Mechanics and Arctic Engineering, Houston, Texas, Vol. 4, pp. 15-22.