Characterization of Self-Assembling Peptide Nanofibers of
KLD12 and RID12
by Jessica Dai
B.S., Material Science and Engineering (2003) Massachusetts Institute of Technology
Submitted to the Biological Engineering Division in partial fulfillment of the requirements for the degree of
MASTER OF ENGINEERING in Biomedical Engineering
at the
MASSACHUSETTS INSTITUTE OF TECHNOLOGY June 2004
© 2004 Massachusetts Institute of Technology All rights reserved
Signature of Author.
Biolo ical Engineering Division
/ May 7, 2004
Certified by ...
.. ,
~ /r, ~.sh
...
D
Dr. Shuguang Zhang Center for Biomedical Engineering Thesis Supervisor Accepted by ... ... ; .... · I iA t A f"I ,.l'- -r, IkrfITl'. l M,A00'I'nU0I? I I0 110 1 I C OF TECHNOLOGY
JUL 2 2 2004
LIBRARIES
... ...
. ...
...
Roger D. Kamm Biological Engineering LU1n ivir ao rrIsr 'JI .~i D- VI r -aiii
ARCHIVES .
'0
. . . .
Abstract
Self-assembling peptides are a promising new area of research with usage in numerous areas, from tissue engineering to membrane protein biology. This work is to further study the characteristics of the peptides KLD12 and RID12 and to generate new ways to control the properties of them. Peptide structures in solution were studied with circular dichroism and
dynamic light scattering, and material properties of the peptide solutions were studied with rheology. Nanofiber structure was studied through atomic force microscopy. Sonication was
found to have a minimal effect on KLD12, while pH could alter the length of the fibers formed. The presence of a second type of peptide in solution interacted with nanofibers of another peptide and resulted in a decrease of average fiber length. Peptide solutions transitioned from a viscous solution to a gel as the concentration of peptide increased, both alone and in mixture with another peptide. Understanding the properties of these peptides will help researchers design new biomaterials and improve applications of self-assembling peptides.
-2-Acknowledgements
I am truly grateful to my thesis advisor, Shuguang Zhang, for giving me the opportunity to work on this project, his guidance on my work and teachings in being a researcher, and his enthusiasm for science. I would also like to acknowledge Xiaojun Zhao for his suggestions and help in designing experiments. Many thanks to everyone in the Zhang lab for being such nice
and friendly people, especially Hidenori Yokoi for help with the AFM, Steve Yang for help with DLS, and Kranthi Vistakula for help with rheology.
-3-Table of Contents
1. INTRODUCTION ... 5
2. BACKGROUND ... 7
2.1 Self-Assembling Peptides ... 7
2.2 Hydrogels and Scaffolds ... 9
3. METHODS ... 12
3.1 Peptide Solutions ... 12
3.2 Circular Dichroism Spectroscopy ... 12
3.3 Dynamic Light Scattering ... 13
3.4 Atomic Force Microscopy ... 13
3.5 Rheology ... 14
4. CHARACTERIZATION OF KLD12 NANOFIBERS ... 15
4.1 Results ... 15
4.1.1 Effect of pH on Structural Properties ... 15
4.1.2 Effect of Sonication on KLD12 Nanofibers ... 16
4.2 Discussion ... 27
4.3 Future Considerations ... 29
5. MIXTURES OF SELF-ASSEMBLING PEPTIDES ... 31
5.1 Results ... ... 31
5. 1.1 Structural Properties ... 31
5.1.2 Rheological Properties ... ... 33
5.2 Discussion ... 47
5.3 Future Considerations ... ... 50
6. ALIGNMENT OF RAD 16 NANOFIBERS ... 51
6.1 Background ... 51
6.1.1 Microfluidics ... 51
6.1.2 Microfluidic Channels ... 53
6.2 Experimental Set-up and Methods ... 55
6.3 Results ... 58 6.4 Discussion ... 65 6.5 Future Considerations ... ... 68 7. CONCLUSIONS ... 69 References ... 70
-4-1. Introduction
Development and advancement of science and technology require new materials and tools. Nanobiotechnology requires nanomaterials and methods to manipulate molecules.
Visualizing individual molecules and objects of nanometer length has become increasingly common with atomic force microscopy (AFM). Although the movement of individual microspheres can be controlled by optical tweezers [1], the ability to build structures at the nanometer level still requires new methods and tools. Molecular self-assembly is one new approach that has functions in nanotechnology, polymer science, and various engineering pursuits.
Self-assembly is a spontaneous association without external instruction of numerous individual entities into a coherent and organized structure that provides advantages to the individual for grouping together. When molecules are the individual entities, structurally well-defined and rather stable arrangements form under correct thermodynamic and kinetic
conditions through a number of noncovalent interactions. [2] Using this molecular self-assembly process and basic biological building blocks or a large number of diverse peptide structural motifs [3], one can build new materials from a bottom-up approach [4]. Such systems have already been developed for bi-, tri-block copolymers, complex DNA structures, simple and complex proteins, and peptides. These molecular self-assembly systems represent significant advances in molecular engineering of simple molecular building blocks for a wide range of material and device applications.
-5-Current research is being carried out to further understand the nature of these self-assembled molecular structures. The peptides studied in this thesis all form nanofibers and the characterization of them is divided into three sections.
Part one is an analysis of the effect of pH and sonication on one type of peptide nanofibers. The pH has an effect on the charged amino acids that make up the peptide, which has been shown to affect some self-assembling peptide's structure and the ability for the peptides to associate [5-7]. The disassembly through sonication and reassembly of one self-assembling peptide has been shown. This characteristic would be a very useful property for these materials and their applications in tissue engineering. It is not yet, however, known whether this is a ubiquitous property of the peptide nanofibers. In addition, a comparison of the structural properties of nanofibers self-assembled from peptides of different sequences may extend our knowledge of the effect that the peptide sequence has on the nanostructures formed.
Part two investigates the nanostructure and hydrogel properties of mixtures of peptides. Most tissues in the body are a heterogeneous mix of cell types and structural proteins in the extracellular matrix. New materials with improved properties are often created through a composite. Therefore, it is of interest to determine the effect of having more than one self-assembling peptide in solution. This part, as well as the first one, could be useful in the development of new biomaterials based on these self-assembling peptides.
Part three of the research deals with controlling the orientation of the nanofibers. The method described in this thesis employs a microfluidic channel to try to orient all the fibers in the same direction. The ability to align the fibers into parallel positions would make them more useful for applications not only in nerve tissue engineering but also in microelectronics.
2. Background
2.1 Self-assembling peptides
Numerous examples of naturally occurring and synthetically designed peptides can undergo self-assembly. One of the most common examples of self-assembling molecules found in biology are the class of prions related to diseases such as Alzheimer's and bovine spongiform encephalopathy (BSE), or more commonly known as Mad Cow disease [8-10]. Of the
synthetically designed molecules, researchers have created self-assembling peptides that mimic the properties of collagen and can direct the mineralization of hydroxyapatite [ 1]. Another class of these peptides belongs to a surfactant family. They have a few amino acids in length with a positively or negatively charged hydrophilic head and a hydrophobic tail, similar to the structure of phospholipids [12-14]. They self-assemble in solution into nanotubes and
nanovesicles, most likely due to the hydrophobic interactions of the tail and possibly
intermolecular hydrogen bonding. These designed peptide construction motifs are structurally simple and versatile enough for a wide spectrum of applications. Bioengineers are just starting to learn how to design the peptides to create desired structures and properties.
Weak noncovalent chemical bonds are crucial to self-assembly in nature. Likewise, the key elements in engineering molecules for self-assembly are chemical complementarity and structural compatibility to form numerous weak noncovalent bonds [15-16]. Hydrogen bonds, ionic bonds, van der Waals interactions, hydrophobic interactions, and water-mediated
hydrogen bonds can all contribute to biological molecule associations.
-7-With this principle, amphiphilic peptides were developed into a distinct class of self-assembling peptide [2]. These peptides have a repeating sequence of alternating charged and hydrophobic amino acids and therefore have two distinctive sides, one hydrophobic and the other hydrophilic. At least three types of molecules can be made with variations of -, +, -/+ charges on the hydrophilic side. Intermolecular interactions between amino acids help the peptides, KFE8 for example, to align next to one another to form nanofibers [4, 17]. The peptides hydrophobic sides form a double sheet inside of the fiber and the hydrophilic sides arrange on the nanofiber external sides to interact with water molecules. They can also form extremely high water content hydrogels, containing as high as 99.9% water. This peptide class forms well-ordered nanofiber scaffolds that can be used for not only 3-D tissue cell culture, controlled cell differentiation, tissue engineering, and regenerative medicine [18-22], but possibly many other applications.
One such peptide sequence, RAD 16-I, repeats the amino acid sequence, RADA, four times (Figure 1). RAD16-I consistently forms fairly stable 3-sheet secondary structures and stable nanofibers with lengths up to a few microns that further form scaffolds. These nanofiber scaffolds have been used in 3-D cell culture systems involving nerve cells [19]. They have been shown to promote growth and are a new alternative to culturing cells on petri dishes.
1.3 nm
5 nm
Figure 1. Molecular model of RAD16-1 peptide. The hydrophilic side chains of arginine and
aspartic acid are on the upper side and the hydrophobic alanine side chains are directed toward the bottom side of this model.
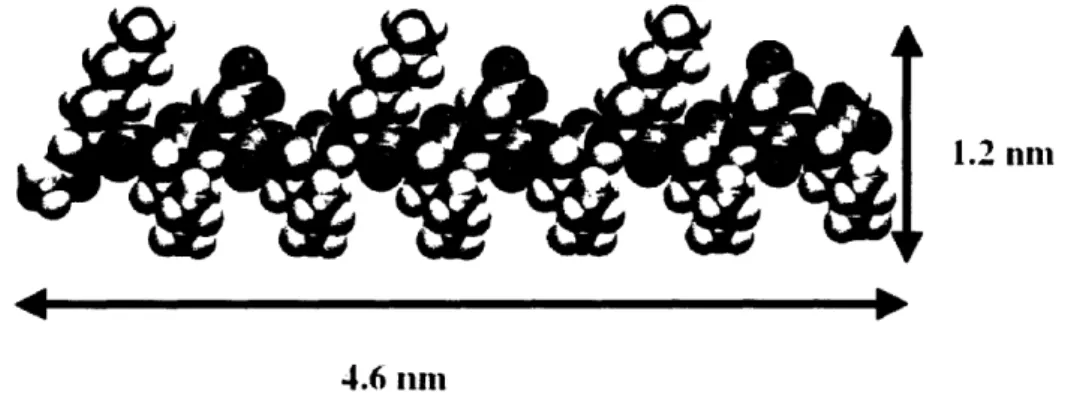
-8-A similar peptide, KLD 12, repeats the sequence, KLDL, three times
(KLDLKLDLKLDL) (Figure 2). On a macroscopic level, KLD 12 is similar to RAD 16-1 in that they both form a hydrogel with 99% water content. KLD12 has potential uses for cartilage tissue engineering, and Grodzinsky and colleagues are presently developing its effectiveness as a scaffold for chondrocyte encapsulation [20]. The actual nanostructures formed by this
peptide, however, have not been studied.
1.2 nni
4.6 nni
Figure 2. Molecular model of KLD12 peptide. The hydrophilic side chains of lysine and
aspartic acid are on the upper side and the hydrophobic leucine side chains are directed toward the bottom side of this model.
2.2 Hydrogels and Scaffolds
One beneficial property of RAD16-1 and KLD12 is that they form hydrogels with very high water content, up to 99.9% (wt/vol). The stiffness and other properties of the hydrogel should depend on peptide properties as well as environmental conditions such as ionic strength or pH [23]. Investigators need a better understanding of the effect the peptide has on the final hydrogel properties in order to control and design new biomaterials with desired properties.
-9-One application of hydrogels is as a scaffold for tissue engineering. The new generation of biomedical materials needs to have the properties of being resorbable and bioactive [24]. Most scaffolds are made from either biological material such as collagen or synthetic material such as polymers. The scaffolds are a network of fibers forming pores in which cells can attach and proliferate in an environment mimicking the extracellular matrix (ECM). Collagen is a major structural component of the ECM and can support growth of cells in vitro [25]. However, because it is animal derived, the human body will likely develop an immune reaction to it and reject the engineered material [26]. Similarly, the body may have an immune reaction to the foreign polymers of other synthetic scaffolds. Scaffolds made from self-assembling peptides, on the other hand, have been shown not to cause an immune reaction. In addition, because the basic building blocks of the peptides are amino acids naturally found in the body, degradation of
the scaffold would not produce toxic molecules, rather, they can be reused by the body. Another property of the scaffolds is the pore size. Porous matrices made from natural polymers such as collagen and hyaluronic acid have pores in the range of 40-200 tm [27]. Pore size is important because it can affect the biodegradation and mechanical strength of the
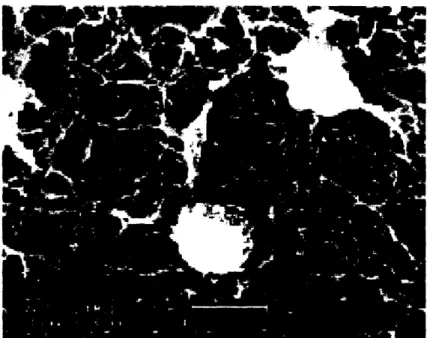
scaffold [28]. It is also important with regards to cell attachement. The pores of most scaffolds made from biological material or polymers are much larger compared to a cell with a typical diameter of 10 gtm. The surface area that a cell is interacting with in a synthetic scaffold is different from the more densely packed ECM. Matrices made from fibers with thinner diameters would create a very different surrounding for the cells. (Figure 3) The interaction between the cells and such a scaffold may provide a more suitable environment to promote proliferation. The self-assembling peptide nanofibers are approximately 10 nm in diameter, thus form a suitable scaffold.
10-Figure 3. SEM image of chondrocytes cultured on poly(L-lactide) scaffold. Average fiber
diameter is 215 ntm. Scale bar is 5 tm. [image courtesy of Zhao et. al., 29]
-3. METHODS
3.1 Peptide Solutions
The experimental procedures were all performed on dissolved peptide powder to determine properties of the peptide structure in solution. The peptides used were commercially synthesized and purified (Synpep Corp, Dublin, CA, www.synpep.com) and are as follows:
KLD12: AcN-KLDLKLDLKLDL-[CONH2]
RID 12: AcN-RIDIRIDIRIDI-[CONH2]
RAD 16: AcN-RADARADARADARADA-[CONH 2]
Peptide stock solutions were made at either 0.5 wt% (wt/vol) or 1 wt% with Milli-Q water. Solutions of 0.5 wt% correspond to concentrations of 3.5 mM, 3.2 mM, and 3 mM for KLD 12, RID 12, and RAD 16, respectively. The stock solutions were diluted with Milli-Q water to different concentrations for further characterization experiments (see separate sections). The pH of the diluted solutions was adjusted by titrating with 0.1 N HCI or 0.1 N NaOH.
3.2 Circular Dichroism (CD) Spectroscopy
Secondary structure of proteins in solution can be determined through circular dichroism. CD spectroscopy was performed on sample solutions with an AVIV 202 CD Spectrometer. Solutions were made by diluting the 0.5 wt% stock peptide solution to a
concentration of 20 gM using Milli-Q water. Spectra were taken at nm interval wavelengths
12-between 190 nm to 260 nm. CD signals in millidegrees were converted to mean residue ellipticity to account for differences in molecular weight and concentration.
3.3 Dynamic Light Scattering (DLS)
Dynamic light scattering was performed on 0. 1 mM solutions with PDDLS/Batch (Precision Detectors, Franklin, MA). Again, the solutions were diluted from 0.5 wt% stock
peptide solutions with Milli-Q water. A Precision Deconvolve program was used to determine an average diameter and to plot the fractional distribution versus size. Each measurement was consecutively repeated five times, and consistent results were obtained. Usually, the size of spherical particles is determined with DLS by measuring the diffusion of a particle and relating it to the diameter through the Stokes-Einstein equation. However, for the fiber networks in the peptide solutions, presumably the program determined a hydrodynamic radius, which assumes the fibers take on a spherical shape by rotating in all dimensions.
3.4 Atomic Force Microscopy (AFM)
Images were collected with an AFM (Nanoscope Ila, Digital Instruments) operating in tapping mode. Silicon tips (Veeco NanoProbe) were used with a cantilever length of 225 Clm and a spring constant of 3 N/m. Typical scan parameters for imaging included a tapping frequency of -60-75 kHz, scan rate of 1-1.5 Hz, setpoint between 0.7-1.0 V, integral gain between 0.3-0.5 V, and a proportional gain approximately twice the integral gain. Solutions were diluted to 0.1 mM for AFM imaging. After placing 1 tl of solution on a freshly cleaved mica surface, the entire surface was rinsed with 100 tl of Milli-Q water. Any remaining liquid
-on the surface was absorbed from the edges using a kim-wipe or allowed to air-dry. The
topographic images produced had a resolution of 512X5 12 pixels, and the brightness of features increased with height.
Average fiber lengths were determined from AFM images. Thirty-five random fibers were measured in one image and 2-3 images were used for each condition. Fiber lengths are reported as an average of all the lengths measured and the standard error.
3.5 Rheology
Mechanical properties were determined with a rheometer (AR2000, TA instruments) for the stock peptide solutions at 0.5 wt% and 1 wt%. The elastic modulus (G') and loss modulus (G") were measured at frequencies from to 100 rad/sec using a 20 mm diameter, 0.5° stainless steel cone with truncation at 9 pm while the strain was held constant at 1%. Each time, 30 pl1 of gel was used for the measurement.
14-4. CHARACTERIZATION OF KLD12 NANOFIBERS
4.1 Results
4.1.1 Effect of pH on Structural Properties
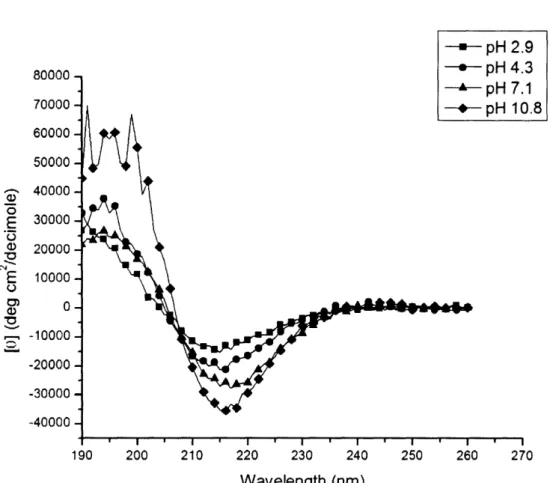
The effect of pH on secondary structure and nanofiber structure of the self -assembling peptide KLD12 was characterized through CD and AFM images. Measurements from CD showed a minimal ellipticity at 217-218 nm and a maximal ellipticity in the 195 nm region for KLD12 at each ]pH value tested (Figure 4). This type of CD signal indicated beta-sheets at all pH values with an isosbestic point at 207 nm. As the pH became more basic, the minimal ellipticity increased in magnitude, signifying an increase in the beta-sheet content.
Representative AFM images of the scanned areas for each pH are shown in Figure 5. Generally, a heterogeneous mix of fiber lengths was seen at different pH. After varying pH, a change in fiber length was measured from the AFM images. Usually, longer fibers were
observed for solutions near neutral pH. As the pH became more acidic, the KLD peptides self-assembled into shorter fibers. In contrast, when the pH was raised towards a more basic
solution, the average fiber length became longer. AFM images for solutions at close to pH 13 were also taken but not shown here because clear images were hard to obtain. Most likely this was because at pH 13, lysine became no longer positively charged, and the overall negatively charged KLD peptide did not stick well to the negatively charged mica surface.
AFM images were also taken of KLD12 at pH 2.39 adjusted with 10 ptl of HCl to try to investigate whether counter-ions from the solutions used to adjust the pH had a screening effect
-for the fiber lengths. On average, fibers were longer than those at this pH when adjusted with only 1 tl of HCl (Figure 6).
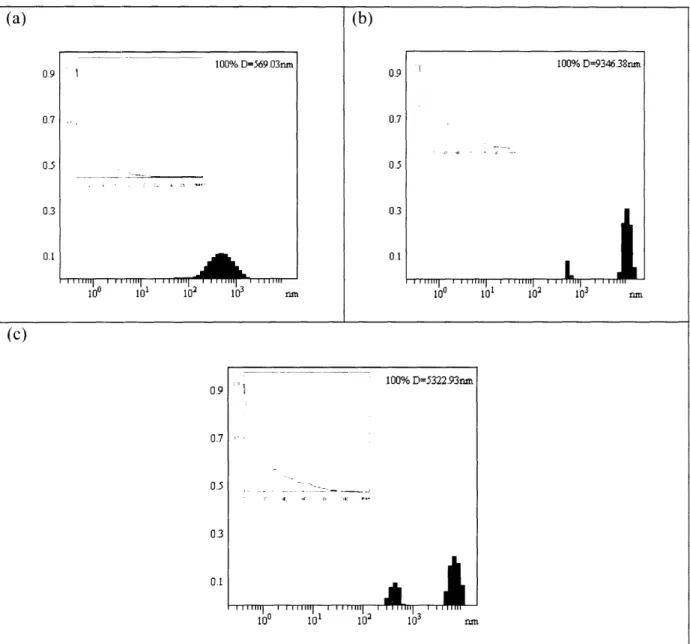
DLS was also used to confirm the general trend of changes in fiber dimensions due to pH (Figure 7). The largest hydrodynamic diameter was measured at pH 7, and the smallest nanostructures appeared at approximately pH 3.
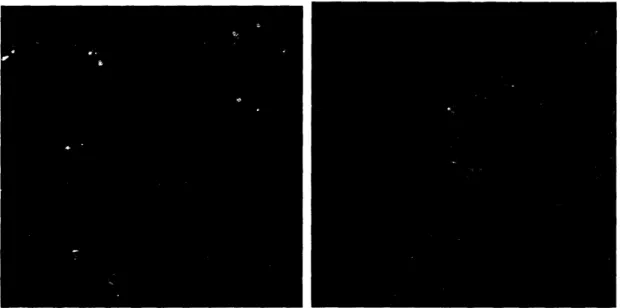
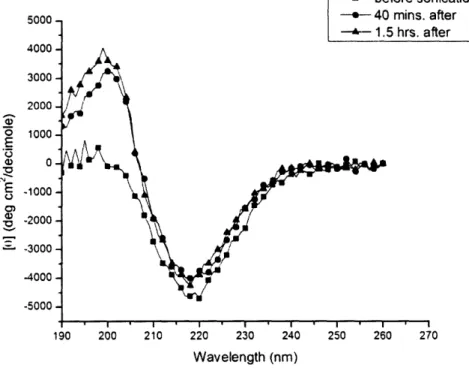
4.1.2 Effect of Sonication on KLD12 Nanofibers
A dynamic disassembly due to sonication and reassembly of RAD16 nanofibers has been demonstrated, but it is not certain whether this is a ubiquitous property of all self-assembling peptides or unique to RAD 16. CD spectrums of KLD12 solution before and after sonication show no effect on the secondary structure as expected because CD only measures the peptide backbone (Figure 8). AFM images of KLD 12 nanofibers before and after sonication are shown in Figure 9. These images were taken for KLD12 solutions around a neutral pH. Large aggregation of the fibers was seen at this pH, which made it difficult to measure exact lengths of fibers. Therefore, sonication experiments were repeated on KLD 12 solutions without adjusting the pH. In this case, the solution had an approximate pH of 4.3 and short fibers were seen under AFM both before and after sonication (Figure 10).
-
-80000 70000 60000 5000 - 40000 E 30000 ._ a, 200(30 E 10000 o 0) 0 -10000 -20000 -30000 -40000 = pH 2.9 - pH 4.3 1 ).8 190 200 210 220 230 240 250 260 270 Wavelength (nm)
Figure 4. CD spectra of KLD12 at varying pH. The characteristic beta-sheet signal with a
minimal ellipticity around 217 nm is found for all pH values tested. An isosbestic point is seen at 207 nm.
17-(a)
(b)
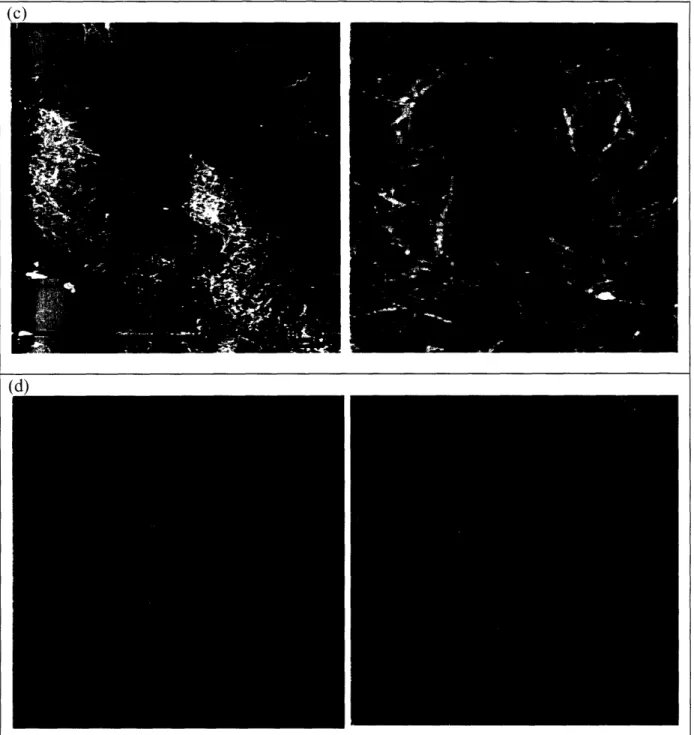
18-(cq
(d)
Figure 5. AFM images of KLD12 at various pH values. Average fiber length and standard
error at (a) pH 2.9, (b) pH 4.7, (c) pH 7.3, and (d) pH 10.7 is 126+/-14 nm, 62+/-5 nm, 165+/-19 nm, and 320+/-35 nm, respectively. The blue boxes show the area that was zoomed in on for the next image of higher magnification.
19-Figure 6. KLD12 fibers at pH 2.4 when adjusted with 10 l of 0.1 N HCI. Average fiber
length and standard error is 170 -+/- 12 nm.
-0.9 0.7 0.5 0.3 (a) 0.9 0.7 0.5 0.3 0.1 0.1 .. ' """'I ". . . ""'. I "... I 3 .2 10° ll l02 10 3 rnm 10° 101 102 103 nr (c) 0.9 0.7 0.5 0.3 0.1 ""' 1 10 '1 101 0 1 ' ' 10221 ' ... 3' 103 n.
Figure 7. DLS measurements of KLD12 at different pH. Results are plotted as frequency vs.
hydrodynamic diameter with the correlation function inset. A much smaller hydrodynamic radius is measured at (a) pH 2.9 as compared to at (b) pH 7.0 and (c) pH 10.7.
21 -100% D=569.03=n 100% D=9346.38nm
L
I
100% D=5322.93nm :iA
I vrrm-(b) .. ,. -1 I 1, .!4000 -3000 -2000 -o 1000-E a) 0-- 2000 -" 30004000 5000 -- before sonication
Annn --- 40 mins. after
I -- 1.5 hrs. after
I I ' I . I I I
190 200 210 220 230 240 250 260 270
Wavelength (nm)
Figure 8. CD spectra of KLD12 before and after sonication. KLD12 retains its beta-sheet
structure under these conditions.
-(a)
(b)
-(c)
Figure 9. KLD12 at pH 7.0 before and after sonication. (a) Before sonication, KLD12 forms
fibers with an average length of 311 +/- 27 nm. (b) Immediately after 30 minutes sonication, an average fiber length of 105 +/- 19 nm was measured. (c) 1 hour after sonication, the average fiber length was measured at 179 +/- 13 nm.
-(a) (b)
25
--
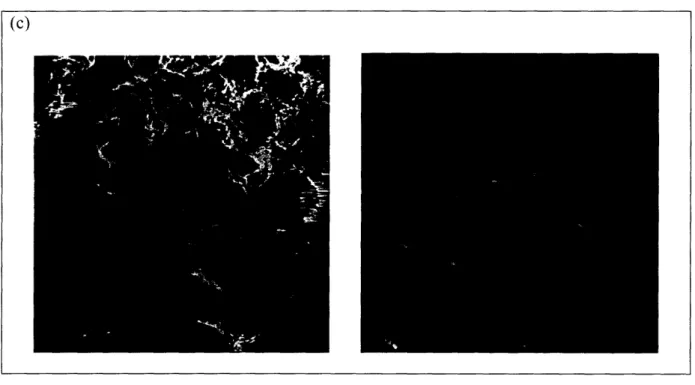
(c)
Figure 10. KLD12 at pH 4.3 before and after sonication. (a) Before sonication, the average
fiber length was 68 +/- 4 nm. (b) The length stayed about the same at 67 +/- 5 nm immediately after 30 min. sonication. (c) 1.5 hours after sonication, the average fiber length was still short at
102 +/- 8 nm. The blue boxes show the area that was zoomed in on for the next image of higher magnification.
-4.2 Discussion
Although the self-assembling peptide, KLD12, has been studied as a scaffold for cartilage tissue engineering, the molecular, nanofiber, and material structures it forms have not been well characterized. The results show that the peptide forms nanofibers with a width of
8-10 nm, a height of 1.5-2 nm, and a range of fiber lengths. The peptide solutions also showed characteristic 3-sheet circular dichroism spectrums. Other than fiber length, these results are similar to dimensions of nanofibers formed from other self-assembling peptides [17, 19]. The peptides within the nanofibers may act as a single beta-strand and align next to each other to form hydrogen bonds between the carbonyl and amino groups of neighboring peptides [17], which creates a 13-sheet as seen in 13-sheet segments of proteins. In this model, one side of the 13-sheet is hydrophobic and the other side is charged because of the alternating amino acids in the peptide's sequence. Two hydrophobic sides can come together to reduce their interaction with water.
Peptide nanofiber length depends on pH, with the average fiber length being shortest at pH less than 4. If the proposed self-assembled structure is correct, the length of the fiber then depends on the ability of neighboring peptides to stay together in the 3-sheet. The hydrophobic effect is a positive driving force that brings the peptide's hydrophobic side chains next to the hydrophobic side chains in the P-sheet. If the charged groups on the outside of the P-sheets all have the same charge though, a repulsive force between these charged side chains drives the peptides in the 1.-sheet away from each other. The fiber length's dependency on pH reflects this self-assembling process. At the low pH, the side chains are protonated; lysine is positively charged and aspartic acid is neutral. The positive charges from lysines' side chain repel each
-other, and the peptide does not torm very long fibers. At around neutral pH, lysine is still positively charged, but aspartic acid is now negatively charged. The opposite charges can attract each other and allow longer fibers to form.
The average fiber length measured at around pH 10 did not correspond with what was expected. Under this condition, a population of negatively charged peptides is present and should not as easily form long fibers. One explanation for the large average fiber length at high pH might be that the positively charged sodium ions in NaOH used to raise the pH provided counter-ions to screen the charges and peptide repulsion. This reason is supported by the results seen when lowering the pH with the same amount of HCI as was used to increase the pH with NaOH. Under these conditions, longer fibers are seen than when the minimal amount of HC is added to lower the pH. This suggests the chlorine ions are screening the positive charge and allowing the peptides to form longer fibers. This might also explain the slightly longer fibers at pH 3 versus pH 5 because approximately ul more HCI was added to lower the pH to 3. Additionally, a similar effect had been seen for the self-assembling peptide KFE12 [23]. Using gelation as an assay for coagulation, it was seen that adjusting the pH with NaOH can shift the range for gelation to higher pH because the counterion concentrations are in the range of critical coagulation concentrations. The critical coagulation concentration of KFE 12 for a monovalent counterion is 100-1000 gM, while the counterion concentrations reached to increase the pH was 1.6-1.9 mM. These findings indicate that electrostatic screening could be affecting these results on the effect of pH.
Another possibility for the longer fibers at high pH might be related to the methods used to image the fibers. The peptide solution was placed on a mica substrate for AFM imaging. The surface of mica is negatively charged, so the negatively charged fibers would not stick well to the surface. The results suggest that many more fibers were rinsed away at the high pH
-because a lower density of fibers was seen on the surface at this pH compared to the other pH, even though the peptide concentration in the solution was the same. Shorter fibers might more easily be rinsed away, leaving only the longer fibers on the surface and resulting in a higher average fiber length for the high pH solution.
Besides tending to form fibers with shorter lengths, KLD12 seems to have another physical difference with RAD16. The results imply that the effect of sonication on the fibers is different. While RAD 16 fibers can be broken apart with 30 minutes of sonication and
reassemble afterwards, the KLD 12 solution did not appear have smaller fiber segments
immediately after sonication, which is most apparent for the samples without adjusting pH. In this case, the fibers may already be too short to be broken up further with 30 minutes of
sonication. At pH 7.0, shorter fiber lengths were measured, however because the fibers tended to aggregate together at this pH, it was difficult to find the exact ends of the fibers for length measurement. This could make the average length for the fibers before and after sonication actually larger or smaller than what was reported. In addition, often individual fibers away from fiber clumps were measured, which may not have been representative of all the fibers. For these reasons, the effects of sonication, if any, would be difficult to determine at this pH.
4.3 Future Considerations
Further experiments will be carried out to study effects of pH and sonication on KLD12 nanofibers. The length of the fibers at high pH is still unclear. Adjustments in the method used to image the fibers at high pH may provide improved results. Coating the mica with poly-lysine could provide a positively charged surface for the fibers to adhere to [30]. Preliminary work with such a coating was done, but more refine methods to ensure a uniform single layer of
-lysine on the mica is needed for better image quality. In addition, more experiments to confirm a salt/charge screening effect will be carried out. Using a salt at different concentrations and measuring the resulting fiber lengths could more clearly show a charge screening effect. This might also provide a more reasonable method to control the length of the fibers for scaffolds rather than adjusting pH.
As for sonication, it seems unlikely that sonication would have no effect at all on the nanofibers. Perhaps the KLD 12 fibers are not as easily broken because they are shorter and have stronger van der Waals interactions between peptides because leucine is more hydrophobic than alanine. Either way, a longer sonication time than what was used for RAD 16 may be needed to see any effects. In addition, one could change the temperature while sonicating to possibly more easily break apart the fibers. The ability to break apart the fibers and allow them to reassemble is an advantageous property in designing scaffolds. This would be another advantage of using them for scaffolds in tissue engineering if it is a general property of self-assembling peptides.
30
5. MIXTURES OF SELF-ASSEMBLING PEPTIDES
5.1 Results
The scaffold microenvironment of tissues is heterogeneous, so it is of interest to determine characteristics of the structures and hydrogels formed from a combination of self-assembling peptides. Mixtures of RAD 16 with KLD12 or RID 12 were examined because the much longer RAD16 nanofibers could be differentiated from the generally shorter KLD12 and RID 12 nanofibers.
5.1.1 Structural Properties
The secondary structure of all three peptides is P-sheet as seen from CD spectrum of the peptide solutions and mixing peptides does not seem to affect this structure (Figure 1). AFM images were used to visualize any changes in the average fiber length of the self-assembled peptide structures. Nanofibers from KLD12 alone were taken from an original solution of 6 mM and then diluted to 0.1 mM for AFM imaging. The pH of the solution was approximately 3-4 as determined by pH paper. As seen in Figure 12, the average fiber length (83 +/- 11 nm) under these conditions was similar to what was measured under similar conditions in earlier experiments. The maximum fiber length measured in all the images of KLD 12 prepared this
way was 573 nm.
AFM images of a solution with solution mixture of RAD 16 and KLD 12 at a ratio of 1:4 is shown in Figure 13. Very long fibers up to 2 um in length were seen. Such long fibers have
-not been observed before in AFM images of KLD 12 but are typical of RAD 16, which has an average fiber length of -850 +/- 60 nm.
The images of nanofibers from powder with powder mixtures are shown in Figures 14. Already at the 1:1 ratio, the average fiber length (- 120 +/- 10 nm) was short compared to
nanofibers from RAD16 alone. At the ratio of 1:2 (RAD16:KLD12), the length (-125 +/- 5 nm) did not change much, however increasing the amount of KLD12 to a ratio of 1:4 decreased the length of the fibers to -60 +/- 5 nm. This value was less than and statistically different
(p=0.005) from the average fiber length of KLD12 alone, however it is not an atypical value seen for possible fiber lengths under these conditions with KLD12 alone.
RID 12 was also imaged under similar conditions as KLD 12. Typical nanofiber
structures formed from this peptide are seen in Figure 15. The average fiber length from RID 12 alone was 113 +/- 6 nm, and the maximum fiber length measured in all the images was 346 nm. Similar to KLD 12, when a solution of it was mixed with a solution of RAD 16 at a ratio of 1:4, long fibers up to 1 um in length were seen (Figure 16).
Typical results of AFM imaging of the solutions made from mixtures of RAD 16 powder with KLD12 powder at different ratios are shown in Figures 17. At the 1:1 and 1:2
RAD 16/KLD 12 ratio, the ends of certain fibers looked like they may have been branching off from other fibers. For measuring average fiber length though, these possible branches were measured as separate nanofibers. The average fiber length of the RAD 16/KLD 12 ratios of 1: 1, 1:2, and 1:4 was 274 +/- 14 nm, 321 +/- 17 nm, and 277 +/- 16 nm, respectively. The
differences between these values were not found to be statistically significant, however they are much less than the typical RAD 16 fiber lengths.
-5.1.2 Rheological Properties
Rheology measurements were taken to compare a macroscopic property of the peptide solutions. At 0.5wt%, all peptides displayed properties of a viscous solution (Figure 18). In this situation, an increase in the storage modulus occurred as the frequency of the applied stress
increased. A crossover point between the storage modulus (G') and loss modulus (G") occurred at different frequencies for each peptide, but the maximum storage modulus stayed below 100 Pa for all solutions.
The rheological properties of the lwt% peptide solutions showed gel properties (Figure 19). G' and G" remained relatively constant as a function of frequency, and G' was much higher than what was measured for 0.5wt% solutions. The peptides formed hydrogels of
different strengths with KLD12 and RID12 (245 Pa and 367 Pa, respectively, at I rad/s) having a higher storage modulus than RAD 16 (96 Pa at I rad/s) at this concentration.
The solutions of peptide mixtures for both RAD 1 6/KLD 12 and RAD 1 6/RID 12 showed a transition from a viscous solution to a gel (Figures 20 and 21). This change reflected the
increasing amount of either KLD 12 or RID 12 in the mixture at the different ratios.
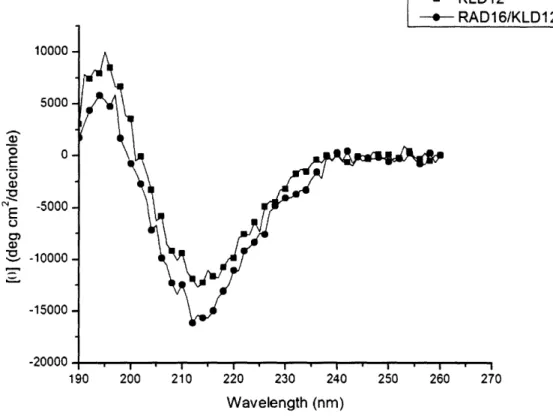
-10000 5000 o 0 E 0o N 5000 0 C, 1. -10000 -15000 -20000 - KLD12 -- RAD16/KLD12 190 200 210 220 230 240 250 260 270 Wavelength (nm)
Figure 11. CD spectra of KLD12 and mixture of KLD12 with RADI6. The beta-sheet
structure is not greatly affected by the addition of this second peptide.
-Figure 12. Nanofibers of KLDI2 alone. The average fiber length of KLD12 alone under these
conditions was 8 3 +/- 11 nm. The blue boxes show the area that was zoomed in on for the next image of higher magnification.
-Figure 13. Nanofibers of KLD12 and RAD16 in a mixture of the two solutions at a ratio of 1 :4 (RAD16:KLD12). When KLD12 and RAD16 were mixed solution to solution, very long
fibers that can reach a micron in length were seen. The average fiber length of the KLD 12/RAD 16 solution mixture was 202 +/- 43 nm.
36
--(b)
37
(c)
Figure 14. RAD16 and KLD12 powder with powder mixtures at different ratios. (a) At a
ratio of 1:1, the average fiber length and standard error was 121 +/- 9 nm. (b) At a ratio of 1:2 (RAD16:KLD12), the fiber length was 124 +/- 6 nm. (c) The fiber length decreased to 62 +/- 4 nm at a ratio mixture of 1:4 (RAD 16:KLD12).
-Figure 15. Nanofibers formed from RID12 alone. Average fiber length and standard error
was 113 +/- 6 nn.
-Figure 16. Nanofibers from RAD16 and RID12 mixed by solution at a ratio of 1:4
(RAD16:RID12). Average fiber length was 372 +/- 21 nm.
-(b)
41
-(a)
-(c)
Figure 17. Nanofibers formed from mixtures of RLD12 and RAD16 at different ratios. The
average fiber length stayed approximately the same for the RAD16:RID12 mixture ratios of (a) 1:1, (b) 1:2, and (c) 1:4 with values of 274 +/- 14 nm, 321 +/- 17 nm, and 277 +/- 16 nm, respectively.
-10 f- 1 03 0.1 0.01 1 10 100 Frequency (rad/s)
Figure 18. Comparison of storage modulus (G') and loss modulus (G") of 0.5wt% solutions of each peptide. At this concentration, the peptides all formed a viscous solution
with similar rheological properties.
- 43 -G' ; G" G' G" G' G"
--- A--A--A--A---A--A--A----A--A-._. . _e,-A A---A~---A@-& -";_ A -- A -_8-_6-==8--o-o-o-o-o--o-o-o - ° o-I I I I . i 10 Frequency (rad/s) --- RAD16 G' -- - RAD16 G" I I I I I ! 100
Figure 19. Comparison of storage modulus (G') and loss modulus (G") of lwt% solutions of each peptide. All peptides exhibited gel properties at this concentration. Both KLD 12 and
RID 12 had a higher storage modulus than RAD 16.
-44 -I nnA 100-= 0 10 1 1 I I VJV ,~~~~,0-0- 0c~~~~~~0-0-0-0-0-0-0 -0 \ tI
1 Annn 100 .-- 10 0 10 1 0 0.1 0.01 1 10 100 Frequency (rad/s)
Figure 20. Changes in storage modulus properties of RAD16/KLD12 mixtures. G' curves
for KLD12 at 0.5 wt% and I wt% are also graphed for reference. The mixtures show a
transition from viscous solution to gel as the concentration of KLD 12 in the mixture increases.
45 -D 1:4 D 1:2 D 1:1 ).5% I -vv l
I nn_ I VUU 100 10 0.1 0.01 'a 0.11 0.01 1 10 1UU Frequency (rad/s)
Figure 21. Changes in storage modulus properties of RAD16/RID12 mixtures. Curves for
solutions of RID12 at 0.5wt% and lwt% are shown for reference. As the concentration of RID 12 in the mixture increases, the viscous solution becomes more like a gel.
-46 -1% ID 1:4 RID 1:2 ID 1:1 0.5%
5.2 Discussion
Mixture experiments of different peptides were conducted to gain insight on two ideas. One is to form a heterogeneous scaffold, and the other is to control properties of the gel. The results indicate that a mixture of peptides will still form a scaffold made of nanofibers.
Additionally, the peptide solution will form a stronger gel as the concentration of peptide increases. A scaffold made from a mixture of peptides may become a new method to better mimic the growth of cells in the extracellular matrix, which is heterogeneous.
AFM images of the solutions made from powder mixtures show nanofibers still form. For the KLD 12/RAD16 mixtures, a decrease in fiber length is shown as the concentration of KLD12 in the mixture increases. Almost no difference was seen in the average fiber length for the 1:1 and 1:2 RFAD 6/KLD12 ratios, but the fiber length decreased more at the ratio of 1:4. Presumably, this result is seen because KLD 12 peptides are interacting with the RAD 16 fibers. KLD 12 can more easily hinder the elongation of the RAD 16 fibers at high concentrations four times that of RAD 16. This suggests a high enough concentration of the second peptide is needed before it will interact more with a dissimilar peptide rather than its own type. If KLD 12 was not affecting the elongation of RAD 16 fibers, long fibers reaching I tm in length should have been seen, as was found in the mixtures that were made after dissolving the peptides into solution separately and then mixing at a 1:4 RAD 16/KLD 12 ratio. This finding also shows that the inhibition of fiber elongation cannot occur after the fiber has already formed. Similar results were seen in the inhibition of RAD 16 (RADARADA), fibers by RAD8 (RADARADA, where shorter fibers were only found if the peptides were mixed by powder rather than by solution.
The mixtures of RAD 16/RID 12 at different ratios showed similar results to what was found for the RAD I 6/KLD 12 mixtures. RID 12 alone, like KLD 12 alone, does not form the
-long fibers seen with RAD 16. On average, shorter fiber lengths were found for the
RAD 16/RID 12 mixture by powder, but mixture by solution still showed fibers up to I pm in length. RID12, though, did not decrease the fiber length as much as was seen for KLD12. In addition, the increase of RID 12 in the different ratios of RAD 16/RID 12 did not decrease the average fiber length more, even at the ratio of 1:4. This finding could be because RID 12 alone does not form fibers as short as KLD12, and this puts a limit to the shortness of the average fiber length. Additionally though, maximum fiber lengths similar to RAD 16 fibers were measured in the mixtures. These results imply that RID12 does not affect the elongation of RAD16 fibers as much as KLD12. This could be because RID12 does not interact well with the RAD 16 fibers or because the presence of RID 12 in the RAD 16 fiber does not affect the further addition of RAD 16 peptides to the fiber. The second reason seems more likely because the amino acid sequence of RID 12 is similar to the sequence of RAD 16, but more experiments would be needed for clarification.
The theological properties of the powder mixtures in solution show an increase in storage modulus as the amount of the second peptide (KLD12 or RID 12) increases. This change is probably due to the increase in concentration of the second peptide because the second peptide alone and in mixture have similar theological properties at the same high concentration of 1 wt%. These results imply that for the conditions used here, the addition of a second peptide fiber does not greatly affect the theological properties of the solution.
Other work has shown that RAD 16 forms very long fibers with an average length of 800 nm. These fiber lengths are much longer than those observed for KLD12. Possibly, fiber length affects the scaffold's pore size or cell attachment, but more experiments are needed to explain how fiber length influences cell growth.
48
The gel's rheological properties are one aspect the fiber length might be affecting. The storage modulus of a polysacharride hydrogel will be higher when using lower molecular weight chitosan [31]. Similarly, the shorter KLD12 fibers will have a lower molecular weight than the RAD 16 fibers, possibly resulting in a stronger hydrogel. For the peptide solutions at 0.5 wt%, the measurements of storage modulus at higher frequencies imply a stronger gel formed by KLD12 than RAD16. The differences, however, are small, and RAD16 has a higher storage modulus than KLD 12 at lower frequencies. A much larger difference in storage
modulus is seen at the peptide concentration of 1 wt%. The higher strength of the KLD 12 gel under this condition may be needed for chondrocytes to proliferate. This would suggest that chondrocytes would also grow well in a RID 12 scaffold, as the rheological properties of this gel at 1 wt%/O are even higher than KLD 12.
The peptide solution's transition to a gel at a higher concentration for all three types used marks a possible method to control the strength of the scaffold. Conceivably, the increase in concentration of peptides in the solution forms more nanofibers that interact with each other more and produce an increase in the density of rheologically effective crosslinks. A similar effect was seen with polymer concentration in methacrylamide modified gelatin hydrogels [32]. As in that case, most likely what is occurring with these peptides is that a higher number of physical cross-links decreases the average molecular weight between cross-links and causes a rise in the storage modulus. This effect could be useful in producing scaffolds with different mechanical properties for different tissues.
-5. 3 Future Considerations
The inhibition of RAD 16 fiber elongation by another peptide in these mixture
experiments is inferred from the changes in average fiber length. More research such as with labeling the peptides with a fluorescent dye might shed more light on this effect. Such an experiment would also allow one to understand better how the peptides are interacting to prevent fiber elongation. An advanced method to visualize the labeled peptides in the fibers at the submicron level would be more effective, though. This might also let one see how RAD 16
peptides are interacting with the other peptide fibers and whether or not it is also preventing fiber growth of already short fibers. In addition, further work with RID 12 at higher
concentrations in the mixture ratios might prevent elongation of RAD 16 fibers even more and to the same extent as KLD 12.
Another aspect that might be useful is to extend the characterization of the hydrogels that are formed by the fibers. Using scanning electron microscopy or transmission electron microscopy to visualize the peptide solutions at concentrations where they gel may lead to a better understanding of the nanofibers and scaffold structure. Additionally, this would allow
one to measure pore size and other properties of the scaffold that perhaps lead to the differences in rheological properties of the peptide hydrogels. Furthermore, testing and comparing the hydrogels' applications in promoting cell growth or in sustained drug release would be beneficial.
-6. ALIGNMENT OF RAD16 NANOFIBERS
6.1 Background
Controlling the self-assembled nanostructures themselves should be the next step in order to create larger uses for these molecules. Because the peptides self-assemble into individual structures, each oriented in a random direction, they have limited usefulness for microelectronic applications. Flowing solutions of the nanostructures through microfluidic channels could create aligned parallel assemblages. These aligned assemblages, if coated with a conducting material, could then be used in circuits for the transistors and other electronic
devices that are decreasing in size [33]. Also, because the peptides are biological in nature, modifications could be readily made so that interactions with the environment could occur, thus allowing them to act as switches in biological device circuitry. The ability to control the
orientation of the nanostructures through the use of microfluidic channels would lead to a wide range of applications.
6.1.1 Microfluidics
Microfluidics have been applied in many settings for various applications. As a method to work with small amounts of material, microfluidic systems have been developed for
separations of biological molecules, patterning of biological and nonbiological materials, and sensors for analysis [34-36]. Lab-on-a chip companies use microfluidics and advances in the field are yielding many improvements in drug discovery and other biomedical applications [37].
-Understanding different aspects of microfluidics is important for designing devices that use them.
Many details about microfluidic fluid flow need to be considered. Fluid flow is usually described by the Reynolds number, a dimensionless ratio of inertial and viscous forces acting on the fluid flowing through the channel [37]. Because of the small radius of the channels, the Reynolds number is fairly low and characterized as laminar flow through microfluidic channels. In laminar flow, the fluid streams flow parallel to each other and can often be described by well-studied constitutive equations.
Another consideration is the method used to move the fluid through the channels. The two most commonly used methods include electroosmosis and hydraulic pressure [37].
Hydraulic pressure uses a pressure gradient across the channel to force the fluid through it. This creates a non-uniform velocity profile across the diameter of the channel, which can add
complication to the flow. Electroosmosis uses the phenomenon of electroosmotic flow (EOF) to move the fluid through the channel. EOF occurs when the material of the channel walls is charged under the experimental condition. The counter ions next to the charged surface feel a force and move when an electric field is applied across the length of the channel. This
movement results in convective fluid flow with a fairly uniform velocity profile across the diameter of the channel. The blunt flow profile created with electroosmosis is preferable, but EOF is also sensitive to variations in fluid composition and channel wall coatings that can affect fluid flow.
Other parameters can affect the microfluidics of the system. A hydrodynamic frictional force from the laminar liquid flow across the substrate surface can depend on several factors such as liquid flow speed and solution viscosity [38]. One parameter that needs to be optimized is the flow rate of solution through the channels. The flow needs to have a strong velocity to
-align the fibers, but not too strong that it does not allow the peptides to adhere to the surface or become aligned in the channel. Speeds varying between approximately 4 mm/second and
10 mm/second have been used by Huang and colleagues to align carbon nanowires [39], while Messer and colleagues have used speeds from simple capillary action to form aligned nanowire bundles [40]. Other parameters that might affect the degree of alignment are the amount of time the solution is allowed to flow through the channel and the distance down channel from the inlet. The size of the channels should not have as much of an effect at small enough sizes. Similar alignment of carbon nanowires has been demonstrated by Lieber and colleagues for channel widths ranging from 50 to 500 microns [39], therefore the channel width should not have a significant effect on the alignment. Their result showed the flow should always be laminar across the channel at such small widths, thus the velocity flow field should be similar for all channels in this range of channel widths.
6.1.2 Microfluidic channels
Much research focuses on producing the microfluidic channels themselves. Microfluidic channels are made following traditional lithography techniques [41]. In this process, first a pattern must be created and printed out from a high-resolution commercial imagesetter onto a transparency. The resolution of the imagesetter allows approximately 25 microns as the smallest achievable line width, however, chrome masks can be made to produce even smaller channels. An example of a pattern that would be used is shown in Figure 22.
-p 0 ---- A .. .ll . W . V
Figure 22 - Example of mask pattern used to create channels with varying widths between 20 and 50 microns. The width of the channels leading to the long, main channels are 50 and
100 microns for the top and bottom set of channels, respectively.
The pattern is then transferred to a silicon wafer by shining electromagnetic radiation through the mask onto a photoresistant coating covering the silicon wafer. A positive
photoresist will degrade in areas exposed to the radiation. Once the pattern is transferred to the surface, chemical etchants can then remove exposed areas and let protected surfaces remain [37]. If the polarity of the pattern is reversed, a negative photoresist such as SU-8 can be used to create deeper channels. In this case, the areas uncovered and shined with radiation become crosslinked and will remain when treated with chemical etchants. The final positive relief pattern of the photoresist on the wafer is known as the master, and from it, multiple castings of the channels can be made using a heat or UV curable polymer through soft lithography.
Soft lithography techniques most commonly use poly(dimethylsiloxane) (PDMS) as the polymer of choice to create multiple copies of the channel from the master [42]. First, however, the silicon masters need to be silanized, such as by placing them under vacuum with a few drops
of hexamethyldisilazane (HMDS). This process allows easier removal of the PDMS mold from the master. A 10:1 prepolymer and curing agent mixture is poured over the master and cured in an oven. The PDMS replica can then be peeled from the master. This mold is then reversibly
54-or irreversibly attached to a substrate to complete the channels [34, 43]. Different substrate materials such as PDMS, glass, or silicon have been used. The flexible nature of the PDMS allows it to conform to minor imperfections on the surface and have van der Waals interactions with the surface [34]. Pumps, valves, and other components can then be incorporated with the completed channels to design microfluidic systems with injection, separation, detection, and other processes necessary for different applications.
6.2 Experimental Set-up and Methods
The pattern was created in Macromedia Freehand 7 and saved as a .EPS file. It was sent to PageWorks (Cambridge, MA) for printing on an imagesetter with a resolution of 5080 dpi. The lithography of the master was done in the Exploratory Materials Laboratory at MIT. For the pattern shown in Figure 22, a positive photoresist of thickness around 8 microns was spin coated onto the wafer. PDMS molds of the channels were made in the Center for Bits and Atoms at MIT. An additional channel with a depth of 80 ptm, width of 150 pm, and length of 3 cm was also obtained and made in a similar manner. The results shown here were obtained with this channel because flow without leakage in the smaller channels was difficult to achieve.
Because the peptides will eventually need to be visualized on the substrate, a preferable choice would be to place the PDMS mold on a mica or silicon surface. Both substrates were tested, however better quality images were obtained with the mica surface and all images shown
in the results were from a mica substrate. An additional advantage of using a mica substrate was its transparency. The position of the channel on the surface could be noted with a marker on the underside of the mica. This greatly improved the chances of finding the nanofibers on the surface using AFM.
-Holes were punched through the PDMS mold using 16 gauge needles for the tubing to reach the inlet holes. Care was taken to make sure that the holes traversed the entire mold and did not have any cracks forming from them that would allow leakage. Tubing connected to a syringe on a syringe pump was inserted directly into the hole. (Figure 23) Often this would cause puckering around the inlet hole so a small binder clip was also used to clamp down the PDMS around the hole.
syringe
syringe pump
syringe pump tionflow
Figure 23 - Diagram of set up for experiment. (figure not drawn to scale) The channel used
was 3 mm long, 150 }xm wide, and 80 tm in depth. Solution was pushed through the channel by using a syringe placed in a syringe pump. The flow rate could be controlled with the syringe pump. An additional clamp was placed around the inlet hole to provide a better seal.
Solutions of the peptide that form nanostructures were pumped through the channels using a syringe pump to allow for control of the flow rate. Optimal flow rate without leakage was obtained with the syringe pump in Positions 6-8, which correspond to speeds of
62 mmsecond - 15 mm/second when flowing through the channels with a cross-section of 150 X 80 pm. Actual speeds appeared to be less, though, by watching the front edge of the solution first move through the channel. This effect was most likely due to the hydrophobic
56
nature of the PDMS mold. UV irradiation induces surface modification of PDMS from hydrophobic to hydrophilic [44]. Therefore the channels were UV irradiated at 254 nm for 5
minutes, which improved the flow of solution through the channels. This procedure needed to be repeated each time before use because the PDMS reverts back to a hydrophobic state in approximately 30 min. when exposed to air [34]. Variations on the method of moving solution through the channels and solution conditions were also tested as described in the Results section.
The degree of alignment down the channel was visualized by AFM with parameters described in the Methods section. The mica substrate was placed under the tip, oriented in such a way that the direction of flow was approximately parallel with the y-axis of the scanned image. All images shown have the flow direction moving towards the top of the image (see sample image in Figure 24).
Figure 24. Direction of flow in all images shown in results. The mica was placed under the
AFM so that each scanned image would be oriented in the same direction relative to the long-axis of the channel. Blue scale bar at bottom of image represents 1 tm.
-6.3 Results
For comparison, Figure 25 shows nanofibers from RAD16 solution directly deposited on mica and imaged. Different dilutions of a RAD 16 0.5 wt% stock solution were made to
determine the best concentration to use so that after the solution was subjected to flow down the microfluidic channel for 3 minutes, the amount of nanofibers remaining on the surface was not too many or too few for AFM imaging. Representative images of diluted solutions flowed at positon 8 for 1 min. down the channel are shown in Figure 26. The image for the solution diluted 50X (Figure 26a) showed the best alignment but was not seen at all positions along the channel. It was decided that a 500X dilution to 6 tLM would be most suitable to obtain a reasonable concentration of fibers on the surface. All further experiments used solutions that were diluted 500X.
The results from attempts of alignment using two different syringe pump speeds, position 8 and 6, are shown in Figure 27. Slight orientation of the fibers was seen but was not always consistent.
The results from experimentation with ionic strength are shown in Figure 28.
Concentrations of 0.1 mM, 1 mM and 10 mM of the salts NaBr, NaF, and NaC1 were used, but only the results from 0.1 mM of each salt are shown because mostly aggregation occurred at higher concentrations. From these results, RAD 16 solution diluted with 0. I1 mM NaCl looked most promising so were used for more experiments.
The results from using RAD16 solution diluted with 0.1 mM NaCI in attempts with slight modifications in the methods are shown in Figures 29 and 30. Attempts were made at withdrawing or pushing out the remaining solution with the syringe pump (Figure 29). Again, sometimes alignment was seen, but fibers were also often found oriented perpendicular to the
-direction of flow. Additionally, using a pipette or capillary action to move the solution through the microfluidic channels did not result in an improvement of alignment (Figure 30).
Ethanol was used to try to increase the speed at which the remaining liquid evaporated from the surface. When 100% ethanol was used to dilute the RAD 16 solution 500X, no fibers were found on the surface, however, when 50% ethanol and 50% water was used to dilute the
solution, the fibers were oriented in three distinct directions. Figure 31 shows results from using solutions diluted with ethanol.
Figure 25. Random deposition of RAD16 nanofibers. RAD16 at a concentration of 0.1 mM
was deposited directly onto mica surface, rinsed, and imaged under AFM. The blue box shows the area that was zoomed in on for the next image of higher magnification.
59-(a)
(c) (d)
Figure 26. Images from different dilutions of RAD16 solutions used in microfluidic
channels. Solution diluted (a) 50X (b) 150X, (c) 500X, and (d) 600X. Solutions diluted greater
than 600X had results similar to (d). All scale bars are I ptm.
60
(a) (b)~~~~~~~~~~
Figure 27. Images from different flow speeds used to push solutions down microfluidic channels. Images from (a) 15 mm/sec and (b) 62 mm/sec did not show much of a difference in
degree of alignment. Scale bars are I gtm.
61
(a)
(c)
Figure 28. Images from different salts used to dilute solutions before flowing through channel. (a) NaBr, (b) NaF, and (c) NaCl at 0.1 mM was used to dilute solutions 500X. From
various images comparing the use of the different salts, it was decided that using 0.1 mM NaCI had the most alignment of the three types of salts. All scale bars are 1 [tm.
62
-.
(a)
(c)
Figure 29. Comparison of removing remaining liquid in channel. (a) When the remaining
solution is allowed to air dry off the surface after removing the PDMS, many fibers remain on the surface, some of which are oriented in the direction of the flow. (b) When the remaining solution was withdrawn from the channel, fewer fibers were found on the surface, but the degree of orientation was similar to (a). (c) Pushing out the remaining solution with air gave similar results as withdrawing the solution. All scale bars are 1 tm.
63
(a)
Figure 30. Attempts at other modifications to the method of alignment. (a) A pipette was
used to push the solution multiple times through the channel. (b) Capillary action down channels with a width of 50 ytm or less was used to move the solution through the channels. Fibers such as in (b) were found in areas all across the mica surface using the capillary action method. All scale bars are 1 tm.
64
Figure 31. Fibers found on surface when using 50% ethanol to dilute stock solution 600X.
(a) and (b) are from the same sample but from different areas on the surface. Fibers appear to be oriented in three distinct directions. Similar images were taken for solutions diluted 500X and 800X. All scale bars are 1 pim.
6.4 Discussion
The abilit:y to control the placement and organization of the self-assembling peptide nanofibers would allow them to have many more applications. One such organization would be to align the fibers. Preliminary results from attempts at this showed slight orientation, but the ability to make all the fibers align in the same direction has not yet been consistently achieved. Similar methods have been used for alignment of carbon nanowires [39], but perhaps
differences in the nanowires and the nanofibers led to the less effective nanofiber alignment. For