Publisher’s version / Version de l'éditeur:
Vous avez des questions? Nous pouvons vous aider. Pour communiquer directement avec un auteur, consultez la
première page de la revue dans laquelle son article a été publié afin de trouver ses coordonnées. Si vous n’arrivez pas à les repérer, communiquez avec nous à PublicationsArchive-ArchivesPublications@nrc-cnrc.gc.ca.
Questions? Contact the NRC Publications Archive team at
PublicationsArchive-ArchivesPublications@nrc-cnrc.gc.ca. If you wish to email the authors directly, please see the first page of the publication for their contact information.
https://publications-cnrc.canada.ca/fra/droits
L’accès à ce site Web et l’utilisation de son contenu sont assujettis aux conditions présentées dans le site LISEZ CES CONDITIONS ATTENTIVEMENT AVANT D’UTILISER CE SITE WEB.
Internal Report (National Research Council of Canada. Institute for Research in Construction), 1992
READ THESE TERMS AND CONDITIONS CAREFULLY BEFORE USING THIS WEBSITE.
https://nrc-publications.canada.ca/eng/copyright
NRC Publications Archive Record / Notice des Archives des publications du CNRC :
https://nrc-publications.canada.ca/eng/view/object/?id=8ebce0eb-6b9e-4788-be27-3320057037ba https://publications-cnrc.canada.ca/fra/voir/objet/?id=8ebce0eb-6b9e-4788-be27-3320057037ba
NRC Publications Archive
Archives des publications du CNRC
For the publisher’s version, please access the DOI link below./ Pour consulter la version de l’éditeur, utilisez le lien DOI ci-dessous.
https://doi.org/10.4224/20358499
Access and use of this website and the material on it are subject to the Terms and Conditions set forth at Evaluating the fire hazard of lining materials using the OSU, cone calorimeter and full-scale fire test methods
R427 1
;
,6,
'
National Research Conseil nationalr - " - 2 Council Canada de recherches Canada
BLOC.
Institute for lnstitut deResearch in recherche en
I
Construction construction - - . -. -. . - - .be
Fire Hazard of
Lining Maierials Using the
OSU,
Cone Calorimeter and Full~Scale
Fire
Test
Methods
Andrew Kim and Robert Onno
Internal Report No. 625
D a t e of issue: March 1992
,se,L.
-
- 5 8BRC
L I B R A R Y
This is an internal report of the Institute for Research in Construction. Although not intended for general distribution, it may be cited as a reference in other publications
EVALUATING T H E F I R E HAZARD O F LINING MATERIALS USING THE OSU, CONE CALORIMETER AND FULL-SCALE F I R E TEST
METHODS
Andrew Kim and Robert Onno
ABSTRACT
Nine typical construction materials were evaluated using two small-scale standard test methods; the ASTM E-906 method using the Ohio State University Calorimeter (OSU) and the ASTM E-1354 method using the Cone Calorimeter. The same liming materials were also evaluated in full-scale room bum tests.
This paper presents a summary of the test results, including the heat release rates and ignition times from both the small-scale and the full-scale test methods. The paper also comnares small-scale test data with those of full-scale tests. Each small-scale test method was 'examined to evaluate its appropriateness in predicting the full-scale fire performance of various lining materials. Cone calorimeter data were used to approximate flashover time in the full scale test.
INTRODUCTION
There are two main concerns when dealing with a fire: fire growth and smoke production. Both pose a threat to the safety of those in a building on fire. In a compartment fue, it is the ventilation and the combustible materials themselves which determine the fire growth rate and ultimately the magnitude of the fire. Probably the most important factor in a compartment fire is the probability and speed of reaching "flashover". When a compartment fue reaches "flashover", it poses an immediate threat not only to the occupants of the fire compartment but also to occupants in other compartments in the building.
The ability to analyze materials for potential to reach flashover in a compartment fire is becoming imperative. At present, there is a full-scale room burn test proposed as the standard test to evaluate lining materials for fire hazards. Since this is a full-scale test, it is expensive, especially when compared to small-scale tests. A number of small-scale test methods are available to determine material flammability, but a direct correlation with full- scale results has not yet been established. As well, some validated method of using small- scale tests to classify materials for potential for flashover in the full-scale test has not yet been developed.
In this project, an attempt is made to evaluate two small-scale standard test methods (the Cone Calorimeter and OSU methods) for re~eatabilitv and re~roducibilitv and also to determine their validity to classify materib for fire hazard in a room fire.
-
This report comprises four sections:
1. An examination of the small-scale and full-scale test methods used in this project.
2. A comparison of the results from the small-scale tests for repeatability and reproducibility.
3 . An evaluation of the small-scale test methods to determine whether these are.
appropriate tests in evaluating materials for behaviour in the full-scale test.
4. A classification of materials based on the small-scale test results by evaluating the results of small-scale and full-scale tests.
TEST METHODS ASTM E-906 Method
This method is based on the American Society for Testing and Materials (ASTM) E-906-83 " Standard Test Method for Heat and Visible Smoke Release Rates For Materials and ProductsUl. The ASTM E-906 method utilizes the Ohio State University Calorimeter (OSU) and yields the following data:
1. Heat release rate by the thermopile method 2. Smoke release rate
Unlike other test methods, the OSU bums the sample within its enclosure. The apparatus has a regulated air flow through the system and the sample is exposed to a radiant heat flux with pilot flames located in front of the sample, near the top. The radiant heat is
provided by electric heater rods. Samples can be tested in either the horizontal or vertical position. The N n ' s OSU apparatus was modified to include measurement of heat release rates by the oxygen depletion method as well.
The rate of heat release (RHR) by the thermopile method is measured by a
thermopile located above the burning sample, registering a voltage which corresponds to a rate of heat release. The oxygen depletion method, which is not part of the present
standard, uses a probe, located in the testing cell, which reads the CO, CO2, and 0 2
percentage concentrations. In both methods, the smoke concentration is measured by a white light meter located above the combustion chamber.
Three samples of each material are tested. These samples are prepared with an aluminum foil covering over the unexposed surface. The standard requires a thermal backing board to be placed between the sample and the back of the holder, however, in the
WL's apparatus, the tray is not equipped with
a
thermal backing board. In testing, thesample is placed in a holding area for one minute and then inserted into the testing chamber. The test duration is ten minutes at which time the sample is removed.
ASTM E-1354
This method is based on the ASTM E-1354 "Standard Test Method for Heat and Visible Smoke Release Rates for Materials and Products Using an Oxygen Consumption Cal~rimeter"~. This method uses the Cone Calorimeter apparatus and yields the following information:
1. Heat release rate by the oxygen depletion method 2. Mass loss rate
3. Heat of combustion 4. Specific extinction area
5 . Cumulative smoke volume through exhaust stack 6 . Ignition time
7. Flameout time
The cone calorimeter has a sample tray on top of a stand. The stand is equipped with a scale which continuously measures the tray mass. Above the sample, a conical shaped heater is set at the desired heat flux for testing, which is determined by a radiometer. Above the heater is an exhaust duct which draws the smoke and gases emitted. A laser, located halfway down the exhaust duct, is used to measure optical obscuration by smoke in the duct.
The rate of heat release is determined by the oxygen depletion method. The smoke analysis is accomplished by using the laser which measures the obscuration through the exhaust duct. Other parameters are evaluated through the use of these results, combined with the change in mass of the sample and visual observations.
Three samples of each material are tested. The samples are prepared with aluminum foil surrounding the unexposed surface and ceramic fibre on the bottom. Two methods of covering the sample are available; using an edgeframe or a grid. The standard d e f i e s an experiment as invalid if the specimen swells to the sparker before ignition or up to the plane of the heater base during the test Such samples are re-tested with a grid. The test duration runs until flaming has terminated or the mass loss rate drops below 2.5 g/s m2. The data are then collected for an additional two minutes.
Room Test Method
This method, which is based upon the ASTM "Proposed Method for Room
F i
Test of Wall and Ceiling Materials and AssembliesW3, involves the use of a full-scale room and yields the following data either directly or by calculation:1. Heat release rate by the oxygen depletion method 2. Temperature measurements in the room
3. Smoke release rate 4. Flashover time
The full-scale test is performed in a 2.4 m x 3.7 m, 2.4 m high room which
contains one opening to simulate a doorway. A propane sand burner is located in one comer, opposite the doorway, and provides the source for ignition in the test.
Gases and smoke from the burning room
are
drawn into a hood and exhaust duct system located above the doorway and room. Concentrations of CO, C02 and 0 2are
measured in the exhaust duct, as well as the flow rate, the temperature of the gas and the optical density of the gas. Thermocouplesare
located inside the room at various positions on the ceiling. Two floor radiometers and one wall radiometer monitor the heat flux created by the burning material.The sample material is mounted on three walls of the room. The wall containing the door is excluded. The pilot for the sandburner is ignited and the propane gas flow adjusted to produce 40 kW. Five minutes later the gas flow is increased to produce 160 kW. Normally, the burner is turned off after 15 minutes at which time the test is terminated, however, for some materials that reach
flashover, the test may be terminated sooner.
TEST MATERIALS
Nine typical construction materials were tested in the full-scale and small-scale tests. The thicknesses of these materials and the sample sizes, as well as the year the materials were obtained, are listed in Table 1.
Table 1. Description of Test Materials
Sample Size for Cone (mm x mm) 100 x 100 100 x 100 100 x 100 100 x 100 100 x 100 100 x 100 100 x 100 100 x 100 100 x 100 100 x 100 100 x 100 100 x 100 100 x 100 100 x 100 Sample Material Plywood Plywood
Fire retarded plywood Woodpanel Expanded polystyrene Rigid polyurethane Chipboard Gypsumboard Plywood Plywood Woodpanel Woodpanel Particle board
Polyurethane with foil
Thickness (mm) 6.0 12.3 12.3 3.0 26.1 25.1 6.0 13.4 6.0 12.3 6.0 5.0 12.3 40.0 Year Obtained 1990 1990 1990 1990 1990 1990 1990 1990 1991 1991 1991 1991 1991 1991
Sample Size for OSU (mm x mm) 150 x 150 150 x 150 150 x 150 150 x 150 150 x 150 150 x 150 150 x 150 150 x 150 150 x 150 150 x 150 150 x 150 150 x 150 150 x 150 150 x 150
TEST RESULTS AND DISCUSSION
ASTM E-906 (OSU1 Method
The materials in this project were tested only vertically, at heat fluxes of 30 kWIm2 and 50 kWIm2.
There were changes made to the OSU apparatus between 1990 and 1991. The OSU apparatus had an additional eight holes drilled in the pilot rod above the sample, raising the number to eleven from three. Possibly as a result of
this,
the thermopile baselines changed from 4.84798 and 8.587 to 6.838 and 10.143 at the lower and higher heat fluxes respectively. In 1990, an oxygen analyzer with a span of 0 to 25% was used. In 1991, a more accurate analyzer, with a span of 11 to 2196, was used.The thermopile calibration was performed at 35 kWIm2 only, and a k~ value of 0.2999 was obtained. Initially the k~ value, determined in the calibration test, was used to evaluate results for both heat fluxes. As expected, an examination of the results at the high heat flux showed suspicious values. As Tran4 noted, the thermopile becomes less
responsive at higher heat fluxes, and a linear relationship between heat flux and k~ was derived. The use of Tran's formula yielded a k~ value of 0.3251. The data for the 50 kWIm2 tests were analyzed using the constant of 0.3251 as the k~ value.
A summary of the results is presented in Appendix A. The results showed the following trends: the Peak Heat Release (PHR) values at the high heat flux were almost
all
higher than those at the low heat flux. The Total Heat Releasedm)
was not always greater at the high heat flux than at the low heat flux.Prior to the commencement of testing, the delay time for the oxygen concentration measurement (02 offset time) was determined to be 40 s through a calibration test. A piece of 25 mm thick PMMA was burned and the time required to synchronize the RHR and the rate of mass loss (RML) curves was considered as the oxygen offset time.
The materials were tested only in the horizontal position, at flux levels of 25 and 50 kWIm2. In the ASTM E-1354 tests, some potential problems were observed with the use of the grid. At times, a material would curl inward and rise slightly. The standard considers that the test is invalid if a sample rises into the plane of the cone heater and requires that the test be repeated using a grid. However, the grid sometimes sags when placed under heat The comparison between testing with a grid and with an edgeframe showed a large difference in the RHR, ignition time and flameout time.
Sample preparation, including the
use
of an edgeframe, grid or no holding method to cover the tray, plays a very important role in this test Usinga
grid increased the ignition times and produced a slightly different bum curve. The heat release values decreased with a grid. The smoke production was greater with a grid. These differences may pose serious problems when inter-lab comparisons are desired.Even though using a grid raised ignition times, as previously mentioned, the grid had to be used for some materials. This was the case for 6 mm thick wood panelling and 5 mm thick wood panelling. These two materials were also tested without a grid, using an edgeframe. Although the heat release results from these tesrs were not usable, the ignition times are considered to be satisfactory. In future, six tests may have to be undertaken on
those materials requiring a grid so that a better representation of ignition times can be obtained.
A summary of the results is shown in Appendix A. Most parameters achieved reasonable repeatability, with the exception of ignition times, which sometimes deviated greatly. Smoke data was not found to be as repeatable as the heat release data. The reproducibility of the test method seemed adequate by comparing NFL results with the results of tests on the same materials conducted at Forintek Canada Corporation in 1990. Room Test Method
Flashover time was determined when a paper bundle on the floor ignited. Previous tests were terminated at flashover because hot gases and flames drawn into the exhaust duct could damage the fan system. This created a problem in not knowing the heat release rate at flashover because the oxygen analyzer has a response time of up to 60 s. For these tests, a modification was made to the exhaust duct by installing a fine water spray system near the fan system well beyond the area of measurement. With this modification, tests were continued beyond flashover without damaging the fan system and thus RHR at flashover could be calculated.
Three smoke meters were installed in the exhaust duct to measure the smoke release rate; a white light smoke meter, a laser smoke meter, and a prototype developed in-house by the Nn. Close examination of the values obtained from the white light smoke meter showed that they deviated from those of the other two meters, so the white light results were not used in this project
Since the oxygen delay time was longer than the carbon dioxide delay time, a method of synchronizing the two delay times was used. To shorten the 0 2 delay time, the
0 2 data were moved up in the data fde so that the changes in @readings and the changes in the CO2 readings would correspond to the sand burner ignition. The difference was typically 18 to 30 s.
A summary of the 1991 room bum test results is located in Appendix A.
COMPARISON OF TEST RESULTS
After two summers of testing (1990 and 1991), a large database of test results had been accumulated. An examination of these results showed the accuracy and repeatability of those test methods used in this project.
Some of the materials used for the 1990 testing were also used in the small scale testing in 1991. For these materials, it meant an extra year of conditioning which would tend to affect wood materials more than the non-wood materials since the characteristics of non-wood materials are less affected by atmospheric conditions.
OSU Results
Five materials were available for comparison with the 1990 OSU results: gypsumboard, polyurethane, polystyrene, fire retarded plywood and plywood. Test results from 1990 and 1991 for these materials are shown in Appendix B. The three parameters compared using the oxygen depletion and thermopile methods, at both heat flux levels, are:
1. Peak Heat Release
2 . Total Heat Released
3. Time of Peak Heat Release
A comparison of PHR values for 1990 and 1991 shows that the values are similar with only small differences. Oxygen 30 (using the oxygen depletion method at 30 kWIm2) values and Oxygen 50 (using the oxygen depletion method at 50 kWlm2) were typically lower in 1991. Thermopile 30 (using the thermopile method at 30 kWlm2) values were higher while Thermopile 50 (using the thermopile method at 50 kWlm2) values were lower in 1991.
The THR values were also similar, with one exception in that the Thermopile 50 values were substantially lower in 1991. This is probably due to the fact that different k~ values were being used in the thermopile method, as mentioned previously. The times for PHR using the thermopile method at both 30 kWIm2 and 50 kWIm2 fluxes were
consistently lower in 1991. The times for PHR using the oxygen depletion method were approximately the same in both 1990 and 1991. Tran'f states that the oxygen results should be greater than the thermopile results, however, this pattern was not observed consistently in these tests.
A few potential problems were noticed with the OSU tests. One of the problems was with the thermopile analysis method. Since the thermopile becomes less responsive at higher flux levels, results can be misleading and difficult to compare. Using the oxygen depletion method as the primary method, eliminates this problem. In the OSU tests, it was also difficult to observe the material burning, due to the apparatus configuration and the presence of the pilot flame. This makes it difficult to determine what is happening, while observing the results. A comparison of the OSU results from the 2 years shows that there was a substantial difference indicating that repeatability of the tests is not adequate.
Cone Calorimeter Results
To evaluate the reproducibility of the cone calorimeter, the results obtained by Forintek in 1990 and by the NFL in 1991 were compared. The following parameters were examined:
1. Ignition Time
2. Total Heat Released at Peak Heat Release 3. Total Heat Released
4. Peak Heat Release
5. Time of Peak Heat Release
There were differences in the methods of operation of the 2 cone calorimeters, such as, sample preparation and the use of sample frames. A frame was consistently used in Forintek's tests, even for the PMMA calibration tests. In the NET tests, however, a grid
was never used. Forintek's heater was operated at much lower temperatures than the N n ' s , for the same heat flux level. It is not clear
as
to why there was a difference in temperatures between the two cone calorimeters for same heat flux level. Also, the oxygen analyzer used by Forintek had a time lag of 90 s compared with the NFL's 40 s.Forintek and the NFL showed different results for ignition times. The results for gypsumboard, plywood and chipboard at the high heat flux level were identical. However, gypsumboard and polystyrene at the low heat flux level did not ignite in the NFL tests but did in the Forintek tests. The same happened with polyurethane at the high heat flux level.
In general, the ignition times obtained by the NFL for the same samples were greater than those obtained by Forintek.
The total heat released values until the time of peak heat release were similar. This is a good indication that the materials were burning at reasonably similar rates. However, the total heat released values for the duration of the tests were not similar. Since Forintek did not analyze its tests according to the standard for flameout time, it is not possible to compare these results. The results obtained from the NFL should be somewhat lower than Forintek's because the duration of the test by Forintek was longer. This did not hold true for all materials.
The peak heat release ~ s u l t s were very close except for a few where the NFL's results were a bit lower.
The NFL's time of peak heat release values did not compare well with Forintek's results. The
Nn's
results for gypsumboard and chipboard were less at the low flux level and greater at the high flux level. Plywood and woodpanel were, however, opposite to that. Polyurethane and fire retarded plywood had higher values and polystyrene had lower values at both heat fluxes.It was noticed later that Forintek's calibration test with PMMA showed ignition times for PMMA that were outside of the limits prescribed. This may indicate that Forintek's cone was not functioning properly and may explain some of the differences in the test results between Forintek and the NFL. However, considering the differences in the 2 cone apparati, the results were quite comparable, in general, and the materials appear to have burned at similar rates.
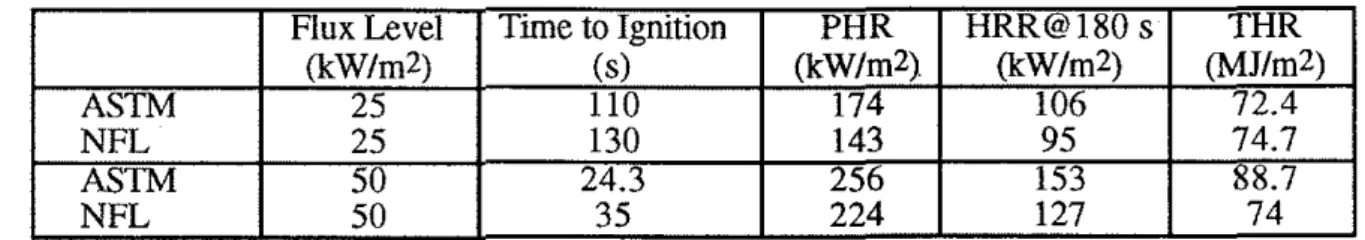
The NFL's results for one material, 12.5 mm particle board, were compared with the results of the ASTM Round Robin Inter-Laboratory Trials5. The information is shown in Table 2.
Table 2. Comparison with ASTM Round-Robin Results for 12.5 mm Particle Board
Table 2 shows that the NFL's ignition times are greater at both heat fluxes; the PHR and HRR at 180 s are consistently lower and the total heat released is very close at both the low and high heat fluxes. These results are quite close considering there could be some differences in the materials, since the materials were not from the same batch.
CORRELATION OF CONE CALORIMETER TEST RESULTS WITH FULL- SCALE RESULTS
ASTM NFL ASTM NFL
To achieve a means of evaluating fire hazards of materials using small-scale test data, a correlation of several parameters obtained in small-scale tests with full-scale test
HRR@180
s
OcW/n-2) 106 95 153 127results was undertaken.
THR (MJIm2) 72.4 74.7 88.7 74 PHR (kWIm2) 174 143 256 224 Flux Level OcW/m2) 25 25 50 50 Time to Ignition (s) 110 130 24.3 35
To address the correlation of parameters, all available information must be closely examined. In the full-scale test, the primary interest is flashover time. To correlate small- scale results with full-scale results, OSU data from 1990 were used previously7. In 1991, emphasis was placed on correlating the cone calorimeter data with full-scale results.
The objective of the correlation was to predict full-scale fue behaviour using small- scale test results. The materials were classified into three groups; materials that reached flashover in less than five minutes, over five minutes, and those which did not reach flashover. Initially, the emphasis was placed on approximating flashover times which could be used to separate materials that flashover from those that do not.
A relationship, involving three variables from the cone calorimeter test, has been put forward by Ostman and Nusshaum6. Those variables, used in the analysis, were total heat released at peak heat release, ignition time and density of the material. Their cone calorimeter testing procedures were similar to the
Nn's.
Their full-scale tests were conducted with a much higher ignition flame in that their test began with a 100 kW ignition flame and, after ten minutes, it was increased to 300 kW. The correlations acquired by them were deemed to be successful.The relationship proposed by Ostman and Nussbaum6 is as follows: Tf = a * ti
*
SQRT (density) 1 (THROPHR)+
b whereT f = calculated flashover time (s)
ti = time to ignition of cone at 25 kWIm2 (s)
density = density (kg/m3)
THROPHR = total heat released at peak release of cone at 50 kWlm2 (JIm2) a = constant (2.76
*
106,J
*
(kg*
rn)-O.s)b = constant ( -46, s )
When a material is tested in the cone calorimeter, the heat release c w e shows two distinct peaks. Most materials have an initial peak heat release near the beginning of the experiment, and then another peak heat release toward the end of the experiment In examining the heat release rate results, one finds that some materials have the largest peak heat release at the beginning of the test, while others have the largest peak heat release near the end of the test This means that experiments with early PHR will have
a
small total heat released at the peak heat release (THR@PHR) value, whiie others will have a substantially larger result. The results of Ostman and Nussbaum6 seem to show that they have taken data from tests with the peak heat release occurring near the end of the test. TheirTHROPHR values are quite large, mostly over 20, while THROPHR values of less than 5 are typical of tests with early PHR.
For the first trial, the empirical correlation proposed by Ostman and Nussbaum6 was used on the NFL data (see Table 3). In this analysis, to determine THROPHR values, only tests with PHR at the later stage were included. Heat release rate curves were not consistent in some materials. For those materials, one test showed PHR near the end of the test while another test showed early PHR. This meant that, instead of being able to use three tests to average a parameter, sometimes only one or two tests could be used to determine THROPHR. This could be another possible source of error in correlating those particular materials. As expected, there was no overall correlation. Since their full-scale tests were performed with a higher ignition flame level, their predictions showed flashover times shorter than the NF'L's results.
The cone calorimeter test results of Ostman and Nussbaum6 were also compared to the NFL results. To effectively compare the results, a composite value was defined by multiplying the ignition time with the square root of the density, and then dividing by the THR@PHR, whose values were obtained from the cone calorimeter. Examining the Ostman and Nussbaum6 data, the composite value of 74.4 was produced for particle board. NFL. results show a composite value of 58 for particle board. These are quite close
comparisons considering the Ostman and Nussbaum6 particle board was only 10 mm thick as compared to 12.5 mm used in these tests. These results demonstrate that the cone procedures used by Ostman and Nussbaurn6 and by the Nn seem to be similar.
Unfortunately, other materials tested by Ostman and Nussbaum, except plywood, are quite different from the list of materials tested by Nn. Also, their materials list had sample thicknesses greater than 12.5 mm while the Nn test materials had various thicknesses ranging from 3 mm to 40 mm. By studying the values obtained from the cone calorimeter for these materials, it was obvious that there would have to be some allowance for material thicknesses. Ostman and Nussbaum6 did not address this problem specifically, although they mentioned the possibility of differences in results associated with specimen thickness.
There are some materials, such as polyurethane, for which it was difficult to establish a clear ignition time in the cone calorimeter test, but which reach flashover in the full-scale test. To use flashover correlations, such as the one proposed by Ostman and Nussbaum6, on these materials, there is a need to establish "apparent" ignition times for these materials in the cone calorimeter tests. An effort was made to examine other aspects
which could indicate ignition when the visual aspect was not present, and there does appear to be one phenomenon, smoke production, which was associated with ignition. Examining smoke production rate curves for some materials, there seemed to be a plateau located on the cumulative smoke volume graph at ignition time. This phenomenon is more apparent at the low heat flux level. This is, however, not true for all materials. For some materials, the plateau comes slightly after the ignition time, or there is no distinct plateau, however, this was used to estimate the ignition times for non-igniting material. It was not intended to be an exact representation but only to approximate ignition time.
Ignition times were estimated using this method for some materials as shown in Table 4. An approximate time of 480 s was estimated for polyurethane foam with foil. Polystyrene was one material which did not demonstrate a plateau, even after 20 min of testing. For polystyrene, a value of 20 min, which was the test duration, was given as an ignition time for calculation purposes.
Since some materials showed two peaks on the heat release curve, it was diffcult to determine which was the higher peak. Depending on which peak was considered higher, the value of THR@PHR changed drastically. This presents a problem in correlating the results. An attempt was made to try THR at test termination instead of THR@PHR. These THR values, from tests at 25 kWlm2 and 50 kWIm2, are shown in Tables 5 and 6
respectively.
Various combinations of ti (ignition time), density, PHR and THR were tried in an attempt to correlate the cone calorimeter test results with full-scale flashover time. The objective of the correlation was not to predict the exact flashover time, but to determine the fire hazard of a material according to its probability of reaching flashover in the full-scale test. The best correlation to satisfy the requirement was obtained with the following formula which is similar to Ostman and Nussbaum6 except that THR is used instead of THR@PHR.
Table 7 shows results obtained with the above equation. Constants a and b for the best fit were found to be 3.57 and 89. Closer examination of the values showed that there
is a certain relationship between the calculated values and the thickness of the materials. After several tries, the following modification was made to the equation:
Tf = a
*
ti*
SQRT(de1)*
SQRT(density) I(THR)
+
b wheredel = sample thickness, mm
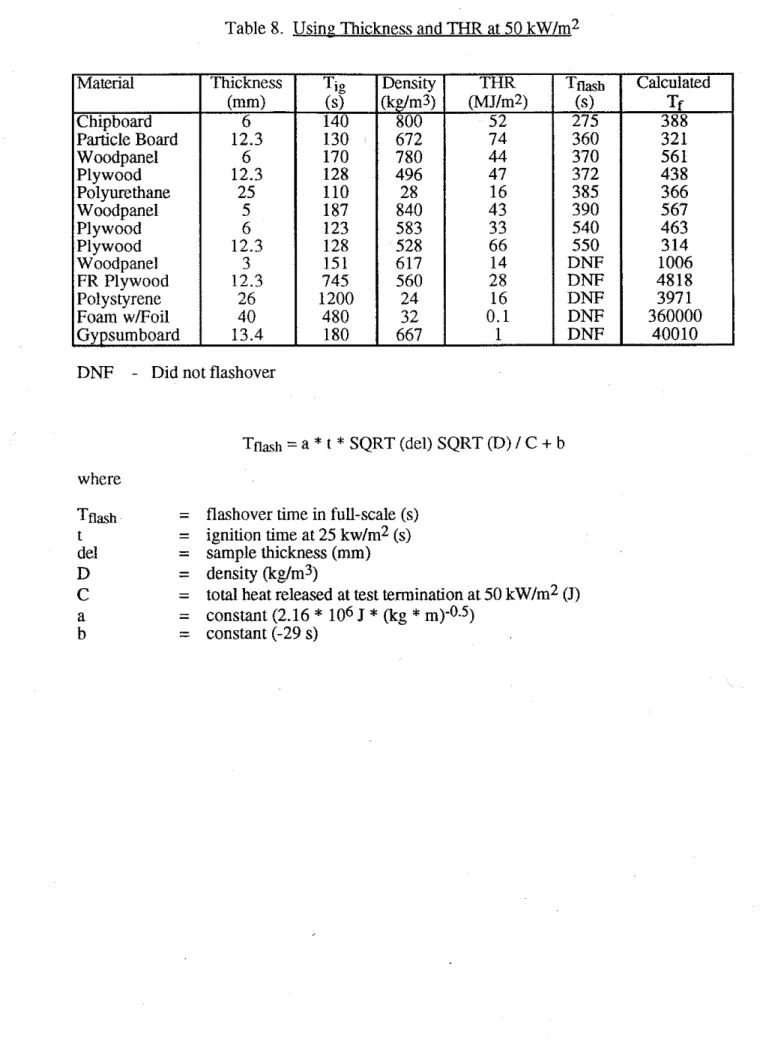
Table 8 shows the values calculated using the best fit correlation of the new
equation. Even though there is no exact match between the Tflash and calculated Tf values, it shows closer correlation. There is, as well, a definite value separating the flashover materials from non-flashover materials. The flashover materials have calculated Tf values less than 600 and the non-flashover materials have calculated Tf values larger than 1000. The Tflash values for plywood samples showed a large difference between the 1990 and
1991 tests (314 vs 430), even though the small-scale test results were similar. The aim here is not necessarily to correlate the flashover time, which may depend on the ignition flame size, but to determine the fire hazard potential of materials by determining whether
the material will flashover or not in full-scale tests.
Wood panel with 3 mm thickness showed the lowest calculated Tf value among the non-flashover materials. This is reasonable because 3 mm thick wood panel almost reached flashover in the full-scale test. The sample bumed off just before reaching flashover because the sample was so thin. Comparing polyureihane and polystyrene, one finds that small-scale test results for both materials are similar exceut the time of ignition (tig) at 25 kWIm2. The time of ignition for polyurethane was estimated as 110 s ;hereas tig for polystyrene was estimated as 1200 s based on the smoke release rate as discussed previously. This difference in tig values produces a large difference in calculated Tf values, indicating one as a flashover material and the other
as
a non-flashover material. However,if one looks at the ignition time (tig) at 50 kW/m2 in the cone calorimeter test, one then finds that the ignition times are similar for both materials (25 s compared to 28 s). Under this condition, there is no significant difference between the two materials based on the cone calorimeter test results. The major difference between polystyrene and polyurethane in the full-scale test was that the polystyrene melted away from the ignition flame and did not contribute significantly to flame spread. Such a phenomenon is not addressed in the horizontal cone calorimeter tests. Vertical sample orientation in the cone calorimeter may identify such material behaviour, however, there has been no systematic study done to address the sample orientation problem. This problem requires further study to develop an understanding of the behaviour of melting materials in full-scale and small-scale tests.
Attempting to correlate small-scale results with full scale results has brought two major problems to light: What is the most representative way of dealing with materials which do not flashover at low heat fluxes and what is the appropriate method of
incorporating material thicknesses in the correlation? These problems must be addressed before conclusions can be reached.
SUMMARY
Nine typical construction materials were evaluated using two small-scale standard test methods; the ASTM E906 method using the Ohio State University Calorimeter (OSU) and the ASTM El354 method using the cone calorimeter. The same lining materials were also evaluated in full-scale room bum tests.
Based on a comparison of small-scale and full-scale test data, it was possible to evaluate the effectiveness of the small-scale methods. Although each method may be effective for the purpose for which it was designed, this effectiveness is limited when correlated with the full-scale results. Some potential problems with each method were observed. In the ASTM E-1354 (cone calorimeter) tests, some potential problems were seen with the use of a grid.
The cone calorimeter and OSU methods were evaluated to determine their
repeatability and reproducibility. The cone calorimeter test method was also examined to evaluate its appropriateness for predicting the full-scale fue performance of various lining materials. Various combinations of sample density, thickness, ignition time, PHR and THR from the cone calorimeter data were used to approximate flashover time in the full- scale test. The aim here was not necessarily to predict the flashover time, which may depend on the ignition flame size, but to determine the fue hazard potential of materials by determining whether the material will flashover or not in full-scale tests.
REFERENCES
1. "Standard Test Method for Heat and Visible Smoke Release Rates for Materials and Products" (ASTM E-906), American Society for Testing and Materials, Philadelphia,
1 9 x 1
A < " d .
2. "Standard Test Method for Heat and Visible Smoke Release Rates for Materials and Products using an Oxygen Consumption Calorimeter" (ASTM E-1354). American Society for Testing and Materials, Philadelphia, 1990.
3 . "Proposed Method for Room Fire Test of Wall and Ceiling Materials and
Assemblies", Annual Book of ASTM Standards, 1982, Part 18, pp. 1618-1638. 4 . Tran, Hao C., "Rates of Heat and Smoke Release of Wood in an Ohio State
University Calorimeter", Fire and Materials, Vol. 12, 1988, pp. 143-151. 5 . "ASTM Cone Calorimeter Inter-Laboratory Trials", ASTM Task Group E5.21
TG 60, January 3, 1990.
6. Ostrnan, B. A.-L and Nussbaum, R. M., "Correlation between Small-Scale Rate of Heat Release and Full-Scale Room Flashover for Surface Lininos", F i e Safetv Science - Proceedings of the Second International ~ ~ m ~ o s i u m , - ~ e m i s p h e r e *
Publishing Corp., pp. 823-832.
7 . Kim, A. and Dyck, T., "Full-scale and Small-Scale Tests of Room Lining Materials", IRC Internal Report No. 606, March 1991.
Table 3. Calculated Using Ostman & Nussbaum Correlation
DNI - Did not ignite
DNF - Did not flashover
where Calculated T f 244 114 751 372 NIA 877 135 344 1392 2570 NIA NIA NIA
Tflash = flashover time in full-scale
(s)
t = ignition time at 25 kw/m2 (s) D = density (kg/m3)
C = total heat released at peak heat release at 50 k W / d Q
a = constant (2.76
*
lo6J
* (kg
*
m)-O.5) b = constant (-46 s) Material Chipboard Particle board Woodpanel Plywood Polyurethane Woodpanel Plywood Plywood Woodpanel FR Plywood Polystyrene Foam w/Foil Gypsumboard Tilash (s) 265 360 370 372 385 390 540 540 DNF DNF DNF DNF DNF Thickness (mm) 6 12.3 6 12.3 25 5 12.3 6 3 12.3 26 40 13.4 Tig (s) 140 130 248 204 DNI 277 128 123 121 745 DNI DNI DNI Year Recvd 9 1 9 1 9 1 90 90 91 9 1 91 90 90 90 91 90 Density w m 3 ) 800 672 780 496 28 840 583 528 617 560 24 32 667 THR@PHR (urlmz) 37.7 58 24 30 1.05 24 47 20 5.77 18.6 5.01 0.43 0.3213
Table 4. -
DNF - Did not flashover Material Chipboard Particle board Woodpanel Plywood Polyurethane Woodpanel Plywood Plywood Woodpanel FR Plywood Polystyrene Foam w/Foil Gypsurnboard where
Tflash = flashover time in full-scale (s) t = ignition time at 25 kw/rn2 (s) D = density &glrn3)
C = total heat released at peak heat release at 50 kw/rn2 (.I)
a = constant (1
*
lo6 J*
(kg*
rn)-O.5) b = constant (0 s) Thickness (mm) 6 12.3 6 12.3 25 5 6 12.3 3 12.3 26 40 13.4 Density @dm31 800 672 780 496 28 840 583 528 617 560 24 32 667 Tig (s) 140 130 170 128 110 187 123 128 151 745 1200 480 180 THR@PHR (MJIrn2) 37.7 58 24 30 1.05 24 20 47 5.77 18.6 5.01 0.43 0.32 Tflash 6 ) 275 360 362 372 385 390 540 550 DNF DNF DNF DNF DNF Calculated Tf 105 58 198 81 554 226 148 63 650 948 1173 6315 1452714
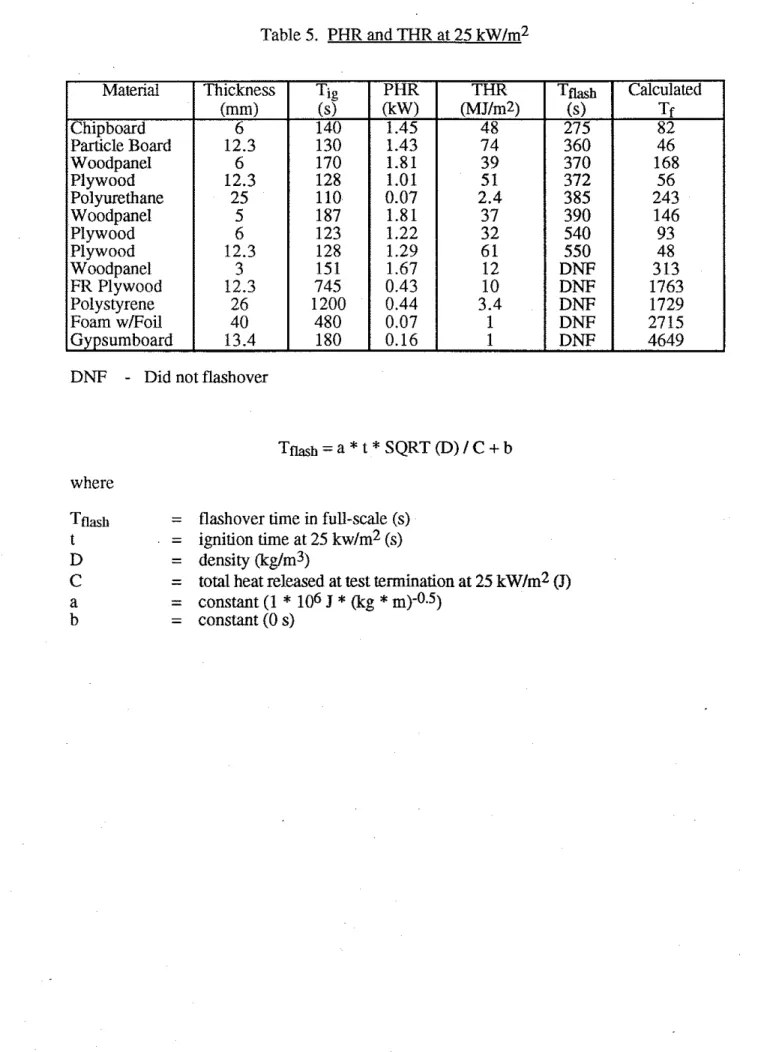
Table 5. PHR and THR at 25 kW/m2
DNF - Did not flashover
where Material Chipboard Particle Board Woodpanel Plywood Polyurethane Woodpanel Plywood Plywood Woodpanel FR Plywood Polystyrene Foam w/Foil Gypsumboard
Tflash = flashover time in full-scale (s)
t = ignition time at 25 kw/m2 (s) D = density (kgIm3)
C = total heat released at test termination at 25 k w h 2 (J) a = constant (1
*
106 J*
(kg*
m)-0.5) b = constant (0 s) THR W m 2 ) 48 74 39 5 1 2.4 37 32 61 12 10 3.4 1 1 Thickness (mm) 6 12.3 6 12.3 25 5 6 12.3 3 12.3 26 40 13.4 Tflasj, (s) 275 360 370 372 385 390 540 550 DNF DNF DNF DNF DNF Tis (s) 140 130 170 128 110 187 123 128 151 745 1200 480 180 Calculated Tf 82 46 168 56 243 146 93 48 313 1763 1729 2715 4649 PHR (kw) 1.45 1.43 1.81 1.01 0.07 1.81 1.22 1.29 1.67 0.43 0.44 0.07 0.1615
Table 6. PHR and THR at 50 k ~ l m 2
DNF - Did not flashover
Material Chipboard Particle Board Woodpanel Plywood Polyurethane Woodpanel Plywood Plywood Woodpanel FR Plywood Polystyrene Foam w/Foil Gypsumboard where
Tflash = flashover time in full-scale (s) t = ignition time at 25 kwIm2 (s) D = density (kglm3)
C = total heat released at test termination at 50 kw/m2 (J) a = constant (1
*
106J
*
(kg*
m)-0.5) b = constant (0 s) Thickness (mm) 6 12.3 6 12.3 25 5 6 12.3 3 12.3 26 40 13.4 Tis (s) 140 130 170 128 110 187 123 128 151 745 1200 480 180 PHR OcW) 2.01 2.24 2.7 1 1.41 0.32 2.95 1.47 1.6 1.91 0.74 2.9 0.02 0.58 Calculated Tf 76 46 108 6 1 36 126 90 45 268 630 367 27153 4649 Tm OvrJIm2) 52 74 44 47 16 43 33 66 14 28 16 0.1 1 Tilash ( s ) 275 360 370 372 385 390 540 550 DNF DNF DNF DNF DNF16 Table 7. Using
THR
at 50 kw/m2 DNF where Calculated Tf 360 253 475 307 218 539 410 250 1046 2338 1399 96945 16686 Did not flashoverT f l a ~ h (s) 275 360 370 372 385 390 540 550 DNF DNF DNF DNF DNF
= flashover time in full-scale (s) = ignition time at 25 kw/m2 (s) = density (kgIm3)
= total heat released at test termination at 50 kw/m2 (J) = constant (3.57
* 106 J
*
(kg*
m)-0.5) = constant (89 s) Density (kdm3) 800 672 780 496 28 840 583 528 617 560 24 32 667 Tig (s) 140 130 170 128 110 187 123 128 151 745 1200 480 180 Material Chipboard Particle Board Woodpanel Plywood Polyurethane Woodpanel Plywood Plywood Woodpanel FR Plywood Polystyrene Foam w/Foil Gypsumboard THR (MJIm2) 52 74 44 47 16 43 33 66 14 28 16 0.1 1 Thickness (mm) 6 12.3 6 12.3 25 5 6 12.3 3 12.3 26 40 13.417
Table 8. Using Thickness and THR at 50 kw/m2
DNF - Did not flashover
Tflash = a
*
t*
SQRT (del) SQRT @) I C + b Material Chipboard Particle Board Woodpanel Plywood Polyurethane Woodpanel Plywood Plywood Woodpanel FR Plywood Polystyrene Foam wlFoil Gypsumboard where Thickness (mm) 6 12.3 6 12.3 25 5 6 12.3 3 12.3 26 40 13.4Tflash = flashover time in full-scale (s)
t = ignition time at 25 kwIm2 (s) del = sample thickness (mm) D = density (kglm3)
C = total heat released at test termination at 50 kw/m2 (J) a = constant (2.16 * 106 J
*
(kg*
m)-O.5) b = constant (-29 s) T,g (s) 140 130 170 128 110 187 123 128 151 745 1200 480 180 Tflash 6 ) 275 360 370 372 385 390 540 550 DNF DNF DNF DNF DNF Density (kg/m3) 800 672 780 496 28 840 583 528 617 560 24 32 667 Calculated Tf 388 321 561 438 366 567 463 3 14 1006 4818 397 1 360000 40010 THR ( M J I ~ ~ ) 52 74 44 47 16 43 33 66 14 28 16 0.1 1APPENDIX A
Ohio State Universitv Calorimeter Results
Flux:
30 kWIm2TPHR T i e to peak heat release rate Material Plywood Plywood FR Plywood Chipboard Polystyrene Polyurethane Woodpanel Gypsumboard Plywood Plywood Woodpanel Woodpanel Foam wlFoil Particle board Thickness (mm) 6.0 12.3 12.3 6.0 26 25 3.0 13.4 6.0 12.3 5.0 6.0 40 12.3 Year Recvd 90 90 90 90 90 90 90 90 91 9 1 9 1 91 91 91 Thermopile Method PHR (kW) 5.4 4.4 3.1 6.2 1.9 1.1 5.2 1.6 4.9 4.7 8.1 8.1 0.5 4.8 Oxygen Method PHR
m)
4.6 3.6 2.4 5.3 2.2 1.3 4.6 1.2 4 4 7.9 7.4 0.3 4.2 TpHR (s) 182 475 517 234 112 11 86 114 214 429 186 205 159 608 THRNU
1101 1685 865 1567 41 1 332 735 269 1151 1797 1444 1535 262 1860 TPHR (s) 208 482 549 266 137 35 113 143 239 469 211 232 424 647 THR 821(kJ)
1264 655 1143 262 177 509 63 882 1498 1174 1252 139 1378Ohio State Universitv Calorimeter Results Flux: 50 kw/rn2
TPEZ Time to peak heat release rate Material Plywood Plywood FR Plywood Chipboard Polystyrene Polyurethane Woodpanel Gypsumboard Plywood Plywood Woodpanel Woodpanel Foam w/Foil Particle board Oxvzen . Method Thermopile Method Thickness (mm) 6.0 12.3 12.3 6.0 26 25 3.0 13.4 6.0 12.3 5.0 6.0 40 12.3 THR (H) 1019 1552 829 1320 453 339 780 23 1 1169 1619 1387 1475 32 1 1796 PHR & w ) 6.6 5.1 2.8 6.7 3.4 2 6.8 1.8 5.9 4.9 10.9 10.7 0.8 4.9 PHR
W)
5.5 4.4 2.3 6.0 1.8 0.9 6.1 0.9 5.5 5.1 9.4 10 0.4 4.6 Year Recvd 90 90 90 90 90 90 90 90 9 1 9 1 9 1 91 91 91 T ~ H R (s) 165 362 422 196 132 37 99 63 194 393 177 192 269 498 TPHR (s) 137 329 384 164 97 10 70 33 168 356 149 162 206 458 THR OcJ) 65 1 1248 528 1013 166 5 1 487 5.1 916 1595 1158 1339 110 1725A-3
Cone Calorimeter Results Flux: 25 kW/m2
DNI Did not ignite
TPHR T i e to peak heat release rate Ti, Time to ignition
Material Plywood Plywood FR Plywood Chipboard Polystyrene Polyurethane Woodpanel Gypsumboard Plywood Plywood Woodpanel Woodpanel Foam w/Foil Particle board Thickness (mm) 6.0 12.3 12.3 6.0 26 25 3.0 13.4 6.0 12.3 5.0 6.0 40 12.3 Year Racvd 90 90 90 90 90 90 90 90 9 1 91 91 91 91 91 l.1, (s) 144 205 745 139 DNI DNI 121 DNI 122 128 277 248 DNI 130 PHR (kW/m2) 137 100 43 145 44 6.5 167 16 122 128 181 181 7.4 143 TPHR (s) 178 215 830 227 31 299 141 220 139 138 361 370 395 395 THR (MJ/m2) 27 51 10 48 3.4 2.4 12 1 32 61 37 39 1 74
Cone Calorimeter Results Flux: 50 kw/m2
DNI Did not ignite
TPHR Time to peak heat release rate Tig Time to ignition
THROPHR (MJ/m2) 17.35 30.36 18.75 37.7 5.01 1.05 5.77 0.32 19.72 47.32 23.81 24.34 0.43 58.29 PHR (kWIrn2) 123 140 75 20 1 290 32 191 58 147 160 295 27 1 2 224 Tig ( s ) 14 24 53 22 28 DNI 43 DNI 24 23 37 60 DNI 35 Material Plywood Plywood FR Plywood Chipboard Polystyrene Polyurethane Woodpanel Gypsumboard Plywood Plywood Woodpanel Woodpanel Foam wEoil Particle board Tpm (s) 74 300 465 191 43 83 78 32 116 182 167 200 272 232 Thickness (mm) 6.0 12.3 12.3 6.0 26 25 3.0 13.4 6.0 12.3 5.0 6.0 40 12.3 THR (MJlm2) 25 47 28 52 16 3 14 1 33 66 43 44 0 74 Year Recvd 90 90 90 90 90 90 90 90 9 1 9 1 9 1 9 1 91 9 1
APPENDIX B
Ohio State Universitv Calorimeter Results for 1990 and 1991 Flux: 30 kW/m2
TPHR Time to peak heat release rate Material Plywood Plywood FR Plywood FR Plywood Polyurethane Polyurethane Gypsumboard Gypsumboard Polystyrene Polystyrene Woodpanel Woodpanel Chipboard Chipboard Thickness (mm) 12.3 12.3 12.3 12.3 25 25 13.4 13.4 26 26 3 3 6 6 Year Tested 90 9 1 90 9 1 90 9 1 90 91 90 9 1 90 9 1 90 9 1 PHR (kW) 3.9 4.4 2.4 3.1 1.1 1.1 0.2 1.6 1.9 1.9 5.4 5.2 6.0 6.2 PHR O M ) 3.4 3.6 2.1 2.4 2 1.3 0.9 1.2 2.4 2.2 6.9 4.6 6.6 5.3 Thermooile T~~ (s) 512 475 532 517 13 10.5 173 114 278 112 88 86 233 234 Method THR
NO
1324.5 1685 491 865 175.8 332 81.1 269 417 411 610 735 1403 1567 Oxvgen Method TPm 6) 486 482 535 549 28 35 218 143 262 137 100 113 250 266 THR(M)
. 1052 1264 426 655 188 177 35 63 335 262 629 509 1224 1143Ohio State Universitv Calorimeter Results for 1990 and 1991 Flux: 50 kW/m2
TPHR Time to peak heat release rate Material Plywood Plywood
FX
PlywoodFX
Plywood Polyurethane Polyurethane Gypsumboard Gypsumboard Polystyrene Polystyrene Woodpanel Woodpanel Chipboard Chipboard Year Tested 90 91 90 91 90 91 90 9 1 90 91 90 9 1 90 91 Thickness (mm) 12.3 12.3 12.3 12.3 25 25 13.4 13.4 26 26 3 3 6 6 PHR (kW) 6.3 4.4 4 2.3 2.1 0.9 2.5 0.9 2.9 1.8 7.8 6.1 8.4 6.0 Thermonile Tpm (s) 402 329 398 384 12 10 35 33 158 97 64 70 175 164 Method THR &J) 2126 1248 1143 528 413 51 296 5.1 510 166 846 487 1554 1013 PHR Ocw) 5.9 5.1 3.2 2.8 3.2 2 2.4 1.8 4.1 3.4 9.2 6.8 8.1 6.7 Tpm (s) 397 362 394 422 26 37 46 63 153 132 75 99 185 196 THR(w)
1634 1552 817 829 289 339 83 23 1 410 453 360 780 1081 1320Cone Calorimeter Results for 1990 and 1991 Flux: 25 kw/m2
TPHR Time to peak heat release rate Ti, Time to ignition
Material Plywood Plywood FR Plywood FR Plywood Polystyrene Polystyrene Polyurethane Polyurethane Gypsumboard Gypsumboard Thickness (mm) 12.3 12.3 12.3 12.3 26 26 25 25 13.4 13.4 Year Tested 90 9 1 90 9 1 90 9 1 90 91 90 9 1 Tlg (s) 137 205 390 745 26 DNI DNI DNI 23 DNI PHR (kW/m2) 133 100 44 43 101 44 8 7 20 16 TPHR 6 ) 148 215 623 830 400 31 63 299 350 220 THR (MJ/m2) 56 51 16.6 10 11.7 3.4 0.6 2.4 1.9 1.8
Cone Calorimeter Results for 1990 and 1991 Flux: 50 kW/mz
TPHR Time to peak heat release rate
Ti8 Time to ignition Material Plywood Plywood FR Plywood FR Plywood Polystyrene Polystyrene Polyurethane Polyurethane Gypsum board Gypsum board T,g ( s ) 23 24 35 53 484 28 62 DNI 30 30 Thickness (mm) 12.3 12.3 12.3 12.3 26 26 25 25 13.4 13.4 Year Tested 90 9 1 90 9 1 90 91 90 91 90 9 1 PHR (kWIm2) 159 141 76 74 210 290 47 32 67 58 T ~ H R (s) 420 300 385 465 68 43 37 83 28 32 THR (MJlm2) 38 47 30 28 13 16 6.7 3.2 4.9 1.1 THR@PHR - (MJlmZ) 31 30 16 19 6.6 5.0 1.4 1.1 0.9 0.3