Publisher’s version / Version de l'éditeur:
Journal of Polymer Science: Part B: Polymer Physics, 41, 18, 2003
READ THESE TERMS AND CONDITIONS CAREFULLY BEFORE USING THIS WEBSITE.
https://nrc-publications.canada.ca/eng/copyright
Vous avez des questions? Nous pouvons vous aider. Pour communiquer directement avec un auteur, consultez la
première page de la revue dans laquelle son article a été publié afin de trouver ses coordonnées. Si vous n’arrivez pas à les repérer, communiquez avec nous à PublicationsArchive-ArchivesPublications@nrc-cnrc.gc.ca.
Questions? Contact the NRC Publications Archive team at
PublicationsArchive-ArchivesPublications@nrc-cnrc.gc.ca. If you wish to email the authors directly, please see the first page of the publication for their contact information.
NRC Publications Archive
Archives des publications du CNRC
This publication could be one of several versions: author’s original, accepted manuscript or the publisher’s version. / La version de cette publication peut être l’une des suivantes : la version prépublication de l’auteur, la version acceptée du manuscrit ou la version de l’éditeur.
For the publisher’s version, please access the DOI link below./ Pour consulter la version de l’éditeur, utilisez le lien DOI ci-dessous.
https://doi.org/10.1002/polb10580
Access and use of this website and the material on it are subject to the Terms and Conditions set forth at
Raman spectroscopic investigation of the phase behavior and phase
transitions in a poly(methyl methacrylate)-carbon dioxide system
Takahashi, M.; Yamamoto, Y.; Nawaby, A. V.; Handa, Y. P.
https://publications-cnrc.canada.ca/fra/droits
L’accès à ce site Web et l’utilisation de son contenu sont assujettis aux conditions présentées dans le site LISEZ CES CONDITIONS ATTENTIVEMENT AVANT D’UTILISER CE SITE WEB.
NRC Publications Record / Notice d'Archives des publications de CNRC:
https://nrc-publications.canada.ca/eng/view/object/?id=b7e5fc72-82e0-4af5-bb58-4ca492ee9cfe https://publications-cnrc.canada.ca/fra/voir/objet/?id=b7e5fc72-82e0-4af5-bb58-4ca492ee9cfeand Phase Transitions in a Poly(methyl methacrylate)–
Carbon Dioxide System
MASAYOSHI TAKAHASHI,1
YOSHITAKA YAMAMOTO,2
A. VICTORIA NAWABY,3
Y. PAUL HANDA4
1
Institute for Environmental Management Technology, National Institute of Advanced Industrial Science and Technology, 16-1 Onogawa, Tsukuba, Ibaraki 305-8569, Japan
2
Hydrocarbon Chemistry Research Group, Institute for Energy Utilization, National Institute of Advanced Industrial Science and Technology, 16-1 Onega, Tsukuba-shi, Ibaraki 305-8569, Japan
3
Institute for Chemical Process and Environmental Technology, National Research Council of Canada, Ottawa, Ontario, K1A 0R6, Canada
4
Technology Center, Pactiv Corporation, 2651 Brickyard Road, Canandaigua, New York 14424-7990
Received 10 February 2003; revised 20 May 2003; accepted 27 May 2003
ABSTRACT: Laser Raman spectroscopy, in conjunction with an optical high-pressure cell, was used to investigate the poly(methyl methacrylate)– carbon dioxide system. The Raman shifts associated with carbon dioxide molecules in the gas phase and those dissolved in the polymer were used to derive sorption kinetics of carbon dioxide and the carbon dioxide-induced phase changes in the polymer. Measurements were made in the temperature and pressure ranges in which this system is known to exhibit retrograde vitrification behavior. The Raman results on the sorption kinetics and on the onset of plasticization were in agreement with those obtained by gravimetric and calorimetric techniques, respectively. This technique provides a versatile and rapid way of charac-terizing polymer– gas systems and information that so far has been obtainable only through painstaking and time-consuming techniques. © 2003 Wiley Periodicals, Inc. J Polym Sci Part B: Polym Phys 41: 2214 –2217, 2003
Keywords: polymers; gas; sorption kinetics; phase transitions; phase behavior; Ra-man spectroscopy; thermoplastics
INTRODUCTION
The process for making microcellular foams with physical blowing agents is now well established,1by
which a polymer is saturated with a gas, such as carbon dioxide (CO2) or N2, and then either the
pressure is suddenly released at a temperature
slightly above the glass-transition temperature (Tg)
of the polymer– gas system or the pressure is re-leased slowly to the ambient pressure and the sys-tem is rapidly heated to a sys-temperature between Tg
and the softening point of the neat polymer. The thermodynamic instability thereby introduced brings about phase separation in the polymer– gas solution, causing the dissolved gas to nucleate, ex-pand, and escape the polymer matrix and leave behind a morphology with small, closed cells. Typi-cally, the cells are 1–100 m in diameter, and the cell density is 108to 1010cells cm⫺3.
Correspondence to: A. V. Nawaby (E-mail: victoria.
nawaby@nrc.ca)
Journal of Polymer Science: Part B: Polymer Physics, Vol. 41, 2214 –2217 (2003) © 2003 Wiley Periodicals, Inc.
The cell size and density depend on the amount of gas occluded in the polymer matrix and the processing conditions. It has been reported2,3that
foams with a cell size lower than 1 m and a cell density higher than 1012cells cm⫺3can be made
by the saturation of poly(methyl methacrylate) (PMMA) with CO2at ambient or slightly elevated
temperatures and at pressures of 13–30 MPa. These foams with submicrometer cellular mor-phologies are called ultramicrocellular foams. Re-cently, a new route to making ultramicrocellular foams has been found:4first, PMMA is saturated
with CO2 at 0 °C and 3.3 MPa, and then the
solution is heated to the foaming temperature. With this process, ultramicrocellular foams with 0.35-m cells, a cell density of 1014 cells cm⫺3,
and foam densities as low as 0.116 g cm⫺3 have
been produced.4
As noted previously, knowledge of the amount of gas dissolved in the polymer and the sorption kinetics and knowledge of the changes in Tgof the
polymer due to the dissolved gas, which, in turn, help to determine the appropriate foaming tem-perature, are central to producing foams with the desired morphology. Customarily, we have em-ployed gravimetric techniques to measure gas sol-ubility and sorption kinetics and thermal tech-niques to detect phase transitions in the polymer– gas systems.4,5These techniques are painstaking
and time-consuming but, nevertheless, have proven to be invaluable in delineating the retro-grade behavior that leads to the process for mak-ing ultramicrocellular foams under milder condi-tions of temperature and pressure. An experimen-tal technique that can provide comparable information, but is more versatile and rapid, is clearly desirable. In this article, we report the development of a laser Raman spectroscopic tech-nique for characterizing polymer– gas systems over extended ranges of temperature and pres-sure, and we apply it to the PMMA–CO2 system
to demonstrate its utility.
EXPERIMENTAL
The PMMA used had a Tg of 95 °C, a
weight-average molecular weight of 108,500, and a num-ber-average molecular weight of 56,700. PMMA sheets around 0.5 mm thick were obtained by compression molding. High-purity, bone-dry CO2
was used.
A schematic of the apparatus used to measure Raman shifts in polymer– gas systems is shown in
Figure 1. The cross-sectional view of an optical high-pressure cell, approximately 2 cm3 in
vol-ume, is shown. A 15-mm-thick glass window was installed in the center of the top side of the cell. The depth and the inner diameter of the cell were 10 and 16 mm, respectively. The temperature of the cell was controlled by a cooling unit, and the whole cell, except the glass window, was covered by insulation. The temperature was measured to ⫾0.1 °C with a thermocouple inserted into a ther-mowell in the side wall. The polymer sample, typically 5 mm in diameter and 0.5 mm thick, was set at the center of the cell. Compressed CO2was
introduced into the cell to the desired pressure and allowed to equilibrate with the polymer sam-ple. The pressure was measured to ⫾0.01 MPa.
The dissolution of CO2 in the polymer sample
was followed by in situ Raman spectroscopy with a laser Raman microprobe spectrometer (Jobin Yvon Ramanor T64000). The incident laser beam was irradiated onto the sample through the object lens and the glass window. The light source was an argon-ion laser, the wavelength and power of which were 514.5 nm and 100 mW, respectively. The laser beam was condensed to a 1 m in spot diameter using its microscopic system. During the measurements of the Raman shifts, the Ra-man beam was focused at about 0.15 mm from the upper surface of the sample. The integration time for each measurement was 10 s, and the average of six measurements was stored as the spectrum. The Raman shift in the PMMA–CO2system at 0
°C was measured at pressures of 2.4, 3.0, and 3.3 Figure 1. Cross-sectional view of the high-pressure optical cell used for Raman laser scattering.
MPa. A fresh sample was used for each pressure study.
RESULTS AND DISCUSSION
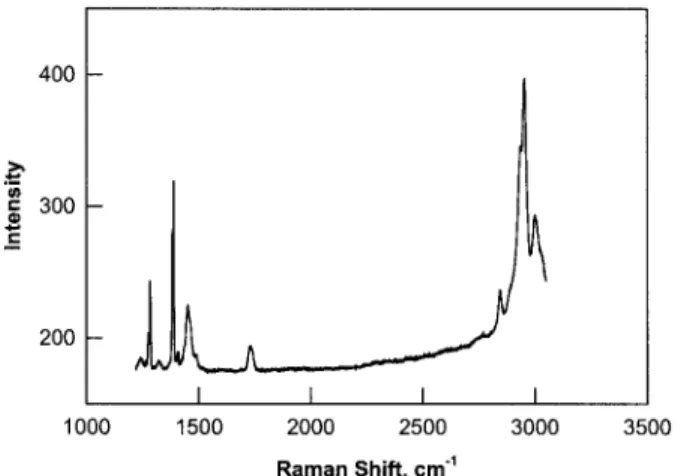
A typical Fourier transform Raman spectrum of the PMMA–CO2 system at 3.0 MPa of CO2
pres-sure and 0 °C is shown in Figure 2. The spectrum contains peaks due to CO2 in the gas phase and
CO2dissolved in PMMA and due to PMMA itself.
Several characteristic peaks of PMMA can be ob-served at 1454 and 1734 and between 2840 and 3010 cm⫺1.
Peaks due to CO2molecules occurring between
1250 and 1450 cm⫺1are shown in detail in Figure
3. The relatively larger peaks at 1287 and 1390 cm⫺1are attributed to the gaseous CO
2in the cell.
Two smaller peaks at 1279 and 1385 cm⫺1 are
attributed to the CO2 molecules dissolved in
PMMA. This shift to lower frequencies with re-spect to the free gas phase has been observed in other systems when the molecules are transferred from the gaseous state, where all modes are acti-vated to a confined state in which translational and rotational modes are restricted and the bar-rier to vibrational and stretching modes is af-fected as well. For example, the occlusion of CO2
molecules in clathrate hydrates shifts6 the
Ra-man signature at 1287 to 1277 cm⫺1and the one
at 1390 to 1380 cm⫺1. The broadening of the
Ra-man bands for dissolved CO2, as noted in Figure
3, was also observed for occluded CO2.6
The evolution of the Raman peaks due to dis-solved and gaseous CO2at 1279 and 1287 cm⫺1,
respectively, with time is shown in Figure 4, in which peaks due to dissolved CO2with increasing
intensity correspond to increasing equilibration time. The intensities (taken as the peak height at its maximum) of the dissolved peak are plotted after normalization with respect to the corsponding intensities for gaseous peaks. The re-sults clearly show that the Raman analysis can be used to follow the approach to phase equilibrium in polymer– gas systems.
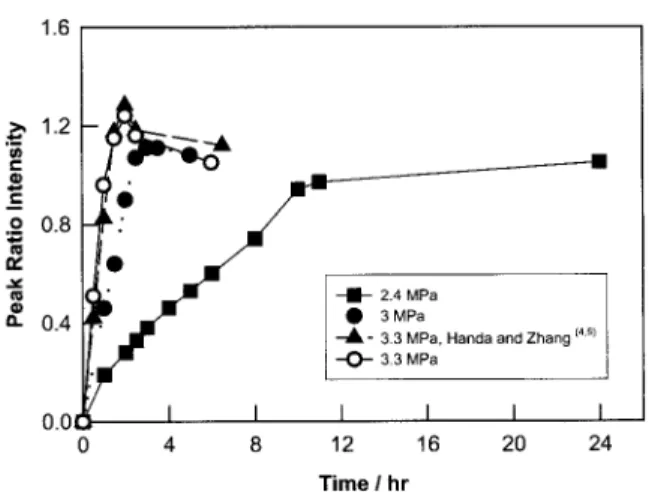
Figure 5 shows the ratio of the intensities of the peaks at 1279 and 1287 cm⫺1due to dissolved
and gaseous CO2, respectively, plotted against
time. The results are shown for various gas pres-sures, and these plots essentially reflect the ki-netics of sorption of CO2 in PMMA. As expected,
the kinetics become faster as the pressure is in-creased at a given temperature. Also shown in Figure 5 are the sorption kinetic results at 3.3 Figure 2. Raman spectrum for the PMMA–CO2
sys-tem at 3.0 MPa and 0 °C.
Figure 3. Raman shift due to gaseous CO2and CO2 dissolved in PMMA at 3.0 MPa and 0 °C.
Figure 4. Time dependence of the growth in the peak intensity of the Raman peak due to dissolved CO2.
MPa reported previously from gravimetric mea-surements.4
The kinetic data from this investigation were converted into the dimensionless scale for the y axis by dividing the amount absorbed at different times by the equilibrium solubility. The timescale for the data in ref. 4, which refers to a sample 1.25 mm thick, was converted into the timescale of this investigation by multiplication with a factor that is the ratio of the square of the thickness of this sample to the square of the thickness of the sam-ple used in ref. 4. The agreement between the two sets of results is remarkably good. On the basis of this comparison, the kinetic profiles observed in the Raman results can be attributed to the exis-tence of the glassy state at 0 °C and 2.4 MPa and to the existence of the rubbery state at 0 °C and 3.3 MPa, the latter assignment being based on the retrograde vitrification measurements reported previously.4,5
The retrograde vitrification phenomenon in PMMA–CO2and other systems
4,5,7
has been stud-ied extensively. According to this phenomenon, a polymer– gas system can have multiple Tg’s for a
given gas pressure.8 For example, PMMA exists in the rubbery state when equilibrated with CO2
at 0 °C and 3.3 MPa. When this system is heated under a constant gas pressure, it undergoes a rubber– glass transition (hence the term
retro-grade) at 5 °C, and on continued heating, it
un-dergoes a glass–rubber transition at 72 °C. There-fore, the rubbery state exists at temperatures be-low 5 °C and above 72 °C, and the glassy state exists at temperatures between them.
Accord-ingly, in this study, the sample existed in the rubbery state at 3.3 MPa and in the glassy state at 2.4 MPa under the saturation conditions with CO2 at each gas pressure and 0 °C. This is
re-flected in the results shown in Figure 5. At 2.4 MPa, the peak intensity ratio increases with time and then eventually attains an equilibrium value. However, at 3.0 and 3.3 MPa, the peak intensity ratio reaches a maximum value followed by a small but measurable drop. This occurs because at the constant gas pressure, the glassy state has higher free volume than the corresponding rub-bery state. The polymer continues to dissolve more and more CO2with time until it undergoes
transformation into the rubbery state when some of the dissolved CO2is expelled from the solution
because of a loss of free volume.
The embryonic nucleation determines the eventual morphology attained in a foaming pro-cess. The emergence of an incipient bubble occurs when, under a certain driving force, the concen-tration fluctuations of dissolved gas lead to the formation of aggregates of embryos larger than the critical radius required for homogeneous nu-cleation. In polymers, the rubbery state permits gas molecules to undergo such concentration fluc-tuations. Consequently, the sorption kinetic mea-surement method, along with the detection of the accompanying phase change reported here, pro-vides a valuable tool for understanding the foam-ing process in polymers. Its applications to the determination of gas solubilities, phase changes, bubble nucleation, and growth and the imaging of the resulting morphology will be reported in forthcoming articles.
REFERENCES AND NOTES 1. Moore, S. Mod Plast 2001, Nov, 23.
2. Goel, S. K.; Beckman, E. J. Polym Eng Sci 1994, 34, 1137.
3. Baldwin, D. F.; Suh, N. P.; Park, C. B.; Cha, S. W. U.S. Patent 5,334,356, 1994.
4. Handa, Y. P.; Zhang, Z. J Polym Sci Part B: Polym Phys 2000, 38, 716.
5. Handa, Y. P.; Zhang, Z.; Wong, B. Cell Polym 2001, 20, 1.
6. Sum, A. K.; Burruss, R. C.; Sloan, E. D. J Phys Chem 1997, 101, 7371.
7. Handa, Y. P.; Zhang, Z. U.S. Patent 5,955,511, 1999. 8. Condo, P. D.; Sanchez, I. C.; Panayiotou, C. G.;
Johnston, K. P. Macromolecules 1992, 25, 6119.
Figure 5. Ratio of the intensities of the peaks at 1385 and 1390 cm⫺1due to dissolved and gaseous CO
2, re-spectively, at various times and pressures.