Chromosome VI
Million bp
0
2
4
6
8
10
12
14
16
18
20
22
24
26
0.0
2.5
5.0
-2.5
-5.0
fixed/variable SNPs
FST
SNP density
fraction of repetitive elements
fixed/variable SNPs
GC ratio
SNP coverage
a)
0
0.25
0.5
1.0
0.75
Million bp
0
2
4
6
8
10
12
14
16
18
20
22
24
26
0.0
2.5
5.0
-2.5
-5.0
Million bp
0
2
4
6
8
10
12
14
16
fraction of repetitive elements
fixed/variable SNPs
GC ratio
SNP coverage
Chromosome XIX
b)
0
0.25
0.5
1.0
0.75
Million bp
0
2
4
6
8
10
12
14
16
fixed/variable SNPs
FST
SNP density
0 2 4 6 8 10 12 14 16 18 20 22 24 26 28 30 32 34 36 38 40 42 44 46 48 0 0.2 0.4 0.6 0.8 1 ORP M 3 0_ 1 ORP M 1 37 GCP M 1 24 A S P 1 12 37 6 P M G C 2 85 2 A S P 1 13 30 2 GCP M 1 71 9
Million bp
Chr I
0 2 4 6 8 10 12 14 16 18 20 22 0 0.2 0.4 0.6 0.8 1Million bp
Chr II
0 2 4 6 8 10 12 14 16 18 20 0 0.2 0.4 0.6 0.8 1 GCP M 1 13 3 ORP M 3 0_ 2 GCP M 1 62 9 ORP M 2 03 GCP M 1 86 9 GCP M 1 68 8Million bp
Chr III
0 2 4 6 8 10 12 14 16 18 20 22 0 0.2 0.4 0.6 0.8 1Million bp
Chr IV
0 2 4 6 8 10 12 14 16 18 20 22 24 26 0 0.2 0.4 0.6 0.8 1 GCP M 1 39 GCP M 1 83 1 GCP M 1 07 4 ORP M 2 6 ORP M 1 67 A S P 1 06 93 3 ORP M 1 90 WPM S 12 GCP M 2 03 4 ORP M 3 69 ORP M 6 0 GCP M 1 06 5 A S P 1 12 32 2Million bp
Chr VI
0 2 4 6 8 10 12 14 0 0.2 0.4 0.6 0.8 1Million bp
Chr VII
0 2 4 6 8 10 12 14 16 18 20 22 24 0 0.2 0.4 0.6 0.8 1Million bp
Chr V
Million bp
0 2 4 6 8 10 12 14 16 18 0 0.2 0.4 0.6 0.8 1Chr VIII
0 2 4 6 8 10 12 0 0.2 0.4 0.6 0.8 1Chr IX
Million bp
0 2 4 6 8 10 12 14 0 0.2 0.4 0.6 0.8 1
Chr XII
Million bp
0 2 4 6 8 10 12 14 0 0.2 0.4 0.6 0.8 1Chr XIII
Million bp
0 2 4 6 8 10 12 14 16 0 0.2 0.4 0.6 0.8 1Chr XIV
Million bp
0 2 4 6 8 10 12 14 0 0.2 0.4 0.6 0.8 1Million bp
Chr XV
0 2 4 6 8 10 12 14 0 0.2 0.4 0.6 0.8 1Million bp
Chr XVI
0 2 4 6 8 10 12 14 0 0.2 0.4 0.6 0.8 1Million bp
Chr XVII
0 2 4 6 8 10 12 14 0 0.2 0.4 0.6 0.8 1Million bp
Chr XVIII
0 2 4 6 8 10 12 14 16 0 0.2 0.4 0.6 0.8 1 Y in 2 ORP M 2 76 Co n 49 .1 Co n 58 .1 Co n 7.1 ORP M 2 06Million bp
Chr XIX
0 2 4 6 8 10 12 14 16 18 20 0 0.2 0.4 0.6 0.8 1Chr X
Million bp
0 2 4 6 8 10 12 14 16 18 0 0.2 0.4 0.6 0.8 1Chr XI
Million bp
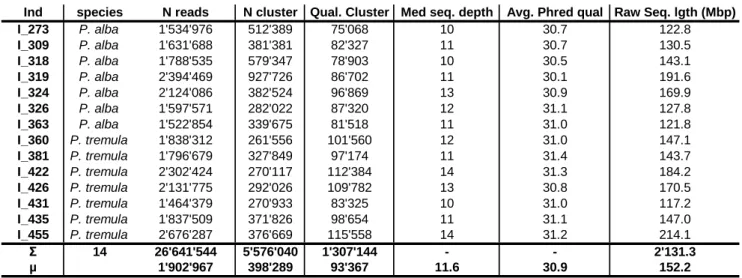
Table S1 RAD sequencing results
Ind
species
N reads
N cluster
Qual. Cluster Med seq. depth
Avg. Phred qual Raw Seq. lgth (Mbp)
I_273
P. alba
1'534'976
512'389
75'068
10
30.7
122.8
I_309
P. alba
1'631'688
381'381
82'327
11
30.7
130.5
I_318
P. alba
1'788'535
579'347
78'903
10
30.5
143.1
I_319
P. alba
2'394'469
927'726
86'702
11
30.1
191.6
I_324
P. alba
2'124'086
382'524
96'869
13
30.9
169.9
I_326
P. alba
1'597'571
282'022
87'320
12
31.1
127.8
I_363
P. alba
1'522'854
339'675
81'518
11
31.0
121.8
I_360
P. tremula
1'838'312
261'556
101'560
12
31.0
147.1
I_381
P. tremula
1'796'679
327'849
97'174
11
31.4
143.7
I_422
P. tremula
2'302'424
270'117
112'384
14
31.3
184.2
I_426
P. tremula
2'131'775
292'026
109'782
13
30.8
170.5
I_431
P. tremula
1'464'379
270'933
83'325
10
31.0
117.2
I_435
P. tremula
1'837'509
371'826
98'654
11
31.1
147.0
I_455
P. tremula
2'676'287
376'669
115'558
14
31.2
214.1
Σ
14
26'641'544
5'576'040
1'307'144
-
-
2'131.3
µ
1'902'967
398'289
93'367
11.6
30.9
152.2
RAD sequencing results for 14 samples of Populus alba and P. tremula. Samples included in RAD sequencing ("Ind" column)
have also been typed at 32 microsatellite loci. For each individual, the species ("species") is indicated, as are the number of
Illumina sequencing reads ("N reads"), the number of unique sequence clusters ("N cluster"), the number of sequence clusters
passing quality tests ("Qual. Cluster") and the median sequencing depth of each quality cluster ("Med. seq. depth"). We also
indicate the average phred-quality of sequencing reads ("Avg. Phred qual.") and the total length of raw data per individual in
million base pairs ("Raw Seq. lgth (Mbp)"). Where appropriate, sums and averages are indicated.
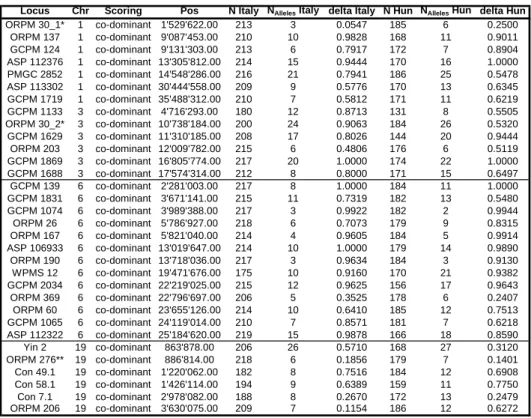
Table S2 - Microsatellite markers
Locus Chr Scoring Pos N Italy NAlleles Italy delta Italy N Hun NAlleles Hun delta Hun
ORPM 30_1* 1 co-dominant 1'529'622.00 213 3 0.0547 185 6 0.2500 ORPM 137 1 co-dominant 9'087'453.00 210 10 0.9828 168 11 0.9011 GCPM 124 1 co-dominant 9'131'303.00 213 6 0.7917 172 7 0.8904 ASP 112376 1 co-dominant 13'305'812.00 214 15 0.9444 170 16 1.0000 PMGC 2852 1 co-dominant 14'548'286.00 216 21 0.7941 186 25 0.5478 ASP 113302 1 co-dominant 30'444'558.00 209 9 0.5776 170 13 0.6345 GCPM 1719 1 co-dominant 35'488'312.00 210 7 0.5812 171 11 0.6219 GCPM 1133 3 co-dominant 4'716'293.00 180 12 0.8713 131 8 0.5505 ORPM 30_2* 3 co-dominant 10'738'184.00 200 24 0.9063 184 26 0.5320 GCPM 1629 3 co-dominant 11'310'185.00 208 17 0.8026 144 20 0.9444 ORPM 203 3 co-dominant 12'009'782.00 215 6 0.4806 176 6 0.5119 GCPM 1869 3 co-dominant 16'805'774.00 217 20 1.0000 174 22 1.0000 GCPM 1688 3 co-dominant 17'574'314.00 212 8 0.8000 171 15 0.6497 GCPM 139 6 co-dominant 2'281'003.00 217 8 1.0000 184 11 1.0000 GCPM 1831 6 co-dominant 3'671'141.00 215 11 0.7319 182 13 0.5480 GCPM 1074 6 co-dominant 3'989'388.00 217 3 0.9922 182 2 0.9944 ORPM 26 6 co-dominant 5'786'927.00 218 6 0.7073 179 9 0.8315 ORPM 167 6 co-dominant 5'821'040.00 214 4 0.9605 184 5 0.9914 ASP 106933 6 co-dominant 13'019'647.00 214 10 1.0000 179 14 0.9890 ORPM 190 6 co-dominant 13'718'036.00 217 3 0.9634 184 3 0.9130 WPMS 12 6 co-dominant 19'471'676.00 175 10 0.9160 170 21 0.9382 GCPM 2034 6 co-dominant 22'219'025.00 215 12 0.9625 156 17 0.9643 ORPM 369 6 co-dominant 22'796'697.00 206 5 0.3525 178 6 0.2407 ORPM 60 6 co-dominant 23'655'126.00 214 10 0.6410 185 12 0.7513 GCPM 1065 6 co-dominant 24'119'014.00 210 7 0.8571 181 7 0.6218 ASP 112322 6 co-dominant 25'184'620.00 219 15 0.9878 166 18 0.8590 Yin 2 19 co-dominant 863'878.00 206 26 0.5710 168 27 0.3120 ORPM 276** 19 co-dominant 886'814.00 218 6 0.1856 179 7 0.1401 Con 49.1 19 co-dominant 1'220'062.00 182 8 0.7516 184 12 0.6908 Con 58.1 19 co-dominant 1'426'114.00 194 9 0.6389 159 11 0.7750 Con 7.1 19 co-dominant 2'978'082.00 188 8 0.2670 172 13 0.2479 ORPM 206 19 co-dominant 3'630'075.00 209 7 0.1154 186 12 0.6272
All primer combinations have been localized by blast-n searches against version 2 (build 156) of the Populus trichocarpa genome * Primer combination ORPM 30 amplifies two separate loci in the genome, clearly distinct in allele sizes and chromosomal location. The two loci are denoted ORPM 30_1 and ORPM 30_2
** BLAST searches against Populus trichocarpa Version 2 (build 156) have identified a duplication of this locus.
Here, we follow the notation of Macaya-Sanz et al 2011. A duplicate element is also located on chromosome 19, at position 2850207
Thirty-two microsatellite loci ("Locus") with detailed information on genomic location of each marker ("Chr" = chromosome; "Pos" = location of the locus in base pairs on the chromsome). For each locus, the number of individuals scored is indicated for the Italian ("N Italy") and the Hungarian ("N Hun") hybrid zones along with information on the number of different alleles observed in each locality ("NAlleles Italy", "NAlleles Hun"). Allele frequency differentials between species are