HAL Id: tel-03058542
https://hal-amu.archives-ouvertes.fr/tel-03058542
Submitted on 11 Dec 2020
HAL is a multi-disciplinary open access
archive for the deposit and dissemination of sci-entific research documents, whether they are pub-lished or not. The documents may come from teaching and research institutions in France or abroad, or from public or private research centers.
L’archive ouverte pluridisciplinaire HAL, est destinée au dépôt et à la diffusion de documents scientifiques de niveau recherche, publiés ou non, émanant des établissements d’enseignement et de recherche français ou étrangers, des laboratoires publics ou privés.
Pedestrian and Cyclist Forward Collision Warning
System Effectiveness Estimation based on Simulation of
Kinematic Reconstructions
François Char
To cite this version:
François Char. Pedestrian and Cyclist Forward Collision Warning System Effectiveness Estimation based on Simulation of Kinematic Reconstructions. Engineering Sciences [physics]. AMU - Aix Mar-seille Université, 2020. English. �tel-03058542�
1
UNIVERSITE D’AIX-MARSEILLE
ED 463- Sciences du Mouvement Humain
Université Gustave Eiffel, LMA
Toyota Motor Europe
Thèse présentée pour obtenir le grade universitaire de docteur
Discipline : Sciences du Mouvement Humain
François CHAR
Estimation des bénéfices apportés en sécurité routière par
des avertisseurs de collision frontale pour des piétons et des
cyclistes et sensibilité de ces systèmes
Pedestrian and Cyclist Forward Collision Warning System
Effectiveness Estimation based on Simulation of Kinematic
Reconstructions
Soutenue le 18/12/2020 devant le jury :
Pierre-Jean ARNOUX Examinator Université Gustave Eiffel/TS2/LBA Sabine COMPIGNE Examinator Toyota Motor Europe
Nils LUBBE Reviewer Chalmers University of Technology (Suède) Dominique GRUYER Reviewer Université Gustave Eiffel/COSYS/PICS-L Thierry SERRE Supervisor Université Gustave Eiffel/TS2/LMA
3
Abstract in French
En 2016, le nombre de morts sur la route atteignait les 1,35 millions dans le monde selon l’Organisation Mondiale de la Santé. 26% de ces morts étaient des piétons et des cyclistes. De nos jours, de plus en plus de véhicules sont équipés de systèmes de d’urgence automatique (appelés FCW - avertisseur de collision frontale) qui peuvent détecter les piétons et les cyclistes et prévenir les conducteurs d’une situation dangereuse. Ces systèmes peuvent aussi participer à l’évitement de collision soit en assistant le conducteur durant le freinage ou en activant un freinage d’urgence automatique (AEB). Cette thèse se concentre sur l’évaluation d’un AEB et d’un FCW piéton et cycliste et a trois objectifs.
Dans un premier temps, plus de 3700 reconstructions d’accidents (2200 cas cyclistes et 1500 cas piétons) ont été analysées provenant de deux bases de données, l’une française et l’autre allemande. Des configurations d’accidents ont été extraites et les cas d’accidents ont été classés en différents scénarios. Un logiciel permettant d’effectuer des simulations a été implémenté de manière à pouvoir rejouer la cinématique des accidents tout en intégrant un AEB avec des caractéristiques adaptables. Cela a permis l’identification des caractéristiques optimums d’un AEB piéton et cycliste en termes de détection d’usager vulnérable de la route mais également du temps de déclenchement d’un FCW et la durée des freinages d’urgences.
Dans un second temps, en se basant sur une expérimentation sur simulateur de conduite, les réactions de conducteurs vis-à-vis du signal d’un FCW ont été analysées dans différentes configurations d’accidents : cas piéton/cycliste, avec ou sans FCW ou encore avec différents timing de déclenchement du FCW. Deux cents participants ont pris part à cette étude sur simulateur. Les résultats expérimentaux extraits concernent l’analyse du regard, la réponse du conducteur au signal du FCW, le temps de réaction pour déclencher un freinage ou encore le comportement en fonction de l’environnement de conduite.
Le troisième objectif concerne l’évaluation des bénéfices du FCW. A partir des résultats de l’étude sur simulateur et des reconstructions cinématiques des cas d’accidents, l’estimation des effets du FCW a été réalisée en termes d’accidents évités ou atténués.
4
Abstract
In 2016, road fatalities reached 1.35 million in the world according to the World Health Organization. 26% of these fatalities were pedestrians and cyclists. Nowadays, more and more cars are equipped with an emergency system (called FCW – Forward Collision Warning) that can detect pedestrians and cyclists in order to warn drivers of a hazardous situation. These systems can also help in collision avoidance either by assisting driver during braking or by activating an Automatic Emergency Braking (AEB). This thesis is focused on Pedestrian and Cyclist AEB and FCW assessment and has three main objectives.
First, an analysis on more than 3700 accident case reconstructions (2200 cyclist cases and 1500 pedestrian cases) from two databases, one French and one German has been performed. Accident configurations have been extracted and classified into different scenarios. A simulation software has been implemented in order to replay the accident kinematics with the integration of an AEB by varying their system characteristics. This allows the identification of optimum characteristics for a pedestrian AEB and cyclist AEB in terms of road user detection. It also allows identifying FCW trigger time and the duration of an emergency braking.
Secondly, based on an experimental campaign using a driving simulator, the driver’s reactions to a FCW signal have been analyzed on different accident configurations: pedestrian/cyclist cases, with/without FCW and with different FCW triggers. Two hundred volunteers participated in this experiment. The results concern the gaze analysis, the driver’s response to the FCW signal, the time reaction to trigger a braking and the different behavior depending on the driving configurations.
The third objective concerns the benefits assessment of a FCW. Based on the results of the driving simulator experiment and the kinematic reconstructions of the accidents, benefits of a FCW are estimated in terms of potential avoided or mitigated accidents.
Finally, some perspectives of this work are proposed.
Keywords: Forward Collision Warning, Automatic Emergency Braking, Pedestrian, Cyclist, Accident reconstruction, Driving simulator
5
Acknowledgement
I would like to thank everyone who contributed and helped me during this work: Toyota for funding this research, and all Toyota team members encountered in Belgium and in Japan for their expertise.
Nils Lubbe and Dominique Gruyer for agreeing to be reviewer of this work. Pierre Jean Arnoux for agreeing to be the president of the jury.
Thierry Serre, my supervisor at Université Gustave Eiffel-LMA for giving me this opportunity, for his expertise, his patience and always being available for my 1 hour little question.
Sabine Compigne, Technical Manager at Toyota Motor Europe for her expertise, her help in the paper writings and her patience.
Pablo Puente Guillen, former researcher at Toyota Motor Europe for his expertise in human factors,
Stéphane and Isabelle Aillerie, Technician and Researcher at Université Gustave Eiffel for their work and assistance during the driving simulator campaign.
Adrien and Bastien Canu, Aurélie Banet, Céline Parraud, Joël Magnin, members of the EDA investigation team of Université Gustave Eiffel -LMA for sharing their knowledge in in-depth crash investigation.
Thierry Brenac and Jean-Yves Fournier, Researcher and Engineer at Université Gustave Eiffel -LMA for their expertise in statistics.
Christophe Perrin, Nicolas Clabaux, Researcher at Université Gustave Eiffel -LMA for sharing their expertise.
Christine Panadour, Anne-Laure Paglia for their help in all administrative tasks. Romane Cornen for surviving in the same office I was.
6
All the colleagues of Université Gustave Eiffel -LMA and people met during this work for their support.
7
Contents
Abstract in French 3 Abstract 4 Acknowledgement 5 Contents 7 Figures 10 Table 16 Preface 19 1. Introduction 201.1 Pedestrian and Cyclist accidentology 20
1.1.1 General context 20
1.1.2 Accident scenarios 20
1.1.3 Risk factors 23
1.2 Pedestrian and Cyclist safety 26
1.2.1 General concepts 26
1.2.2 Passive safety 27
1.2.3 Active safety 28
1.3 AEB and FCW system 29
1.3.1 Functioning 29
1.3.2 Driver’s reaction 31 1.3.3 Benefits of AEB and FCW 32 1.3.4 Assessment protocols 34
1.4 Research questions 35
1.4.1 Aim and objectives 35
1.4.2 Thesis outline 37
2. Accident analysis and challenges for AEB 39
2.1 Database description 39 2.1.1 In-depth accident investigations 39 2.1.2 Université Gustave Eiffel/LMA EDA 40
2.1.3 GIDAS-PCM 40
2.1.4 Data sample 41
2.1.5 Accident kinematic reconstruction 41
2.2 Tools development 42
2.3 Analyzed parameters 44
2.3.1 Accident scenario 45 2.3.2 AEB characteristics 50
8
2.3.3 Visibility 51
2.4 Analysis / Challenges / Issues 53 2.4.1 VRU relative position to the car, driver brake activation, vehicle approach speed
and accident clustering 53
2.4.2 Field Of View (FOV) 71
2.4.3 Range 80
2.4.4 LTTB and tLTTB 86
2.4.5 Visibility duration before the tLTTB (tvisible-tLTTB) 98
2.5. Conclusion 105
3. Drivers’ response to a FCW 108
3.1 Objectives of the driving simulator campaign 108
3.2 Driving simulator 111
3.2.1 General description 111
3.2.3 Video recording 113
3.2.4 Additional elements 114 3.3 Scenario description 116 3.3.1 Which scenario to reproduce and how? 116 3.3.2 Familiarization scenario 119 3.3.3 Pedestrian Longitudinal (P-L) 120 3.3.4 Cyclist Longitudinal (C-L) 121 3.3.5 Turning Left and Pedestrian Left (TL-PL) 123 3.3.6 Turning Left and Pedestrian Right (TL-PR) 124 3.3.7 Turning Right and Pedestrian Right (TR-PR) 124 3.3.8 Turning Left and Cyclist Right (TL-CR) 125
3.4 Secondary tasks 126
3.4.1 Secondary visual-cognitive task 127 3.4.2 Audio-cognitive task 128
3.5 FCW signal 130
3.6 Data collection 131
3.6.1 Driving simulator file 131 3.6.2 Driving simulator video files 133 3.6.3 Facelab eye tracker result files 133
3.6.4 Audio record 135
3.6.5 Questionnaires and interviews 135 3.7 Experimental management 136 3.7.1 Ethical approval 136
3.7.2 Protocol 136
3.7.3 Participant sample and data matrix 137
3.8 Results 139
9
3.8.2 Cyclist Longitudinal (C-L) 143 3.8.3 Turning Left Pedestrian Left (TL-PL) 147 3.8.4 Turning Left Pedestrian Right (TL-PR) 149 3.8.5 Turning Right Pedestrian Right (TR-PR) 151 3.8.6 Turning Left Cyclist Right (TL-CR) 153 3.8.7 Participants’ feedback on FCW 154 3.8.8 Main experiment conclusion 156 3.9 Additional experiment 158 3.9.1 New experimental protocol 158
3.9.2 Results 160
3.9.3 Feedbacks on FCW 166 3.9.4 Additional experiment conclusion 167
3.10 Global conclusion 168
4. Benefits evaluation for FCW 172
4.1 Methodology 172
4.1.1 Accident simulation method integrating FCW effects 172 4.1.2 Parametric analysis 176 4.1.3 Factor influences on avoidance rates 178 4.2 Accident simulations 178 4.2.1 Pedestrian accident cases 179 4.2.2 Cyclist accident cases 191 4.2.3 Comparison between Pedestrian and Cyclist cases 202
4.3 Conclusion 204
5. Global conclusion and perspectives 209
5.1 Synthesis and limitations 209
5.2 Perspectives 211
Bibliography 214
Appendix 225
A. Driving simulator preliminary test 226 B. Main experiment questionnaire 259
C. Ethical approval 263
D. Driving simulator main experiment results 275 E. Parametric simulation table per scenario 290
10
Figures
Figure 1: Fatalities curves evolution for pedestrians and cyclists in Europe. (European
Commission 2019b) ... 20
Figure 2: Main accident scenarios identified by Op den Camp et al. (2016) ... Error! Bookmark not defined. Figure 3: Pedestrian risk of death in function of the impact speed in the United States (Tefft et al. 2013) ... 24
Figure 4: Fatalities risk for pedestrians and cyclist in China (Nie et al. 2015) ... 25
Figure 5: Fatality risk as a function of impact speed in Germany (Rosén and Sander 2009) ... 25
Figure 6: Pedestrian fatality risk by impact speed (Hussain et al. 2019) ... 26
Figure 7: Sequences prior the impact with possible action during the different sequences ... 27
Figure 8: Pedestrian protection test methods proposed by EEVC WG10 (European Enhanced Vehicle-Safety Committee 1998) ... 28
Figure 9: Example of pedestrian crash on a vehicle from Masson et al. (2007) ... 28
Figure 10: Illustration of the FOV and range (Meinecke et al. 2005) ... 30
Figure 11: Accident kinematic reconstruction method ... 42
Figure 12: Global software development ... 43
Figure 13: Inputs and outputs of the different software modules ... 44
Figure 14 : Illustration of UTYP coding for two different cases ... 46
Figure 15: Chosen scenarios for accident classification, from left to right: turning left; turning right; crossing nearside; crossing farside and longitudinal ... 47
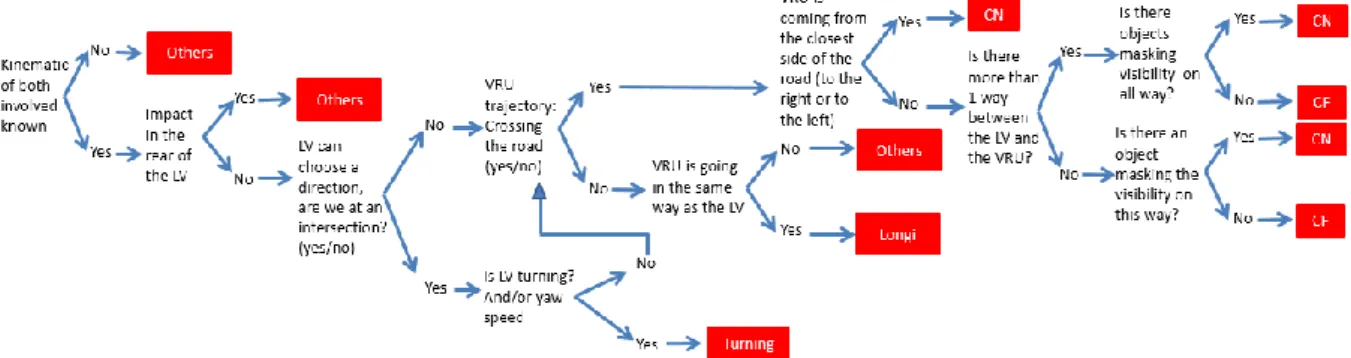
Figure 16: Decision tree used to classify accident into one of the five accident scenarios or in the “Others” group ... 48
Figure 17: Illustration of accident cases that are difficult to classify. The accident classification results for those three cases are (from left to right): crossing nearside; longitudinal; turning right)... 50
Figure 18: FOV and range sensors modeling ... 51
Figure 19: Calculus method of the duration tvisible-tLTTB intwo configurations: without occlusion on the left (Figure 19a) and with on the right (Figure 19b). ... 52
Figure 20: Pedestrians’ positions relative to the vehicle 2s, 1.5s, 1s and 0.5s before the impact for all accidents of our sample (N = 1509) ... 53
Figure 21: (Left) Cumulative frequency of brake activation timing (51% of all cases) and vehicle approach speed (Right), N = 1509 ... 54
Figure 22: Pedestrians’ positions relative to the vehicle 2s, 1.5s, 1s and 0.5s before the impact for all P-CN accidents (N = 788)... 55
11
Figure 23: Drivers’ braking timing for the P-CN scenario, 50% braking activation among 788 P-CN accident cases ... 55
Figure 24: Pedestrians’ positions relative to the vehicle 2s, 1.5s, 1s and 0.5s before the impact for all P-CF accidents (N = 461) ... 56
Figure 25: Drivers’ braking timing for the P-CF scenario, 61% braking activation among 461 P-CF accident cases ... 57
Figure 26: Pedestrians’ positions relative to the vehicle 2s, 1.5s, 1s and 0.5s before the impact for all P-L accidents (N = 20)... 58
Figure 27: Drivers’ braking timing for the P-L scenario, 20% braking activation among 20 P-CF accident cases ... 58
Figure 28: Pedestrians’ positions relative to the vehicle 2s, 1.5s, 1s and 0.5s before the impact for all P-TL accidents (N = 124) ... 59
Figure 29: Drivers’ braking timing for the P-TL scenario, 39% braking activation among 124 P-TL accident cases ... 59
Figure 30: Pedestrians’ positions relative to the vehicle 2s, 1.5s, 1s and 0.5s before the impact for all P-TR accidents (N = 55) ... 60
Figure 31: Drivers’ braking timing for the P-TR scenario, 24% braking activation among 55 P-TR accident cases ... 61
Figure 32: Cyclists’ positions relative to the vehicle 2s, 1.5s, 1s and 0.5s before the impact for all accident of our sample (N = 2261) ... 62
Figure 33: (Left) Cumulative frequency of brake activation timing (33% of all cases) and vehicle approach speed (Right), N = 2261 ... 62
Figure 34: Cyclists’ positions relative to the vehicle 2s, 1.5s, 1s and 0.5s before the impact for all C-CN accidents (N = 744)... 64
Figure 35: Drivers’ braking timing for the C-CN scenario, 29% braking activation among 744 C-CN accident cases ... 64
Figure 36: Cyclists’ positions relative to the vehicle 2s, 1.5s, 1s and 0.5s before the impact for all C-CF accidents (N = 504) ... 65
Figure 37: Drivers’ braking timing for the C-CF scenario, 38% braking activation among 504 C-CF accident cases ... 65
Figure 38: Cyclists’ positions relative to the vehicle 2s, 1.5s, 1s and 0.5s before the impact for all C-L accidents (N = 120) ... 66
Figure 39: Drivers’ braking timing for the C-L scenario, 33% braking activation among 120 C-L accident cases ... 66
Figure 40: Cyclists’ positions relative to the vehicle 2s, 1.5s, 1s and 0.5s before the impact for all C-TL accidents (N = 280) ... 67
Figure 41: Drivers’ braking timing for the C-TL scenario, 35% braking activation among 280 C-TL accident cases ... 68
Figure 42: Cyclists’ positions relative to the vehicle 2s, 1.5s, 1s and 0.5s before the impact for all C-TR accidents (N = 492) ... 69
Figure 43: Drivers’ braking timing for the C-TR scenario, 32% braking activation among 492 C-TR accident cases ... 69
12
Figure 44: Rates of visible pedestrian for different FOV for all pedestrian accident cases,
N = 1509 ... 71
Figure 45: Rates of visible pedestrian for different FOV for P-CN accident cases, N = 788 ... 72
Figure 46: Rates of visible pedestrian for different FOV for P-CF accident cases, N = 461 ... 73
Figure 47: Rates of visible pedestrian for different FOV for P-L accident cases, N = 20 ... 73
Figure 48: Rates of visible pedestrian for different FOV for P-TL accident cases, N = 124 ... 74
Figure 49: Rates of visible pedestrian for different FOV for P-TR accident cases, N = 55 ... 75
Figure 50: Rates of visible cyclists for different FOV for all Cyclist accident cases, N = 2261 ... 76
Figure 51: Rates of visible cyclists for different FOV for C-CN accident cases, N = 744 ... 76
Figure 52: Rates of visible cyclists for different FOV for C-CF accident cases, N = 504 ... 77
Figure 53: Rates of visible cyclists for different FOV for C-L accident cases, N = 120 . 77 Figure 54: Rates of visible cyclists for different FOV for C-TL accident cases, N = 279 ... 78
Figure 55: Rates of visible cyclists for different FOV for T-CR accident cases, N = 492 ... 78
Figure 56: Range detection rates for all pedestrian cases, N = 1509 ... 81
Figure 57: Range detection rates for pedestrian crossing nearside scenario, N = 788 81 Figure 58: Range detection rates for pedestrian crossing farside scenario, N = 461 ... 82
Figure 59: Range detection rates for pedestrian longitudinal scenario, N = 20 ... 82
Figure 60: Range detection rates for pedestrian turning left scenario, N = 124 ... 82
Figure 61: Range detection rates for pedestrian turning right scenario, N = 55 ... 83
Figure 62: Range detection rates for all cyclist cases, N = 2261 ... 83
Figure 63: Range detection rates for cyclist crossing nearside scenario, N = 744 ... 84
Figure 64: Range detection rates for cyclist crossing farside scenario, N = 504 ... 84
Figure 65: Range detection rates for cyclist longitudinal scenario, N = 120 ... 84
Figure 66: Range detection rates for cyclist turning left scenario, N = 280 ... 85
Figure 67: Range detection rates for cyclist turning right scenario, N = 492 ... 85
Figure 68: Pedestrian cumulative detection rates in function of tLTTB for different FOV with a transient state 0.3s (a), a transient state 0.15s (b) or with ideal braking model (c) ... 88
Figure 69: Detection rates at tLTTB for different FOV for the pedestrian crossing nearside scenario, N = 788 ... 89
Figure 70: Detection rates at tLTTB for different FOV for the pedestrian crossing farside scenario, N = 461 ... 89
13
Figure 71: Detection rates at tLTTB for different FOV for the pedestrian longitudinal
scenario, N = 20 ... 90
Figure 72: Detection rates at tLTTB for different FOV for the pedestrian turning left scenario, N = 124 ... 91
Figure 73: Detection rates at tLTTB for different FOV for the pedestrian turning right scenario, N = 55 ... 91
Figure 74: Cyclist cumulative detection rates in function of tLTTB for different FOV with a transient state 0.3s (a), a transient state 0.15s (b) or with ideal braking model (c) ... 93
Figure 75: Detection rates at tLTTB for different FOV for the cyclist crossing nearside scenario, N = 744 ... 94
Figure 76: Detection rates at tLTTB for different FOV for the cyclist crossing farside scenario, N = 504 ... 95
Figure 77: Detection rates at tLTTB for different FOV for the cyclist longitudinal scenario, N = 120... 95
Figure 78: Detection rates at tLTTB for different FOV for the cyclist turning left scenario, N = 280... 96
Figure 79: Detection rates at tLTTB for different FOV for the cyclist turning right scenario, N = 492 ... 96
Figure 80: Detection rates at tvisible-tLTTB for all pedestrian cases, N = 1509 ... 98
Figure 81: Detection rates at tvisible-tLTTB for pedestrian crossing nearside cases, N = 788... 99
Figure 82: Detection rates at tvisible-tLTTB for pedestrian crossing farside cases, N = 461 ... 99
Figure 83: Detection rates at tvisible-tLTTB for pedestrian longitudinal cases, N = 20 ...100
Figure 84: Detection rates at tvisible-tLTTB for pedestrian turning left cases, N = 124 ...100
Figure 85: Detection rates at tvisible-tLTTB for pedestrian turning right cases, N = 55 ...101
Figure 86: Detection rates at tvisible-tLTTB for all cyclist cases, N = 2261 ...101
Figure 87: Detection rates at tvisible-tLTTB for cyclist crossing nearside cases, N = 744 ...102
Figure 88: Detection rates at tvisible-tLTTB for cyclist crossing farside cases, N = 504 ...102
Figure 89: Detection rates at tvisible-tLTTB for cyclist longitudinal cases, N = 120 ...103
Figure 90: Detection rates at tvisible-tLTTB for cyclist turning left cases, N = 280 ...103
Figure 91: Detection rates at tvisible-tLTTB for cyclist turning right cases, N = 492 ....104
Figure 92: Purpose of the driving simulator campaign ...109
Figure 93: Results from the driving simulator experiment ...109
Figure 94: General organization of LMA current simulator ...112
Figure 95: Driving simulator ...113
14
Figure 97: Screen for visual-cognitive task...114
Figure 98: Facelab eye tracking device ...115
Figure 99: Clock display during video recording ...115
Figure 100: Brake deceleration profile of the driving simulator ...116
Figure 101: Pedestrian Longitudinal configuration ...120
Figure 102: View of the pedestrian set-up (beginning and end) for the P-L scenario ...121
Figure 103: Cyclist Longitudinal configuration ...122
Figure 104: View of the cyclist set-up (beginning and end) for the C-L scenario ...122
Figure 105: Turning Left and Pedestrian Left configuration ...123
Figure 106: View of the TL-PL scenario ...123
Figure 107: Turning Left Pedestrian Right configuration ...124
Figure 108: View of the TL-PR scenario ...124
Figure 109: Turning Right and Pedestrian Right configuration ...125
Figure 110: View of the TR-PR scenario ...125
Figure 111: Turning Left Cyclist Right configuration ...126
Figure 112: View of the TL-CR scenario ...126
Figure 113: Forkenbrock et al. (2011) distraction task sequence...127
Figure 114: Example of visual task for Cyclist Longitudinal scenario. The progress is the same for Pedestrian Longitudinal ...128
Figure 115: Audio-cognitive task and participant’s answer progress ...129
Figure 116: Audio FCW specification ...130
Figure 117: Visual display of FCW signal on the simulator screen and from passenger seat point of view...130
Figure 118: Gas and brake pedal time extraction ...132
Figure 119: Algorithm for creating videos with gaze location ...135
Figure 120: Gas pedal release boxplot for P-L scenario ...141
Figure 121: Brake pedal trigger boxplot for P-L scenario ...141
Figure 122: Gas pedal release boxplot for C-L scenario ...145
Figure 123: Brake trigger time boxplot for C-L scenario ...146
Figure 124: Gas pedal release time for TL-PL scenario ...148
Figure 125: Boxplot of the brake trigger time for TL-PL scenario ...148
Figure 126: Gas release time boxplot for TL-PR scenario ...150
Figure 127: Brake trigger time boxplot for TL-PR scenario ...150
Figure 128: Gas pedal release boxplot for TR-PR scenario ...152
Figure 129: Brake trigger boxplot for TR-PR scenario ...153
Figure 130: Images of the TL-CR scenario before and after the cyclist appearance ..159
Figure 131: Gas release time for new TL-PL scenario ...162
Figure 132: Brake trigger time for new TL-PL scenario ...162
Figure 133: Gas release trigger boxplot for the new TL-CR scenario ...165
Figure 134: Brake trigger time for new scenario TL-CR scenario ...165
15
Figure 136: Accident simulation algorithm integrating FCW effect ...175
Figure 137: Reconstruction simulation example integrating the effect of FCW for two FCW parameter settings ...176
Figure 138: Results of the parametric analysis for all pedestrian accidents (N = 1509) ...179
Figure 139: Results of the parametric analysis for the P-CN scenario (N = 788) ...181
Figure 140: Results of the parametric analysis for the P-CF scenario (N = 461) ...181
Figure 141: Results of the parametric analysis for the P-L scenario (N = 20) ...182
Figure 142: Results of the parametric analysis for the P-TL scenario (N = 124) ...183
Figure 143: Results of the parametric analysis for P-TR scenario (N = 55) ...184
Figure 144: Results of the 3 factor ANOVA test for all pedestrian cases (N = 1509) .186 Figure 145: Results of the 3 factor ANOVA test for P-CN cases (N = 788) ...187
Figure 146: Results of the 3 factor ANOVA test for P-CF cases (N = 461) ...188
Figure 147: Results of the 3 factor ANOVA test for P-L cases (N = 20) ...189
Figure 148: Three factor ANOVA complement without the non-significant factors ..189
Figure 149: Results of the 3 factor ANOVA for P-TL cases (N = 124) ...190
Figure 150: Results of the 3 actor ANOVA for P-TR case (N = 55) ...190
Figure 151: Results of the parametric analysis for all cyclist accidents (N = 2261)...192
Figure 152: Results of the parametric analysis for C-CN scenario (N = 744) ...193
Figure 153: Results of the parametric analysis for C-CF scenario (N = 504) ...194
Figure 154: Results of the parametric analysis for C-L scenario (N = 120) ...195
Figure 155: Results of the parametric analysis for C-TL scenario (N = 280) ...195
Figure 156: Results of the parametric analysis for C-TR scenario (N = 492) ...196
Figure 157: Results of the 3 factor ANOVA test for all cyclist cases (N = 2261) ...197
Figure 158: Results of the 3 factor ANOVA test for C-CN (N = 744) ...198
Figure 159: Results of the 3 factor ANOVA test for C-CF cases (N = 504) ...199
Figure 160: Results of the 3 factors ANOVA for C-L cases (N = 120) ...199
Figure 161: Results of the 3 factor ANOVA test for C-TL cases (N = 280) ...200
16
Table
Table 1: Main identified scenario proportion from literature review for pedestrian accidents ... Error! Bookmark not defined.
Table 2: Main identified scenario proportion from literature review for cyclist accidents ... Error! Bookmark not defined.
Table 3: A priori estimation of FCW effects ... 34
Table 4: A posteriori estimation of FCW effects ... 34
Table 4: Accident case numbers extracted from the databases... 41
Table 5: Results of the ANOVA test between the ideal and the realistic braking model (tInc 0.15s) ... 88
Table 6: Results of the ANOVA test between the ideal and the realistic braking model (tInc 0.3s)... 88
Table 7: Results of the ANOVA test between the ideal and the realistic braking model (tInc 0.15s) ... 93
Table 8: Results of the ANOVA test between the ideal and the realistic braking model (tInc 0.3s)... 94
Table 9: Proportion of accident cases classified into the different identified scenarios ...105
Table 10: Main results on accident kinematic reconstruction analysis ...106
Table 11: General characteristics extracted from accident visual analysis ...117
Table 12: Additional characteristics extracted for Longitudinal and Turning scenarios ...117
Table 13: Results of the characteristic extraction for each cyclist scenario ...118
Table 14: Results of the characteristic extraction for each pedestrian scenario ...119
Table 15: Experimental session for each participant ...137
Table 16: Planned data matrix ...137
Table 17: Actual data distribution for each scenario and each condition ...139
Table 18: Results data for P-L scenario ...139
Table 19: Driver reaction times for P-L scenario with a FCW 2s ...140
Table 20: Mean reaction values for different distraction level for the P-L scenario ..142
Table 21: Results data for C-L scenario ...144
Table 22: Driver reaction times for C-L with a FCW 2s and FCW 1.7s ...144
Table 23: Mean reaction time for different distraction level ...146
Table 24: Results data for the TL-PL scenario ...148
Table 25: Results data for TL-PR scenario ...149
Table 26: Driver reaction times for TL-PR with a FCW 2s ...149
Table 27: Results data for the TR-PR scenario ...151
17
Table 29: Results data for the TL-CR scenario ...154
Table 30: Potential driver reactions time to a FCW split according to FCW trigger times ...157
Table 31: Results data for the new TL-PL scenario ...160
Table 32: Driver reaction times for new TL-PL with a FCW 2s ...161
Table 33: Results data for the new TL-CR scenario ...164
Table 34: Driver reaction times for new TL-CR with a FCW 2s ...164
Table 35: Potential driver reaction times to a FCW split according to FCW trigger times for the new scenarios ...168
Table 36: Parameter combinations that allow reaching a maximum avoidance and mitigation rate and at least 50% avoidance in most scenarios ...184
Table 37: Correspondence between factors ...185
Table 38: Factor order of importance for P-All cases (N = 1509) ...186
Table 39: Factor order of importance for P-CN cases (N = 788) ...187
Table 40: Factor order of importance for P-CF cases (N = 461) ...188
Table 41: Factor order of importance for P-L cases (N = 20) ...189
Table 42: Factor order of importance for P-TL cases (N = 124)...190
Table 43: Factor order of importance for P-TR case (N = 55) ...191
Table 44: Global view of the factor influence order on the different pedestrian scenarios ...191
Table 45: Parameter combinations that allow reaching a maximum avoidance and mitigation rate and at least 50% avoidance in most scenarios ...197
Table 46: Factor order of importance for C-All cases (N = 2261) ...197
Table 47: Factor order of importance for the C-CN (N = 744) ...198
Table 48: Factor order of importance for C-CF cases (N = 504) ...199
Table 49: Factor order of importance for C-L cases (N = 120) ...200
Table 50: Factor order of importance for C-TL cases (N = 280) ...200
Table 51: Factor order of importance for C-TR cases (N = 492) ...201
Table 52: Global view of the factor influence order on the different cyclist scenarios ...201
19
Preface
Since 2008, Toyota Motor Europe NV/SA and IFSTTAR (the French institute of science and technology for transport, development and networks) are collaborating on different research projects. Among them, the VRU-SIM project which started in 2016 and aimed at estimating the safety benefits of pedestrian and cyclist Forward Collision Warning system and the sensibility to system parameters.
This project was under the supervision of IFSTTAR and Toyota researchers. It was funded by Toyota and followed the work of Hédi Hamdane on the improvement of pedestrian safety that ended in 2016. Two interns also contributed to this project, Guillaume Lechevallier for two months and Jordan Lecoeuvre for six months. The project ended in 2019 with the delivery of deliverables and with a presentation in Japan.
During the course of the project, IFSTTAR merged in 2020 with other entities and became the first French national university, Université Gustave Eiffel.
20
1. Introduction
1.1 Pedestrian and Cyclist accidentology
1.1.1 General context
In 2016, 1.35 million road deaths can be counted making it the eighth leading death cause worldwide according to the World Health organization (WHO 2018). Still a high proportion of those deaths concern pedestrians or cyclists which worldwide globally represent respectively 23% and 3% with disparities.
Approaching to the end of the Decade of Action for Road Safety, the objective for road safety was to halve the number of road deaths by 2020. In Europe, even if road fatalities were reduced by 21% in 2018 compared to 2010, the objective may not be reached. Pedestrians’ fatalities decreased by 15% from 2010 to 2017 and reached 21% whereas for cyclists, the decrease was only of 2% for the same period reaching 8% (European Commission 2019a). So it appears important to develop the pedestrian and cyclist road safety according to the issue that it represents. Figure 1 illustrates fatalities evolution curves for pedestrians and cyclists in Europe during the last years.
Figure 1: Fatalities curves evolution for pedestrians and cyclists in Europe. (European Commission 2019b)
1.1.2 Accident scenarios
The identification of the most frequent accident scenarios is the first step in order to determine the challenges and issues for pedestrian and cyclist safety. Through it, the best or at least the most appropriate measures can then be taken. To that end, many researches
21
have been performed in that way since the 1990s with the identification of cyclist and pedestrian accident scenarios in the United States (Hunter et al. 1997a; Hunter et al. 1997b). Brenac et al. (2003) identified accident scenarios and their proportion in France where a pedestrian was involved. Based on the analysis of vFFS Group on the GIDAS database, their identification of pedestrian scenarios had been reused in the European project AsPeCSS (Schaller et al. 2012). Blower (2014) identified key pedestrian collision scenarios for avoidance technologies in the United States. In 2015, French accident scenarios were extracted through the reconstructions of a sample of 100 accidents where a pedestrian was injured (Guillaume et al. 2015). The same year, by combining different databases, Martin and Wu (2015) extracted French pedestrian accident scenarios and also proposed a weighting method to be representative of France accidentology for their scenarios. The scenario identification work can also be found for cyclist as it can be seen in different researches. MacAlister and Zuby (2015) extracted cyclist accident scenarios in United States for the design of cyclist detection system. In Germany, Kuehn et al. (2015)
performed a similar work using a database from German Insurers. In France, Clabaux and Brenac (2010) identified urban accidents involving cyclists. Scenario identification can also be found in different projects. In AsPeCSS project (The Assessment Methodologies for Forward Looking Integrated Pedestrian and Further Extension to Cyclists Safety Systems)(Rodarius et al. 2014), cyclist accident scenario identification was performed for the Netherland and for the United Kingdom. They proposed an urban crossing, a turning right and left and an inter-urban longitudinal scenario. In “CATS: Cyclist-AEB-Testing System” project (Uittenbogaard et al. 2016a; Uittenbogaard et al. 2016b), they proposed test scenarios with consideration of the car and cyclist trajectories and without taking into account the infrastructure. Scenarios found were a cyclist crossing from the left or the right when a car is going straight, the car turning to the left or to the right with cyclist coming from different origin and a car going straight with a cyclist going also straight or coming on the opposite direction. In the “Proactive Safety for Pedestrians and Cyclists” (Prospect project) (Wisch et al. 2016), cyclist scenarios were extracted for different European countries in order to be extended for Europe. They proposed scenarios where a car is going straight with a crossing cyclist, car turning with different cyclist origin and a car is going straight with a cyclist going in the same direction as the car. This literature feeds the Euro NCAP consumer organization who has progressively integrated new scenarios in their test protocols (see section 1.3.4).
Accidents can be also classified into different groups depending on the object of interest. Huang et al. (2006) worked on STRADA, a Swedish database to analyze the requirement for pedestrian detection sensors located in a car. They extracted 2 scenarios: a pedestrian crosses before or after the intersection and a passenger car is going straight forward. Jermakian and Zuby (2011) and Blower (2014) analyzed two American databases to extract their accident scenarios. Jermakian and Zuby (2011) extracted three scenarios with consideration of both car and pedestrian trajectory. They considered a car going straight and a pedestrian crossing, a car going straight and a pedestrian walking
22
straight in-line with traffic and a car turning and a pedestrian crossing. In a similar way,
Blower (2014) also identified pedestrian scenarios based on both trajectories in order to identify requirements for collision avoidance technology. With the identification of accident scenarios for pedestrian, assessment programs have started to integrate them progressively in the car rating system since 2014. This way, Euro NCAP (2015) presented an assessment protocol with precise testing configurations. They proposed to evaluate crossing situations with pedestrian coming from the left or right side of the car. They also proposed a scenario with a crossing child instead of an adult coming from the right with visual occlusion. They also added in 2019 new scenarios which concern turning manoeuvers (Euro NCAP 2019b) which were not previously addressed.
As the VRU safety does not only concern pedestrian, it was planned to also focus on cyclist. Many researches analyze cyclist accidents in order to extract accident scenarios.
Kuehn et al. (2015) analyzed a database created by the German Insurers Accident Research that contained accident cases where damage costs were higher than 15,000€. They identified three main scenarios, a car traveling straight with a cyclist coming from the right, a car turning to the right with a cyclist coming from the right and a car going straight with a cyclist coming from the left. MacAlister and Zuby (2015) extracted cyclist scenarios from two American databases. They have considered the trajectories of both car and cyclist and found scenarios in which a car is going straight with a cyclist traveling in-line or against the traffic, a car is going straight with a crossing cyclist or a car turning at an intersection with different origin for the cyclist. From these literature review and different projects, assessment protocol proposition appears in 2017 for cyclists (Euro NCAP 2017c). The scenarios in this test protocol were similar than pedestrian ones with one additional configuration, a longitudinal scenario. The longitudinal scenario is a configuration in which a car and a cyclist are going straight forward in the same direction. This is a configuration that can be usually encountered when driving. Thus, it appears natural to also analyze this type of configuration.
As it can be seen, the literature review shows lots of different accident scenarios and some common characteristics that can be found in different researches. Assessment programs have included the most common and frequently encountered scenarios in the evaluation of car safety. However as it can be noticed, some configurations were not addressed yet until recently. As an example the turning configurations have been added only recently as a scenario for pedestrians and is still not included for cyclists (Euro NCAP 2019b).
The following tables give a summary of the main scenarios identified in the major studies. Error! Reference source not found. is an illustration example of accident scenarios.
23
Figure 2: Main accident scenarios identified by Op den Camp et al. (2016)
Crossing Turning Longitudinal Others Total Country Representative Schaller
(2012) 74.3% 11.2% 3.3% 11.2% 100% Germany Not mentioned Blower
(2014) 36.7% 30.1% 4.4% 28.8% 100% US Yes Guillaume
(2015) 83% Include in Others 7% 10% 100% France No Martin
(2015) 53.7% 15.4% 3.2 27.7 100% France Yes Brenac
(2003) 56% 5.8% 4.3% 33.9% 100% France Yes * * The scenarios are relevant but the proportions might be a little different
Table 1: Main identified scenario proportion from literature review for pedestrian accidents
Crossing Turning Longitudinal Others Total Country Representative MacAlister
(2015) Not known Not known Not known Not known 100% US Yes Rodarius
(2014) 28.1% 40% or 35.2% 10.7% 26% 100% UK Yes more 20% or more Not known Not known 100% Netherlands Yes Uittenbogaard
(2016a) 55.5% 9.5% 16.5% 18.5 100% France Germany Italy Netherlands Sweden UK No Kuehn (2015) ~32% or
more ~17% or more Not known Not known 100% Germany No
Table 2: Main identified scenario proportion from literature review for cyclist accidents
1.1.3 Risk factors
Thank to scenario identification and accident analysis, it is also possible to determine and evaluate risk factors for pedestrians and cyclists safety. Impact speed is indeed a risk factor for vulnerable road users (VRU) that can induce severe or fatal injuries. A review of literature was performed by Rosén et al. (2011) for pedestrians about the speed factors.
24
Fredriksson and Rosén (2012) analyzed the combination of active and passive countermeasures for the head injuries in pedestrian accidents. Similarly, risk factors can also be seen through another point of view as done by Keall et al. (2014). They analyzed the evolution of fatal and severe injuries for pedestrians according to renewal of vehicle fleet in Australia and New Zealand. Wang et al. (2017) analyzed risk encountered for different transport modes: cars, pedestrians or cyclists. As seen for pedestrians, Martinez-Ruiz et al. (2015) analyzed the cyclist risks in Spain according to gender and age parameters. Reynolds et al. (2009), Vandenbulcke et al. (2014) and Robartes and Chen (2017) determined the cycling risk by taking into account factors like infrastructure, environment, and traffic. With the risk information, acting on some of those factors could be an effective way for injury reduction. Indeed, a strong impact could be realized to switch the proportion of fatal to severe injury, and severe to light injury. Thus, through the combination of multiple factors, a more or less important offset effect can be achieved.
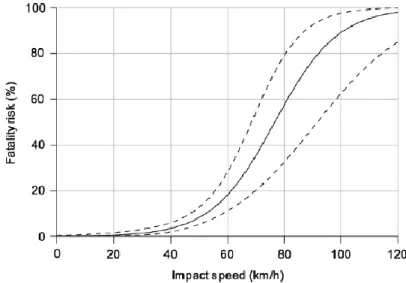
The following Figure 3 to Figure 6 show the risk curves for pedestrian and cyclists obtained by different authors and show difference according to the considered countries.
Figure 3: Pedestrian risk of death in function of the impact speed in the United States (Tefft et al. 2013)
25
Figure 4: Fatalities risk for pedestrians and cyclist in China (Nie et al. 2015)
26
Figure 6: Pedestrian fatality risk by impact speed (Hussain et al. 2019)
The VRU displacement speed can also have an influence. Indeed, the displacement speed combined to other factor like occlusion for example can also then be a factor in car-to-VRU crashes. Pedestrians are usually considered walking at 5km/h (Huang et al. 2008)
which is low speed compared to bicycle one. Schleinitz et al. (2017) found on a naturalistic study that cyclist speed reached up to 45 km/h with electric assistance compared to the 25km/h without. As we will see later, this significant difference in displacement speed can greatly affect detection system and thus their effectiveness.
1.2 Pedestrian and Cyclist safety
1.2.1 General concepts
In order to determine how positively VRU safety can be improved, it is necessary to understand and describe what an accident is. Ferrandez et al. (1995) identified and described the four different phases constitutive of an accident. At first, there is a “normal driving situation” in which the driving task is normal and under control by the driver. In accident scenario, the normal driving situation is interrupted by a rupture situation. This rupture which is of a short duration corresponds to an unexpected event that is the transition between the normal driving situation to the emergency situation. During the emergency situation, a time and space limited problem is presented to the driver which has to resolve it. However, the accident still occur whatever the emergency manoeuver engaged by the driver, meaning that the manoeuver has failed. Thus, the emergency situation leads to the fourth and final phase: the crash.
27
The general objectives to protect the pedestrian and the cyclist during an accident are summarized in the following Figure 7:
Figure 7: Sequences prior the impact with possible action during the different sequences
Prior a crash, safety systems can be spread into active and passive. Active safety systems regroup all features that can avoid or reduce the severity of a collision contrary to passive safety which objective is only to reduce or decrease the consequence after the collision happens. Among the active safety features, we can find systems that allow the driver to be aware of the surroundings environment and other road users like pedestrians or cyclists or warn the driver of a hazard. It can also signal the driver to act in order to react to an emergency situation. On the opposite side, among passive safety features, seatbelt and airbag can be found for drivers’ safety. For VRUs, car flexible structures allow the absorption of a part of the energy during the collision as airbag combined with rising hood to reduce VRU injuries. The combination of both active and safety features are complementary and will be described with more details in next sections.
1.2.2 Passive safety
Concerning the crash phase, passive safety systems have been developed to protect and limit as far as possible the impact against the car. From a global point of view, the main objective of the passive safety is to build car less aggressive for the VRU (Serre 2009). When a vehicle strikes the pedestrian, there are three main body regions injured: the impact of the lower limb on the bumper, the impact of the pelvis on the lower part of the bonnet and the impact of the head of the bonnet or the windscreen as illustrated by the test protocol in Figure 8and a test example in Figure 9.
New proposals exist to improve road safety for VRU. Among them, we can find a device composed of an airbag and a rising hood. This device is supposed to reduce injuries for a pedestrian being hit by a passenger car. Many evaluations have been proposed and performed. Maki et al. (2003) described such system to analyze pedestrian collision kinematic. Holding et al. (2001) studied a pedestrian airbag to determine pedestrian proximity detection for the triggering of the device and found important injuries reduction with this kind of system. Yang et al. (2015) and Lim et al. (2014) performed
28
evaluation for the airbag and hood system design. The objective of the first was to determine the design parameters of the device using experiments whereas the second aimed at determining head injuries reduction. In a similar way as Lim et al. (2014),
Fredriksson and Rosén (2012) evaluated the potential head injuries reduction for hood and airbag device.
Figure 8: Pedestrian protection test methods proposed by EEVC WG10 (European Enhanced Vehicle-Safety Committee 1998)
Figure 9: Example of pedestrian crash on a vehicle from Masson et al. (2007)
1.2.3 Active safety
Concerning the active safety, it consists to avoid the accidents as far as possible or at least reduce the impact speed. Indeed, after a rupture phase has been identified, the earlier an intervention can be performed during the emergency situation, the better effect can be achieved. So, the objective is first to prevent or alert the driver or/and the VRU about their respective presence and secondly to deploy systems in order to avoid or
29
mitigate the impact. This way, Advanced Driver Assistance System (ADAS) can be of great help.
Technologic proposal concerns communication systems that send a message to vehicle drivers and/or to VRU. Many different communication systems can be found like vehicle-to-everything (V2X), vehicle-to-pedestrian (V2P), vehicle-to-cyclist (V2C) and also vehicle-to-infrastructure (V2I) and vice versa. In this type of system, the main goal is to warn the receiver of a dangerous situation or simply to report to be careful. Rahimian et al. (2018) proposed a mobile device to warn pedestrians of an unsafe crossing with a communication system between vehicle and pedestrian mobile phone. Wu et al. (2014) proposed a warning system that warns users (car and VRU) of a collision. Hussein et al. (2016) went further with a system that communicates in both directions from vehicle to pedestrian and also vice versa. Bagheri et al. (2014) and Anaya et al. (2014) developed mobile application with the objective to warn walking pedestrian.
Other original ideas can be found like a system that warns VRU in the situation of a collision. It is the case of Van Brummelen et al. (2016) who proposed a cyclist low cost device based on laser and ultrasonic sensors to warn cyclist through a haptic signal. Jeon and Rajamani (2018) proposed a similar system which should work for collision with vehicle rear and right-turning vehicle at a traffic intersection.
Assistance technologies can either alert or avoid the accident. Through information gathered by sensors and merged together, vehicles have now the possibility to warn of hazard during the driving so the driver can take appropriate measures. This can be performed by a Forward Collision Warning (FCW). In the case of no reaction from the driver, vehicle system can decide to perform an Automatic Emergency Braking (AEB).
So, between AEB and FCW device, only the final aim is different. An AEB system triggers automatically and does not need a human intervention contrary to a FCW where human is in the center of the loop. These two ADAS are developed in the next section.
1.3 AEB and FCW system
1.3.1 Functioning
In a general way, AEB and FCW system work in a similar way. Those systems observe, identify, track and take appropriate action according to the situation. The observation step consists of monitoring the surroundings with the help of the different sensors mounted on the vehicle. Data gathered will be used in the identification step. Depending on the sensor specificities, different methods will be used to correctly identify what is present in the environment. Then, the identified element like VRUs and other cars can be tracked. The tracking will be used in order to determine potential collision. In that case, a decision algorithm intervenes to determine if an AEB or FCW system triggering is required and when so the driver can act.
30
The sensors system is similar for both AEB and FCW composed of the combination of multiple different sensors like a camera, radar, LIDAR or infrared radiation (IR). Camera allows identification and tracking of elements in the vehicle surrounding (Fardi and al. 2006a). LIDAR and radar use time-of-flight to create a precise map of the surrounding environment (Fuerstenberg and Willhoeft 2001; Szarvas et al. 2006). Infrared radiation can be used to distinguish difference of temperature between human body and the environment (Fardi et al. 2006b). Each sensor has it strength and weakness and is complementary. For example cameras are strongly affected by lighting conditions contrary to LIDAR and radar (Fritsche et al. 2017). Object recognition is more difficult for LIDAR and radar whereas for camera, this process can be more effective depending on the learning model behind. A review of sensors technologies is made by Gandhi and Trivedi (2007).
Two parameters are in particular important for the sensors in the detection of the VRU: the Field of View (FOV) and the Range (Figure 10). The field of view represents the detection cone angle in front of the sensors and is usually described in degrees. The range corresponds to the detection distance reachable by sensors mentioned in meters.
Figure 10: Illustration of the FOV and range (Meinecke et al. 2005)
Thus merging data from these different sources allows detection system to be more robust and accurate even if it remains possible to have only one sensor system. Bertozzi et al. 2006, Meinecke et al. 2005, Scheunert et al. 2004, Szarvas et al. 2006 are examples that illustrates sensor combination for pedestrian detection. Gavrila et al. (2004) and Geronimo et al. (2010) used camera only for pedestrian detection system as did Li et al. (2016) for cyclist detection.
In the case of a FCW, other multiple factors have to be taken into account like the trigger timing of the system according to the drivers’ reaction time to the system. Those are the two main visible factors that have to be considered for the evaluation of such device. However, many difficulties can be found in the FCW design. Among them, we can quote the difficulties to correctly recognize VRU, predicting a collision path between the vehicle and a VRU path (Meijer et al. 2017), determining the most appropriate trigger timing to alarm drivers for example. Thus, establishing a correct and exhaustive evaluation for FCW appears to be a complex task that requires multidisciplinary skills.
31
1.3.2 Driver’s reaction
The objective of this research is to determine the benefits a FCW can achieve for pedestrian and cyclist safety. To that end, it is necessary to take into account how drivers will react. However, understanding and modeling drivers’ reaction is a difficult task. That is why, the choice of driver reaction model is crucial in order to be able to correctly evaluate FCW effect. A review of drivers’ reaction literature is given in order to highlight the difficulty to choose a driver model. In this PhD, a driving simulation will be performed to extract a mean behavior to a FCW in different scenario configurations.
A lot of researches about driver’s reaction can be found in the literature. This topic has always been of interest as its understanding can lead to model a driver behavior, models that can be used for system evaluation for example. Van der Hulst et al. (1999) analyzed driver’s behavior in a car following task with different deceleration level of a lead vehicle in expected or unexpected situations. In their analysis, they analyzed the two components of driver’s reaction: the time from the perception of a signal to the release of the accelerator pedal and the time from the release of the accelerator pedal to the depression of the brake pedal. This way, they were able to compare drivers’ reaction for different driving situations. Drivers’ reaction literature review can also be found in Young and Stanton (2007) and in Wood and Zhang (2017). The first analyzed drivers’ reaction in non-automated vehicle through a driving simulation study whereas the second used naturalistic driving data. Nevertheless, reaction towards a FCW to evaluate headway distance for a car following task can be found in the literature as the one performed by
Aksan et al. (2016) for different age groups. Depending of the objective a FCW would reach, the design of such system requires to be carefully considered. Dozza et al. (2017) helped in designing an effective FCW system by highlighting relevant factors. Also, as mentioned by Bärgman et al. (2017) the choice of driver reaction model is of importance. Different types of signal can be used in order to inform drivers. It can be audio, visual or also haptic signal alone or a multiple combination of them. Campbell et al. (2007) made a review of human factors knowledge that can have an application in the conception of audio, visual or haptic warnings. They also gave guidance and recommendations for FCW design and also for others ADAS as well. Depending on the considered signal, drivers’ reaction can be improved. Lylykangas et al. (2016) analyzed drivers’ reaction time in emergency scenarios with FCW. They found that tactile and visual-tactile signals help drivers react faster compared to an only visual signal.
Aust et al. (2013) also analyzed a combination of audio and visual signal in order to study FCW effect for repeatedly exposure on emergency braking. They found that the more drivers were exposed to FCW, the faster they can react to the signal. This is also confirmed by Koustanaï et al. (2012) where the FCW was more effective with familiarized drivers compared to unfamiliarized.
Prior evaluating drivers’ reaction towards a FCW, it is well known that many factors have to be taken into account. Either the perception reaction time or on the movement
32
time (time to release the gas pedal to the depression of the brake pedal) are affected by age or gender as shown by Warshawsky-Livne and Shinar (2002). The reaction time can also be affected by the expectation of an event (Wood and Zhang 2017). Schweitzer et al. (1995) made a comparison of the total braking time (TBT) reaction based on three awareness levels. They found that the more expected is an event, the faster drivers react to it. Similarly, Abe and Richardson (2006) worked on the effect on trust and driver expectation from FCW system. They showed that faster reactions could be obtained when an earlier alarm is triggered. Thus, it appears obvious that the earlier a warning is given, the best reaction can be achieved. However, Zador et al. (2000) analyzed that effect based on the trigger time. They found that driver’s trust and acceptance can be affected if an alarm is given too early. Indeed, it might appear as a false warning. On the other side, a too late alarm may decrease the trust in the system. This highlights once again a crucial parameter which is the warning time of the system. Nevertheless, when the system is completely reliable, hazard detection is faster as shown by Bueno et al. (2012) for motorcycle detection. Thus, avoidance strategies can appear. Wu et al. (2017) analyzed this effect for FCW for rear-end collision and found two different behaviors, braking and steering. However, performance can be affected by distraction.
Disturbing elements can be present in the surrounding environment and need to be measured (Strayer et al. 2013). Still, FCW can have a positive effect. Bueno et al. (2014) found positive effect of FCW in the case of low distracted drivers. However, on highly distracted drivers, FCW effects disappear underlying the necessity of attentional resources to process the warning signal. Harbluk et al. (2007) study reveals that depending on the distraction level, visual behavior and braking performance can be affected. Thus being able to predict drivers’ intention might be an interesting lead as it can help either to know if a warning system has to be triggered and also when. Diederichs et al. (2015) made this kind of analysis with the idea to avoid annoyance before initiating an automatic system trigger like an AEB. This idea is more than of interest in the case of a FCW. In order to highlight FCW potential safety, more knowledge about driver model is required in order to correctly evaluate FCW efficiency (Bärgman et al. 2017). Puente Guillen and Gohl (2019) proposed that FCW should be elaborated based on a driver model. However, finding the appropriate model is still a challenge nowadays.
1.3.3 Benefits of AEB and FCW
With the apparition of ADAS, several studies had been performed in order to determine their potential benefits on road safety (Coelingh et al 2010; Jermakian (2011); Zhao et al. 2017). Among the different ADAS that can be found in the market, a focus will be given here on AEB and FCW. Those two safety systems started appearing in the 2000s and were designed to improve road safety.
Thus evaluations of these systems have been conducted to determine their effect on driving. Initial evaluations were performed on rear-end crash between two cars
33
(Forkenbrock and O’Harra 2009; Forkenbrock et al. 2011). The aims of those studies were to determine an appropriate trigger time for a FCW system and also drivers’ reaction to the trigger. Fildes et al. (2015) also made an analysis on rear-end crash reduction for a car-to-car AEB system and found an effect of 38%. In a similar way, Seacrist et al. (2019)
evaluated AEB for rear-end crash using simulation on naturalistic rear-end crashes and found that a rate of 80% effectiveness can be reached.
After considering car-to-car rear end crashes, accidents involving different VRU had been also considered. Introduced first for pedestrians, studies can be found evaluating AEB effect for pedestrian accident scenarios like in Rosén et al. (2010) or the combination of FCW and AEB as in Coelingh et al. (2010) or in Lubbe and Kullgren (2015). Hamdane et al. (2015) identified the issues and challenges for a pedestrian AEB for real world accidents. Concerning cyclists, Lenard et al. (2018) made an analysis on cyclist accidents to determine the characteristics of a car AEB. However, only few analysis were realized for FCW for bicycle accident scenarios.
Zhao et al. (2019a) analyzed AEB effectiveness based on accident reconstructions from video recorder on taxi-to-cyclist. They found that FOV parameter has a significant influence on collision avoidance. Even with an ideal AEB detection system, i.e. 360° detection angle, some collisions were unavoidable due to cyclists’ sudden appearance in front of cars. Lenard et al. (2018) analyzed the FOV values for a pedestrian and cyclist AEB on an English database. They found that 90% cyclists were located in ±80° FOV (e.g. a total detection cone of 160° in front of the car) and within 42m far from the car at Time To Collision (TTC) 3s. They also found that for pedestrians a ±20° FOV (e.g. a total detection cone of 40° in front of the car) was required to detect 80% and within 50m far from vehicle at TTC 3s. In a similar way, Hamdane et al. (2015) found that an AEB system with a 35° field of view seems relevant for detection and crash avoidance with pedestrian. Ohlin et al. (2017) also analyzed the combined measure effect on Swedish accident. They estimated that large injury reductions can be gained with the addition of an AEB for pedestrians and cyclists combined to others measures. Kusano and Gabler (2012) also estimated the injury reductions for the combination of three precollision systems for real-world rear-end crashes. Up from 29% to 56% of fatal injured drivers can be reached. Using a different method, Høye et al. (2015) also estimated up to maximum 16% the killed and seriously injured reduction in Norway during the next 20 years.
Jeppsson et al. (2018) proposed and evaluated also the effect of a Vacuum Emergency Braking system for pedestrian safety in addition to an AEB. This system improves vehicle braking deceleration when combined with a pedestrian AEB reducing up to 22% more casualties compared to an only AEB system.
All those presented studies had estimated the benefits of some safety systems. However, not all benefits have been analyzed and evaluated yet. Indeed as shown in Table 3 and Table 4, most evidences for FCW effects concern car-to-car crashes and very little
34
VRU. Additionally, the effect estimation is not performed on all accident configurations. Thus this shows the lack of knowledge of FCW effect for different VRU and on specific situations.
A priori
Authors Høye et al. 2015 Kusano and Gabler 2012 Jermakian 2011
System ACC + FCW + AEB;
Pedestrian/cyclist warning with AEB FCW only; FCW + PBA; FCW + PBA+ PB FCW
Metric Injury reduction Casualty reduction Crash avoidance
Remarks Based on Delphi study on 41
vehicle safety experts Rear-end collision Car-to-car collision
Effectiveness 16% for killed or seriously
injured Up to 50% Effect on 1.2 million crashes per year on US
ACC: Automatic Cruise Control PBA: Precrash brake assist PB: Autonomous precrash brake
Table 3: A priori estimation of FCW effects
A posteriori
Authors Lubbe and Kullgren 2015 Forkenbrock et al. 2011
System AEB; FCW FCW
Metric Casualty cost reduction Collision avoidance
Response time
Remarks Five pedestrian crossing configurations;
Early and late systems activation; Two different FCW signals;
Simulation for driving speed up to 140 km/h
Car-to-car crashes;
Analysis on commercial systems; 8 different FCW alert signals Effectiveness 25% for AEB
No effect to 25% for FCW
Crashes in still 53% for the best FCW alert; Crash avoidance reactions: from 270 to 870ms
Crash with likely reactions: 330 ms to 1s Crash with not likely response: 870 ms to 1.74s
Table 4: A posteriori estimation of FCW effects
1.3.4 Assessment protocols
AEB were first developed and introduced in safety rating in 2014 to address rear-end car-to-car crashes. Then it has been extended later to address crashes with pedestrians in 2015 and more recently for cyclists in 2018. Since the combination of AEB and FCW can increase road safety effectiveness, the European Commission has decided in 2017 to render mandatory some safety features for new car models like advanced emergency braking or vulnerable road user detection and warning for trucks and buses (European Commission 2018).
35
Before rendering those safety systems mandatory, test protocols have introduced the evaluation of some of them. Indeed, the European New Car Assessment Program (Euro NCAP) a consumer organization has integrated the testing of those systems in the car’s evaluation. Starting in 2013, AEB and FCW were assessed for car-to-car collision (Euro NCAP 2013). Then little by little, evaluations integrated a scoring system (Euro NCAP 2017a; Euro NCAP 2019a) and test scenarios towards pedestrians and cyclists. Concerning scenarios, it can be noticed that all scenarios were not addressed. At first, different crossing scenarios were evaluated for pedestrians with or without visual occlusion before the impact. It concerned adult or child pedestrians crossing from the closest (nearside) or far (farside) side of the road. Later a longitudinal scenario has been added. Recently in 2019, turning scenarios were added in the evaluation for pedestrian AEB with consideration for a car turning to the left or to the right (Euro NCAP 2019b). For cyclists, scenarios addressed were crossing and longitudinal for cyclist AEB (Euro NCAP 2017b). The missing scenarios that have currently not being addressed by Euro NCAP at the time of the writing of this document are: a collision with a cyclist during a car turning left and right manoeuver whatever the origin of the cyclist. With AEB scenario evaluation updates, the scoring system has also been updated. Contrary to the AEB system which has been integrated into many different cars’ evaluation protocol, the FCW device has been only added for one specific scenario: the longitudinal (Euro NCAP 2018). As the FCW evaluation is only performed on one specific scenario for cyclists, it appears that identifying the other scenarios can help in the correct evaluation of this safety device. Thus identifying the other scenarios where the FCW can be applied will help completing the knowledge about the effect a FCW can have on cyclist general safety. Additionally, it can also be interesting to see FCW effects for pedestrian safety which can complete and be combined with AEB.
1.4 Research questions
1.4.1 Aim and objectives
The main objective of this thesis is to estimate the benefits of FCW system for different VRU (pedestrian and cyclist) according to different accident configurations based on real-world accident reconstructions. Additionally, a benefit comparison will be given between the different VRU. To that end, some intermediate research questions will be considered to reach the global aim of this work. The first part concerns scenarios and the identification of an AEB characteristic. The second focuses on driver’s reaction in different scenarios and per VRU. The final part is the simulation of FCW effect on real world accidents that will lead to the benefit estimation of the FCW system per scenario and per VRU.