HAL Id: tel-01588195
https://tel.archives-ouvertes.fr/tel-01588195
Submitted on 15 Sep 2017
HAL is a multi-disciplinary open access archive for the deposit and dissemination of sci-entific research documents, whether they are pub-lished or not. The documents may come from teaching and research institutions in France or abroad, or from public or private research centers.
L’archive ouverte pluridisciplinaire HAL, est destinée au dépôt et à la diffusion de documents scientifiques de niveau recherche, publiés ou non, émanant des établissements d’enseignement et de recherche français ou étrangers, des laboratoires publics ou privés.
Essays in Economic Psychology of Tax Evasion Behavior
Antoine Malezieux
To cite this version:
Antoine Malezieux. Essays in Economic Psychology of Tax Evasion Behavior. Economics and Finance. Université de Lorraine, 2017. English. �NNT : 2017LORR0062�. �tel-01588195�
AVERTISSEMENT
Ce document est le fruit d'un long travail approuvé par le jury de
soutenance et mis à disposition de l'ensemble de la
communauté universitaire élargie.
Il est soumis à la propriété intellectuelle de l'auteur. Ceci
implique une obligation de citation et de référencement lors de
l’utilisation de ce document.
D'autre part, toute contrefaçon, plagiat, reproduction illicite
encourt une poursuite pénale.
Contact : ddoc-theses-contact@univ-lorraine.fr
LIENS
Code de la Propriété Intellectuelle. articles L 122. 4
Code de la Propriété Intellectuelle. articles L 335.2- L 335.10
http://www.cfcopies.com/V2/leg/leg_droi.php
U
NIVERSITÉ DE
L
ORRAINE
THÈSE POUR L’OBTENTION DU TITRE DE DOCTEUR EN
SCIENCES ECONOMIQUES
Essais sur la Psychologie Économique du
Comportement d’Évasion Fiscale
Thèse présentée et soutenue publiquement le 23 juin 2017 par
Antoine MALÉZIEUX
MEMBRES DUJURY
Yannick GABUTHY Professeur, Université de Lorraine Directeur de thèse Nicolas JACQUEMET Professeur, Université Paris 1 Sorbonne Directeur de thèse
Erich KIRCHLER Professeur, Universität Wien Rapporteur
Angela SUTAN Professeure, Groupe ESC Dijon Bourgogne Président Marie-Claire VILLEVAL Directrice de Recherche CNRS, GATE Rapporteur
U
NIVERSITÉ DE
L
ORRAINE
DOCTORAL THESIS FOR THE DEGREE OF DOCTOR OF
PHILOSOPHY IN ECONOMICS
Essays in Economic Psychology
of Tax Evasion Behavior
Publicly defended on 23 June 2017 by
Antoine MALÉZIEUX
DISSERTATION COMMITTEE
Yannick GABUTHY Professor, Université de Lorraine PhD Advisor
Nicolas JACQUEMET Professor, Université Paris 1 Sorbonne PhD Advisor
Erich KIRCHLER Professor, Universität Wien Discussant
Angela SUTAN Professor, Groupe ESC Dijon Bourgogne President Marie-Claire VILLEVAL Research Professor CNRS, GATE Discussant
Acknowledgments
When I started going to University 10 years ago, nothing foresaw me doing a PhD. I am first especially grateful to the social French state for providing me scholarships for 6 years and a free education system. The topic of this thesis–public finance–has something to do with it. My second thanks goes to luck. I have always found myself in the right place at the right time. I have thus been immensely lucky to meet my first PhD advisor, Nicolas Jacquemet. Thank you, Nicolas, for trusting me and teaching me absolutely everything, from econometrics to proofreading my bibliography for typos. You set a role model for me of the perfect researcher. If there would be a Nobel Prize (or a Swedish National Bank’s Prize in Memory of Alfred Nobel) of gratitude, I would give it to you.
My thanks go also to the Université de Lorraine, the Bureau d’Economie Théorique et Appliqué and the École Doctorale Sciences Juridiques, Politiques, Economiques et de Gestion. More precisely, I thank first my second PhD advisor, Yannick Gabuthy. I also thank my colleagues (profes-sors, assistant professors and former professors), amongst them Sabine Chaupain-Guillot, Olivier Damette, Marc Deschamps, Pascale Duran-Vigneron, Samuel Ferey, François Fontaine, Eve-Angeline Lambert, Anne Plunket and Romain Restout. I thank my fellow (and former) PhD students from Nancy: Camille, Pauline, Cécile, Julie, Julien, Reynald, Isselmou, Emilien, Olivier and Wafa. I also thank the BETA administrative staff: Julie, Muriel, Catherine and Sylviane. I especially thank BETA’s head, Bruno Jeandidier. I also thank ED’s head, Myriam Doriat-Duban, ED’s vice head, Nathalie Deffains and ED’s secretary, Sandrine Claudel-Cecchi. Finally, I thank the UL’s board for giving me a 3 years Contrat Doctoral scholarship, back in 2013.
I want to thank people I met in the different places my studies brought me. First of all, I thank Marie-Hélène Jeanneret-Crettez, my first economic professor for helping me throughout all of my studies: from my first until my last year. I also thank professors I met in Université Paris 5 -René Descartes, on the economic side: Olivier Allain, Marie-Annick Barthes, Jérôme Lallement and Thomas Porcher, and on the psychology side: Julie Collange, Todd Lubbart, Christophe Mouchiroud, Nils Myszkowski, Martin Storme, Jean-Louis Tavani and Franck Zenasni. I thank the Master Economic and Psychology staff, particularly its former head: Louis Lévy-Garboua, and the alumni I met there: Niels, Elisa, Marco, Marine, Manu, Juan Pablo and Claire. I thank (current and former) PhD students from Paris 1 Panthéon-Sorbonne and Paris School of Economics: Pierre, Anna, Féryel, Léa, Sandra, Antoine (Hémon), Antoine (Prévet), and Rémi. I thank Christoph Engel for his welcome at the Max Planck Institute and all the researchers that I had the opportunity to meet there.
I want to thank now all the people who helped me doing this thesis: Stéphane Luchini, my unofficial PhD advisor, Jason Shogren, and Kene Boun My. I thank Moussa for his endless help in econometrics. I thank my proofreaders: Laura, Tristan and Liane. I thank Patrick and Lysa for their material support while studying and writing this thesis. I thank Nikolas for his emotional support. I thank James Alm, Cécile Bazart, Béatrice Boulu-Reshef, Todd Cherry, Taya Cohen, Fabrice Le Lec, Drazen Prelec, Jean-Robert Tyran, Ingrid Wahl and participants at several seminars and conferences for their comments and the helpful discussions from which I benefited. My special thanks are going to my jury members: Erich Kirchler, Angela Sutan and Marie-Claire Villeval, whose comments and attention helped me shape this thesis. I also thank my friends, my family and especially my mother for their support. Finally, I thank all the people who have, through face-to-face, texts or email exchanges, helped, taught and led me to this thesis conclusion.
Résumé
Cette thèse en économie s’efforce d’intégrer les dernières avancées de la psychologie dans l’analyse de l’évasion fiscale. La méthode utilisée est celle de l’économie expérimentale. Le pre-mier Chapitre utilise les acquis de la psychologie différentielle et de la psychométrie pour cor-réler le comportement d’évasion fiscale observé dans le laboratoire aux traits de personnalité individuels, mesuré grâce à des questionnaires psychométriques standardisés. Ces question-naires de personnalité sont liés aux émotions morales, aux jugements moraux et à la soumis-sion à la norme. Les résultats montrent d’abord que les questionnaires mesurant les émotions morales expliquent mieux les comportements d’évasion que les autres questionnaires. En-suite, le pouvoir explicatif de ces traits de personnalité reste très modeste. Cette absence de relation forte suggère que les caractéristiques individuelles sont d’une aide limitée pour com-prendre et prévoir le comportement d’évasion fiscale. Cela met donc l’accent sur l’importance du contexte institutionnel dans lequel la soumission fiscale est mesurée. Les deuxième et troisième Chapitres tentent de mieux prendre en compte ce contexte institutionnel, en util-isant la psychologie sociale de l’engagement. Le second Chapitre montre que la modification de l’environnement du contribuable, à travers l’exposition à un serment sur l’honneur à dire la vérité, accroît le niveau d’honnêteté des déclarations fiscales qui lui font suite. Le troisième Chapitre tente d’expliquer la cause du phénomène suivant : la démocratie directe, comme présente dans certains cantons en Suisse, serait la source d’une plus grande soumission fiscale. D’après la littérature existante, sa cause pourrait être soit une coordination sociale entre les agents, soit un effet d’engagement du vote en lui-même. Les résultats montrent que la coor-dination sociale entre les contribuables ne permet pas d’expliquer ce phénomène, qui reflète plutôt un effet d’engagement de la participation au processus électoral.
Mots-clés: économie comportementale, psychologie économique, évasion fiscale, morale fiscale, moralité, personnalité, serment, engagement, vote, démocratie directe, dilemme social.
Abstract
This thesis in economics focuses on recent advances in psychology to extend the economic ap-proach to tax evasion. The essays build on empirical evidence from laboratory experiments. The first Chapter uses differential psychology and psychometrics to correlate tax evasion be-havior observed in the lab to individual personality traits, measured thanks to standardized psychometric questionnaires. These personality questionnaires are related to moral emotions, moral judgments and norm submission. The results are twofold. First, moral emotions better explain evasion behavior than any other personality questionnaire. However, secondly, the explanatory power of these personality traits remains very modest. This lack of a strong rela-tionship suggests that individual characteristics are of little help to understand and predict tax evasion behavior. It highlights the importance of the institutional context in which compliance is elicited. The second and third Chapters try to better account for this institutional context, using the social psychology of commitment. The second Chapter shows that a modification of the taxpayer’s environment, thanks to the exposition to an oath to tell the truth, increases the level of honesty of subsequent tax reports. Building on these results, the third Chapter inves-tigates the hypothesis that direct democracy, as present in some cantons in Switzerland, could be the source of higher tax compliance. According to the existing literature, its cause could be either social coordination between agents or a commitment effect due to the vote itself. The results show that social coordination between taxpayers does not explain this phenomenon, which rather reflects a commitment effect of participation in the electoral process.
Keywords: behavioral economics, economic psychology, tax evasion, tax morale, morality, personality, oath, commitment, voting, direct democracy, social dilemma.
Contents
Acknowledgments i
Résumé iv
Abstract vi
Contents viii
List of Figures xiv
List of Tables xvii
Introduction 1
0.1 The traditional economic analysis of tax evasion . . . 3
0.1.1 Economic analysis of crime . . . 3
0.1.2 Economic analysis of tax evasion . . . 4
0.1.3 An addition of Yitzhaki . . . 5
0.2 Methodological approach of conceiving a TEG . . . 6
0.2.1 Scrutiny of behavior and anonymity of participants . . . 7
0.2.2 Context of the experiment . . . 8
0.2.2.1 Neutral vs loaded frame . . . 9
0.2.2.2 On the way to ask for compliance . . . 10
0.2.2.3 Origin of income: earned vs windfall income . . . 10
0.2.2.4 Nature of income: self-employed vs salaried job . . . 12
0.2.2.5 Redistribution to participants . . . 13
0.2.2.6 Public good fund . . . 14
0.2.3 Size of stake . . . 15
0.2.4 Students are a valid pool of subjects . . . 16
0.2.5 Temporal limitation . . . 17
0.2.6 The decision task in a TEG is a valid measure of tax behavior . . . 18
0.3 The impact of traditional deterrent variables on lab tax compliance . . . 19
0.3.1 Tax rate . . . 19
0.3.2 Audit probability . . . 21
0.3.3 Fine size . . . 23
0.3.4 From traditional deterrent variables to non-monetary incentives to comply 24 0.4 Alternative sources of tax compliance . . . 26
0.4.1 Personality traits . . . 26
0.4.1.1 Definitions and examples . . . 26
0.4.1.2 When does personality vary? . . . 29
0.4.1.3 Does (stable) personality traits really exist? . . . 31
0.4.2 Context . . . 32
0.4.2.1 Framing . . . 32
0.4.2.2 Priming . . . 34
0.4.2.3 Commitment . . . 35
0.5 How are context and personality traits integrated into the analysis of tax evasion? 37 1 Does tax morale really exist? A psychometric investigation 39 1.1 Introduction . . . 39
1.2 Foundations of tax morale from moral psychology . . . 42
1.2.1 Morality and moral emotions . . . 43
1.2.2 Morality and moral judgment . . . 44
1.3 Experiment 1 . . . 44
1.3.1 Design of the experiment . . . 45
1.3.1.1 Psychometric measures of moral emotions . . . 46
1.3.1.2 Experimental procedure . . . 48
1.3.2 Results . . . 49
1.3.2.1 Compliance behavior and morality . . . 50
1.3.2.2 Multivariate analysis . . . 53
1.3.2.3 Using Principal Component Analysis to combine sub-scales . . . 55
1.4 Experiment 2 . . . 58
1.4.1 Design of the experiment . . . 59
1.4.1.1 Psychometric measures of moral judgments . . . 59
1.4.1.2 Experimental procedure . . . 61
1.4.2 Results . . . 62
1.4.2.1 Compliance behavior and morality . . . 63
1.4.2.2 Multivariate analysis . . . 64
1.4.2.3 Using Principal Component Analysis to combine sub-scales . . . 66
1.5 Conclusion . . . 67
2 Tax evasion under Oath 71 2.1 Introduction . . . 71
2.2 Fighting dishonesty with commitment . . . 73
2.3 Experiment 1 . . . 77
2.3.1 Design of the experiment . . . 77
2.3.2 Experimental treatment . . . 77
2.3.3 Experimental procedure . . . 78
2.4 Results . . . 79
2.4.1 Descriptive statistics . . . 79
2.4.2 Income declaration: the impact of individual variables . . . 80
2.4.3 Income declaration: the oath impact . . . 82
2.5 Experiment 2 . . . 83
2.5.1 Design of the experiment . . . 83
2.5.2 Experimental procedure . . . 84
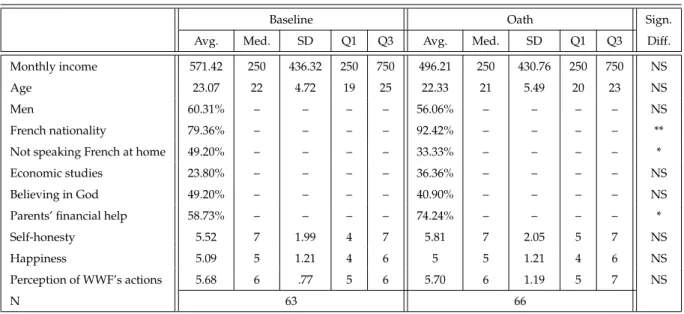
2.5.3 Descriptive statistics . . . 84
2.5.4 Income declaration: the oath impact . . . 85
2.5.5 Compliance under oath: light on the polarization effect . . . 87
2.6 Conclusion . . . 88
3 Disentangling commitment from social effect in a voting experiment on tax funds 91 3.1 Introduction . . . 91
3.2 Why should voting increase compliance? . . . 93
3.3 Design of the experiment . . . 95
3.3.1 Experimental protocol . . . 95
3.3.2 Avoiding selection effect . . . 96
3.3.3 Experimental treatments . . . 96
3.3.4 Experimental procedure . . . 98
3.4 Comparison of treatments and participants . . . 98
3.4.1 Participants are globally comparable between treatment . . . 100
3.4.2 Participants make the same decisions in each treatment . . . 100
3.5 Results . . . 102
3.5.1 Descriptive statistics . . . 102
3.5.2 Direct democracy effect disappears when taking into account the selection 102 3.5.3 A commitment effect is found but no social effect . . . 103
3.5.3.1 In the full sample . . . 104
3.5.3.2 In the truncated sample: keeping people who vary their decla-rations . . . 106
3.5.4 Are other variables influencing compliance? . . . 107
3.5.4.1 Questionnaires’ answers are rather different . . . 107
3.5.4.2 Perceived legitimacy, fairness and importance of the selection: their impact on compliance . . . 108
3.6 Conclusion . . . 108
Conclusion 112 Appendix 1: Chapters 1, 2 and 3 115 a Decision interface of Baseline . . . 115
b Instructions from Experiment 1 (Baseline/Oath) . . . 117
Appendix 2: Chapters 1 and 3 123 c Decision interface of Choice treatment . . . 123
d Instructions from Experiment 2 (Vote/Choice) . . . 124
Appendix 3: Chapter 1 132 e Description of the questionnaires used in Experiment 1 . . . 132
f Description of the questionnaires used in Experiment 2 . . . 133
g Additional statistics on Experiment 1 . . . 134
h Additional statistics on Experiment 2 . . . 140
i Questionnaires from Experiment 1: CAS, QCAE & GASP . . . 146
i.1 Questionnaire 1 – Concern for Appropriateness Scale . . . 146
i.2 Questionnaire 2 – Questionnaire of Cognitive and Affective Empathy . . 148
i.3 Questionnaire 3 – Guilt and Shame Proneness . . . 150
j Questionnaires from Experiment 2: EPQ, IS & MELS . . . 152
j.1 Questionnaire 1 – Ethics Position Questionnaire . . . 152
j.2 Questionnaire 2 – Integrity Scale . . . 154
j.3 Questionnaire 3 – Moralization of Everyday Life Scale . . . 156
Appendix 4: Chapter 2 159 k Experiment 1 . . . 159
k.1 Moral emotions questionnaires’ impact on compliance: the oath condition 162 l Experiment 2 . . . 166
l.1 Instructions from Experiment 2 (Baseline/Oath repeated) . . . 166
l.2 Decision interface of Experiment 2 . . . 172
l.3 Additional statistics on Experiment 2 . . . 173
Appendix 5: Chapter 3 174 m Decision interface of Vote treatment . . . 174
n Literature review on Voting experiments . . . 175
o Additional statistics on Experiment . . . 178
Résumé de la thèse 181 p Essais en Psychologie Economique du Comportement d’Evasion Fiscale . . . 181
p.1 Introduction . . . 181
p.2 L’analyse économique traditionnelle de l’évasion fiscale . . . 182
p.3 Le jeu d’évasion fiscal . . . 183
p.4 Apports de cette thèse . . . 185
p.5 Conclusion et recommandation . . . 187
Bibliography 188
List of Figures
1 Yearly number of published laboratory tax compliance experiments (Torgler, 2016) 2
2 Yearly number of field experiments on tax compliance (Torgler, 2016) . . . 2
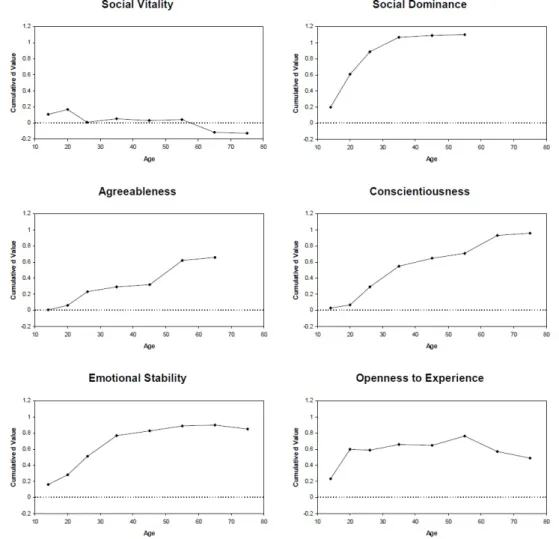
3 Cumulative Mean-Level Changes in Personality Across the Life Cycle (Almlund, Duckworth, Heckman, and Kautz, 2011) . . . 30
4 Different optical illusions where context deceives (Nicolas, Gyselinck, Vergilino-Perez, and Doré-Mazars, 2009) . . . 33
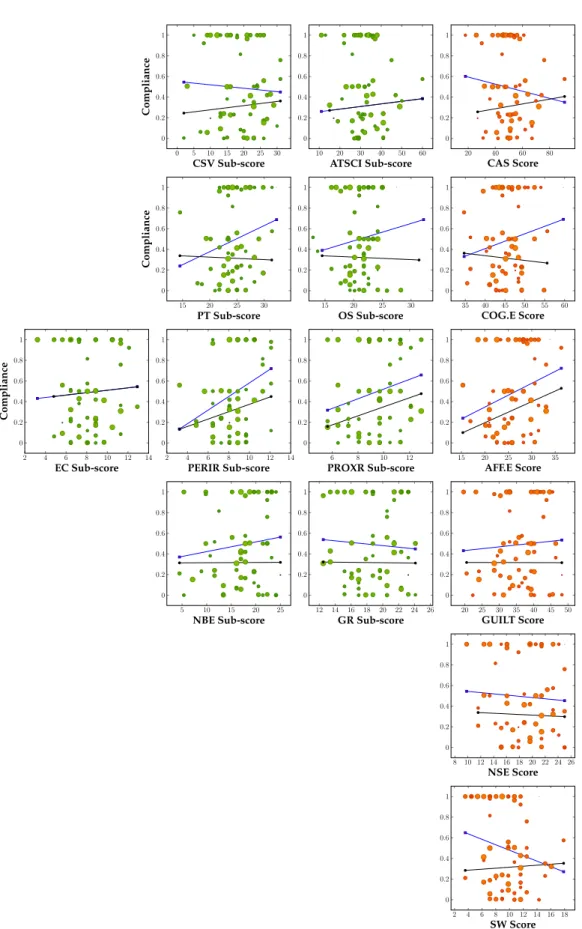
1.1 Compliance and psychometric scores in Experiment 1 – Univariate analysis . . . 51
1.2 Compliance and psychometric scores in Experiment 2 – Univariate analysis . . . 64
2.1 Oath to tell the truth . . . 78
2.2 Empirical distribution functions of compliance from Oath and Baseline conditions 86 3.1 Bar charts of the compliance for WWF and ASPAS with respect to the treatment and the selected organization on the full sample . . . 104
3.2 Screen-shot of the beginning of the task . . . 115
3.3 Screen-shot of the task during the sorting . . . 115
3.4 Screen-shot of the declaration for WWF . . . 116
3.5 Choice procedure of the selected organization . . . 123
3.6 Screen-shot of the declaration for WWF and ASPAS . . . 123
3.7 Earned and declared income in Experiment 1 . . . 134
3.8 Normalized personality scores in Experiment 1 . . . 134
3.9 Earned and declared (for WWF) income in Experiment 2 . . . 140
3.10 Normalized personality scores in Experiment 2 . . . 140
3.11 Histogram of the distribution of compliance across conditions . . . 159
3.12 Screen-shot of the 5th declaration . . . 172
3.13 Screen-shot of the 5 declarations . . . 172
3.14 Screen-shot of the random draw . . . 172
3.15 Empirical distribution function of the spread across conditions . . . 173
3.16 Vote procedure of the selected organization . . . 174
3.17 Earned and declared income for WWF . . . 178
3.18 Earned and declared incomee for ASPAS . . . 179
3.19 Bar charts of the compliance for WWF and ASPAS with respect to the treatment and the selected organization on the truncated sample . . . 179
List of Tables
1 The Big Five Traits . . . 28
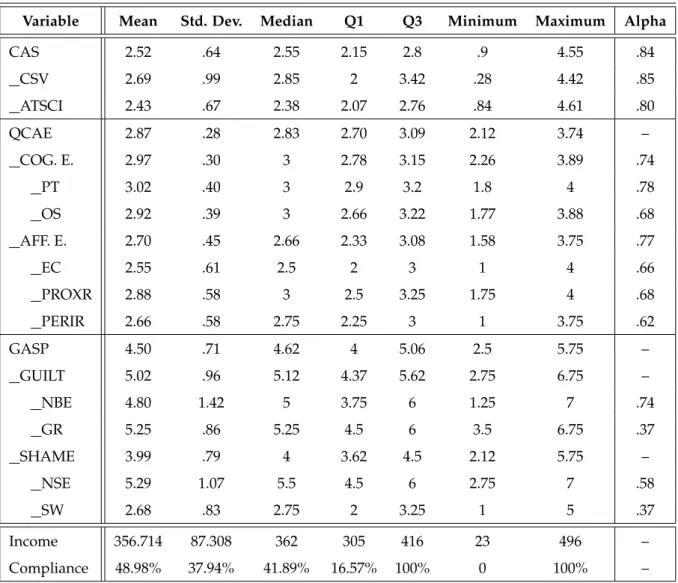
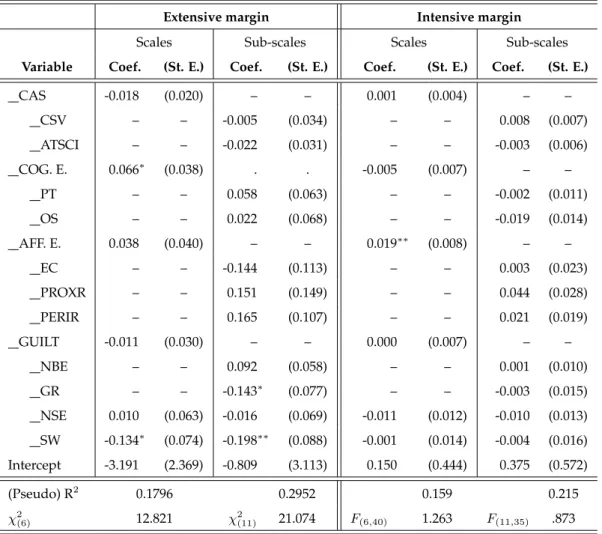
1.1 Summary statistics on compliance and psychometric measures in Experiment 1 . 49 1.2 Information on the slopes of Figure 1.1 . . . 52 1.3 Experiment 1: Multivariate regressions of compliance decisions on psychometric
scores . . . 54 1.4 Weights of each component in Experiment 1 (varimax rotation) . . . 55 1.5 Experiment 1: Multivariate regressions of compliance decisions on principal
components . . . 58 1.6 Summary statistics on compliance and psychometric measures in Experiment 2 . 62 1.7 Information on the slopes of Figure 1.2 . . . 64 1.8 Experiment 2: Multivariate regressions of compliance decisions on psychometric
scores . . . 65 1.9 Weights of each component in Experiment 2 (varimax rotation) . . . 66 1.10 Experiment 2: Multivariate regressions of compliance decisions on principal
components . . . 67
2.1 Summary statistics on individual covariates in Experiment 1 . . . 80 2.2 Experiment 1: Multiple regressions of compliance on socio-demographic
vari-ables and experimental measures . . . 81 2.3 Summary statistics on compliance in Experiment 1 . . . 83 2.4 Summary statistics on individual covariates in Experiment 2 . . . 85 2.5 Summary statistics on compliance in Experiment 2 . . . 86 2.6 Distribution of 5 identical declarations across type of declaration . . . 88
3.1 Summary statistics on individual covariates and compliance measures . . . 99
3.2 Statistical tests of differences on individual covariates and compliance measures 101 3.3 Summary statistics on compliance measures in full and truncated samples, with
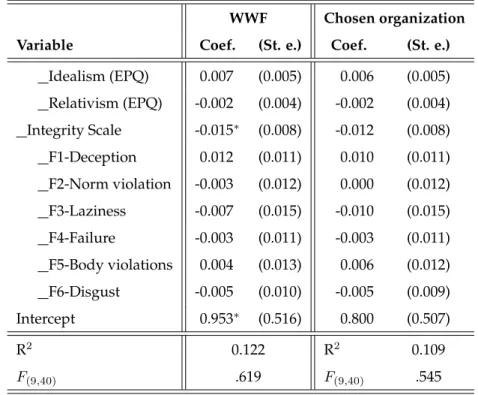
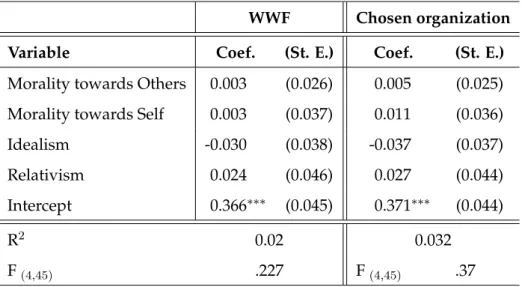
respect to the selected organization . . . 105 3.4 Multivariate regressions of compliance for WWF on importance, legitimacy and
fairness . . . 109 3.5 Principal components from the PCA and their eigenvalues in Experiment 1 . . . 135 3.6 Unrotated eigenvectors from the four principal components selected (>.30) in
Experiment 1 . . . 135 3.7 Oblique rotation (promax) (>.30) in Experiment 1 . . . 136 3.8 Heckman model on the raw scores of Experiment 1 . . . 137 3.9 Heckman model on the components of Experiment 1 . . . 138 3.10 Correlation matrix of the variables in Experiment 1 . . . 139 3.11 Principal components from the PCA and their eigenvalues in Experiment 2 . . . 141 3.12 Unrotated eigenvectors from the four principal components selected (>.30) in
Experiment 2 . . . 141 3.13 Oblique rotation (promax) (>.30) in Experiment 2 . . . 142 3.14 Correlation matrix of the variables in Experiment 2 . . . 142 3.15 Multivariate regressions of compliance (for ASPAS) decisions on psychometric
scores . . . 143 3.16 Heckman model on the raw scores of Experiment 2 . . . 144 3.17 Heckman model on the components of Experiment 2 . . . 145 3.18 Interaction effect between Oath and Self honesty . . . 160 3.19 Experiment 1: Multivariate regressions of compliance decisions on
socio-demographics variables, experimental measures and oath treatment . . . 161 3.20 Information on univariate correlations between compliance and moral emotions
questionnaires in Oath condition . . . 163 3.21 Experiment 1: Multivariate regressions of compliance decisions on psychometric
scores . . . 164 3.22 Interaction effect between Oath and Affective Empathy with its different
sub-scales . . . 165 3.23 Literature review on Voting experiments . . . 175 3.24 Multivariate regressions of compliance for WWF when considered the
treat-ments and the selected organization . . . 180
3.25 Multivariate regressions of compliance for ASPAS when considered alone, with the treatments and the selected organization . . . 180
Introduction
The issue of tax evasion is as old as tax itself (Andreoni, Erard, and Feinstein, 1998). Old Empires, as Babylon in the ancient Mesopotamia, were already experiencing such issue (Wil-davsky and Webber, 1986, p. 58). “Tax evasion is the crime of not declaring income to a tax authority” (Murphy, 2014). This difference between due and paid taxes is also known as the tax gap. It is directly linked to the shadow economy activity. This activity is protean (black market, paying “under the table” or working “off the books”) but globally shows the mere fact of producing an economic good or activity without being taxed by the state. In 2011, the total tax evasion is estimated to exceed 5.10% of the world GDP (3.1 trillion dollars) according to the Tax Justice Network.1 The size of the shadow economy is globally equal to 18.10% of the world GDP. It means that one dollar out of six in the world is tax free. This rate increases to one euro out of five in Europe, and one euro out of four in Greece or Italy. Tax evasion is a major problem as it deprives governments from public resources.
The discipline that studies tax evasion and compliance in the lab, behavioral public economics (sometimes referred to as behavioral public finance), is now an established subdiscipline of experimental economics. Research–and especially research in experimental economics– addressed quite early the problem of tax evasion. It will soon be 40 years since the publication of the first tax evasion game results, from Friedland, Maital, and Rutenberg (1978), in the Jour-nal of Public Economics.2As noted by Torgler (2016), the number of tax experiments increased steadily since the 90s for the laboratory tax experiments, and the increase is even more striking when considering the field tax experiments (see respectively Figure 1 and 2). Since the semi-nal work of Friedland, Maital, and Rutenberg (1978), the research on tax evasion has known
1This computation is the result of applying an average tax rate (28.10%) on the estimation of the total shadow
economy (11 trillion dollars) in the world (see Tax Justice Network from 11/2011).
2As a comparison, the first versions of ultimatum and dictator games–probably the most known and played
games in experimental economics–happened “only” in 1982 and 1986 (Güth, Schmittberger, and Schwarze, 1982; Kahneman, Knetsch, and Thaler, 1986).
2
Figure 1: Yearly number of published laboratory tax compliance experiments (Torgler, 2016)
Figure 2: Yearly number of field experiments on tax compliance (Torgler, 2016)
several changes for the past forty years..
This success of tax experiments has probably two main reasons. First, as it deprives govern-ments from resources, big interests are at stake in reducing tax evasion and attention has been focused on all the possible ways to do so, including experimental economics. Public adminis-tration thus financed behavioral research to find solutions to fight tax evasion or simply pro-vide a more taxpayer-friendly service. Second, there is a need for observable and reliable data about tax evasion, this kind of dishonest behaviors being by nature impossible or very complex to measure in the field (Muehlbacher and Kirchler, 2016). Tax evasion games have been used to substitute to field data and make experimentation possible. Selection bias on the available data makes it difficult to capture the bigger picture of tax evasion, field data only coming from evaders who are caught. Lab experiments also allow to isolate the causal inference of treat-ments, “whereas existing institutions are adopted endogenously” (Falk and Heckman, 2009, p. 536). For example, in real life, audits rates can be reinforced when evidences of an increased criminal
0.1 The traditional economic analysis of tax evasion 3
activity appear. Lastly, the lab allows to test many different institutions and observe directly the results in terms of compliance.3 Without the use of tax experiments, this would have been way more complex or impossible.
The present thesis is part of the behavioral public economics discipline. The discipline was first born to test the traditional economic model to account for tax evasion, inspired from the economics of crime models. However these models have rather failed to explain real life com-pliance. As a consequence, other sources of compliance–coming from behavioral economics and psychology–have been put forward to explain it. Two of these sources, individual person-ality of taxpayers and context in which taxpayers are inserted when filing, are studied here. It is done in the three following Chapters.
0.1
The traditional economic analysis of tax evasion
Since the 60s and the seminal contribution of Gary Becker, economics of crime is “part of the standard portfolio that makes up the discipline” (Machin and Marie, 2014 p. 7). Before the be-havioral approach, the traditional economic analysis of tax evasion was born and flourished first within economics of crime. The traditional economic analysis of tax evasion, passing by standard economics of crime, are presented here.
0.1.1 Economic analysis of crime
For the first time, Becker (1968) has put in evidence that crime behavior was not an “inevitable result of underlying social conditions” but rather coming from “individual choices influenced by per-ceived consequences” (Machin and Marie, 2014, p. 8). In other words, the decision to commit a crime is influenced by a tradeoff between an expected cost and an expected benefit. In this view, “the bad guys commit crime unless they are incapacitated, and the good guys are reliably law abiding” (Machin and Marie, 2014, p. 7/8).
In his model, Becker described the supply of offenses as an aggregation of individual func-tions, Oj, which depends on pj, the probability of conviction per offense, fj, the probability of
punishment per offense and uj, all the other influences. This is represented as:
0.1 The traditional economic analysis of tax evasion 4
Oj = Oj(pj, fj, uj) (1)
Naturally, as the probability of detection or the size of punishment (pj and fj) increase, the
number of offenses (O) decreases. But Becker went even deeper in its individual analysis and described the direct “utility expected from committing an offense” for j (Becker, 1974, p. 10) as:
EUj = pjUj(Yj− fj) + (1 − pj)Uj(Yj) (2)
Yj stands for the monetary and psychic income from committing an offense, Uj, for the utility
function and fj as the monetary equivalent of the punishment. Derivatives of EUj according
to pj and fj also revealed to be negative, i.e. that it is not interesting to commit a crime when
the probability of detection or the size of punishment were higher, “as long as the marginal utility of income was positive” (Becker, 1974, p. 10). This first model is the milestone of the traditional economic analysis of tax evasion.
0.1.2 Economic analysis of tax evasion
Inspired by Becker’s approach, Allingham and Sandmo have transferred it to the tax evasion decision (Allingham and Sandmo, 1972). The model captures the moment where the taxpayer decides “how much of his income should he report and how much should he evade” (Sandmo, 2005, p. 646).4
Let us denote W the gross income, t the proportional income tax rate and the amount of income evaded, E. The declared income is thus W −E. In the case where the taxpayers evade a portion of his income and is not detected by the tax administration, the net income is:
Y = W − t(W − E) = (1 − t)W + tE (3)
However if the tax administration discovers that he has evaded, the taxpayer has to pay a penalty, θ. In the original Allingham and Sandmo (1972) model, θ depends on the evaded
0.1 The traditional economic analysis of tax evasion 5
amount. In this case, his net income is:
Z = (1 − t)W + tE − θE = (1 − t)W − (θ − t)E (4)
A taxpayer’s utility is defined over two states of the world, depending on whether or not an audit occurs with the probability p and (1 − p). The amount of tax evaded is chosen so as to maximize his expected utility:
V = (1 − p)U (Y ) + pU (Z) (5)
U is assumed to be increasing and concave. The taxpayer is thus risk-averse. The amount of money evaded optimally is obtained while derivating Equation 5 according to E, leading to the subsequent first-order condition:
U0(Z) U0(Y ) =
(1 − p)t
p(θ − t) (6)
Standard interpretation is that the taxpayer is willing to evade one marginal unit of income if and only if, the expected gain ((1 − p)t) is higher than the expected cost (p(θ−t)).
If the parameters (θ, p, W and t) change, the optimal amount of money evaded also changes. Signs of the derivatives according to θ and p are both negatives: higher penalty and probabil-ity of detection rates unambiguously increase compliance. Concerning W , the gross income, authors made the common assumption that the measure of absolute risk aversion is decreas-ing. It leads to think that, as people get richer, they will engage in riskier activities. However t has an ambiguous effect because it is constituted of two sub effects: the negative income effect (when t increases, people are poorer and take less risks) and a positive substitution effect. This ambiguity has been deleted by the work of Yitzhaki (1974).
0.1.3 An addition of Yitzhaki
According to Yitzhaki (1974), the last result on the ambiguous effect of t depended on the “assumption that the penalty is imposed on the amount of income evaded” (Sandmo, 2005, p. 647). If
0.2 Methodological approach of conceiving a TEG 6
the penalty is rather imposed on the evaded tax (as e.g. in the American or Israeli system), the penalty would be θtE with θ > 1. Under this assumption, equation 4 would become:
Z = (1 − t)W − (θ − 1)tE (7)
In this model, only the negative income effect remains. It would mean that increasing the tax rate induces people to comply more. Sandmo (2005) underlines that this addition, even though it deletes the ambiguity from the original model, concludes on a quite counter intuitive relationship between tax rate and compliance.
Works of Allingham and Sandmo (1972) and Yitzhaki (1974) (well often referred globally as the Allingham-Sandmo-Yitzhaki model) are the milestone in theoretical understanding of tax evasion decision. It has now been extended in a various number of ways (see e.g. Hashimzade, Myles, and Tran-Nam, 2013 for an application of behavioral approaches to tax evasion).
0.2
Methodological approach of conceiving a TEG
The experimental approach has been developed on tax evasion originally to test the previ-ous cited models and observe if people reacted as models predicted. Tax evasion games were more and more numerous to be organized and they considerably expanded their scopes. Even though they started as a tool to test models, they finally became a way to produce scientific knowledge in itself.
Therefore, the open challenge was to find the way to relate behavior observed in the lab to the behavior observed in real life. It is the question of internal validity (“how to build an experiment such that observed behavior can be related to the institutions under study”, Jacquemet and L’Haridon, 2017, p. 35). TEG should be designed carefully to represent the tax decision of participants. The core game is usually as follow: participants get an income and are asked to declare it, knowing that declared income will be taxed according to a common knowledge tax rate.5
However there is always a tradeoff between improving the internal validity of TEG (i.e. copy-ing real life parameters) and threatencopy-ing the external validity (i.e. until what extent results
5This is a general description of a TEG. The description of the experimental designs of this thesis takes place in
0.2 Methodological approach of conceiving a TEG 7
obtained from TEG can be generalized). External validity teaches about “what do decisions taken in the artificial framework of a laboratory tell us about real life” (Jacquemet and L’Haridon, 2017, p. 35). The most prominent criticisms on external validity of economic experiments–and in-directly of TEG–are probably coming from Levitt and List (2007). Attention is focused here on answering each particular criticisms: scrutiny of participants’ behaviors, lack of anonymity, framing of lab decisions, size of stakes, selection into experiment (pool of subjects), temporal limitation and limited range of decisions of experiments. Critics and answers are organized in the original order from Levitt and List (2007). Main answers have already been provided in Torgler (2002); Bloomquist (2009), Alm, Bloomquist, and McKee (2015) and Muehlbacher and Kirchler (2016).
0.2.1 Scrutiny of behavior and anonymity of participants
Laboratory experiments involve a different relationship between participants and experi-menter, compared to the field. Participants know that their behaviors will be under great scrutiny in the lab, and they also know that their anonymity is not totally insured.
To illustrate the latter, List (2006) has presented the very well-known baseball cards traders experiment. In a lab experiment, baseball cards traders rewarded, as in a gift exchange game, higher prices with higher quality cards. However in the field, when the baseball card sellers were not scrutinized, this relationship between quality and prices did not exist anymore. Pro-social behaviors would be exaggerated in the lab compared to the field. It would translate in producing less evasion in TEG, compared to the field. To answer this concern, Bloomquist (2009) first of all underlined that it is not sure “that subjects perceive a heightened sense of scrutiny in the lab versus outside the lab” (p. 118). It is especially true when the rather high compliance rates in the field are compared to the rather low lab compliance rates. Moreover in real life, unless cash transactions off the desk, taxpayers know that tax administration fights against tax evasion and audits some taxpayers each years. Real taxpayers, as participants from TEG, are already scrutinized, even though not as much.
The latter is illustrated using List, Berrens, Bohara, and Kerkvliet (2004) article: the less a pub-lic good game is anonymous (using a randomized response technique), the more participants contribute. Knowing that someone observes you should make you less willing to cheat in a
0.2 Methodological approach of conceiving a TEG 8
TEG. However first of all, “double blind” procedures–procedures that ensure full anonymity of participants–can be used to limit this effect. Secondly, Bloomquist (2009) also highlights that all TEG do not automatically possess a public good. Third, once again, no one remains anonymous towards tax administration.
To sum up, the problem of scrutiny of behavior is disputable when it comes to the TEG, es-pecially because taxpayers are considered to be already scrutinized. Anonymity of taxpayers is also not ensured in real life. This problem could also be easily countered by using “double blind” procedures.
0.2.2 Context of the experiment
Context of the experiment can be varied in 3 ways: framing, earned vs windfall income and use of collected taxes. Each part–and its threat for the external validity of the TEG–is reviewed here.
The instructions given to participants in a TEG can possibly challenge the generalizability of the compliance rates found. It can be tax framed or neutral. A tax frame designates the use of such words: income, tax rate, audit instead of earnings, withholding rate, check. Ways of asking for compliance can be very directive or quite relaxed.
Income can be donated or earned by the participants themselves. Most of the time, earned income was implemented through a real effort task or, less commonly, using hypothetical effort (i.e. making participants believe that there was a strong selection and that they have been the very best). It was first assumed that effort invested to earn an income would make participants less willing to be taxed, thus decreased tax compliance (via sunk cost effect or simply feeling of property). However the reverse effect can also be hypothesized: effort invested can also increase risk averse decisions, participants could not wish to risk their hard earned income (reverse sunk cost effect), see Durham, Manly, and Ritsema (2014) to learn more about these effects. The nature of income, coming from a salaried job or from self-employment, implies a difference in the detection probability since income from employed workers are self-declared. This problem was also investigated experimentally below.
0.2 Methodological approach of conceiving a TEG 9
be kept by the experimenter to reduce the cost of the experiment (thus considered as burned for the taxpayers, as in Fortin, Lacroix, and Villeval, 2007), redistributed to participants, with or without a social multiplier–as a public good game with a marginal per capita return–, or donated to finance a real life public good.
0.2.2.1 Neutral vs loaded frame
Some experiments showed that framing influences participants’ behaviors. Among them, Baldry (1986) studied behaviors in two experiments where participants played a framed TEG and others played an equivalent game (a gamble) that was not framed. The results show that participants behaved differently, those from the framed experiment evading less. In Webley and Halstead (1986), authors made participants playing a TEG presented as an “economic game” and debriefed them afterward. The results show that most subjects saw the experi-ment as a game, and that they would not behave in the same way in real tax setting. Authors investigated this point and ran another session where participants were told to participate in an “economic problem”. In this session, participants which instructions were framed as an eco-nomic problem have maximized their income more and under-declared more. Wartick, Madeo, and Vines (1999) also found that participants playing a TEG with framed instructions evaded less income and that older subjects (25 years old and more) complied even more than younger subjects (less than 25). It was concordant with what Mittone (2006) has found when comparing a TEG and an equivalent gamble: participants indeed evaded less under tax framing. Trivedi and Chung (2006) showed that there was also no difference between tax terminology and non-tax terminology in a TEG when income was low. However there was an effect of context when incomes were medium or high: participants evaded less under tax framing. Choo, Fonseca, and Myles (2015) also showed that tax frame could be of some importance, especially on non-students who evaded less when the experiment was framed. Two experiments that were not TEG can be also interesting. First, King and Sheffrin (2002) showed in a scenario-based survey, that subjects were reluctant to evade taxes even when using frames to stress the unfairness of the tax regimes. Second, in Jacobsen and Piovesan (2015), participants played a dice-under-cup experiment where they could earn money. When the instructions were tax framed, participants reported higher level of income compared to when it was not.
0.2 Methodological approach of conceiving a TEG 10
wording did not change behavior in a TEG. Wartick, Madeo, and Vines (1999) and Durham, Manly, and Ritsema (2014) also made reference to an experiment ran by Swenson (1996) where “experimental markets were created in the laboratory where buyers receive tax credit for purchasing a commodity” (Wartick, Madeo, and Vines, 1999, p. 23). The results show that there was no difference using framing or not. Durham, Manly, and Ritsema (2014) also showed that overall context did not matter in tax evasion, however it could have a joint effect with income source and income level, or with income source and time.
There is no automatic effect of context/framing overall, but it can have an effect regarding socio and demographic variables, income source or income level. When an effect of context exists, it goes almost anytime in increasing compliance. This effect can be related to social norms, pushing towards more compliance: it is socially accepted to pay taxes.
0.2.2.2 On the way to ask for compliance
Of importance is also the way to ask for compliance in the TEG. As quoted by Cadsby, Maynes, and Trivedi (2006), many experiments communicated to participants that they “may report any amount of income from zero up to the amount they actually earned or received” (p. 944). This sen-tence can be interpreted as a subtle invitation to gamble. To investigate this effect, Cadsby, Maynes, and Trivedi (2006) ran a non-framed experiment where they underlined the impor-tance of declaring the full amount of income earned. In almost all of their treatments, a huge majority of subjects chose to report 100% of their income.
Framing of TEG also matters in the instructions given to the participants. The way to ask for compliance induces participants to over report or under report and the instructions should be carefully designed on this point.
0.2.2.3 Origin of income: earned vs windfall income
Few experiments investigated the origin of income. Amongst them, there are first the exper-iments that compare earned vs endowed amount of money. A first framed TEG showed that people who earned money (through 1 hour of multiplication) were evading as much taxes as people endowed with money. However when the tax rate increased, participants with earned
0.2 Methodological approach of conceiving a TEG 11
income increased their compliance and participants with endowed income decreased their compliance (Boylan and Sprinkle, 2001). In Boylan (2010), participants of a neutral TEG were either endowed with income or earned an income (30 minutes of multiplication). The results show that compliance was higher for participants earning an income in the first rounds before an audit. Rounds after rounds, participants with earned money decreased their compliance while it was the reverse for those with endowed money. After an audit, these behaviors were even more polarized. In Durham, Manly, and Ritsema (2014), participants had to participate in a double auction market at the beginning of each round to earn an income. In the other con-dition, they were randomly given the same incomes. The results show that origin of income had no impact on tax evasion. It also had no impact coupled with context. However it had a negative impact within subjects across time, when coupled with the period on one hand, and when coupled with income level and context on the other hand. Peliova (2015) set a TEG with windfall vs earned income. Author observed less income declared in the first case (36.77%) compared to the second one (31.93%). An interesting result was that participants’ gender was a visible factor. Men (women) declared 10.72% (47.50%) of their windfall income and 26.92% (37.25%) of their earned income.
Other studies featured different level of difficulty to earn an income and compared it to en-dowed income. In the framed TEG of Kirchler, Muehlbacher, Hoelzl, and Webley (2009), there were 3 hypothetical efforts levels (no effort, low effort and high effort). In their first and sec-ond experiments, participants in low effort csec-ondition in average evaded more income than the others. In Bühren and Kundt (2013), participants earned money through high effort (difficult and long counting of ones and zeros in boxes filled with digits), moderate effort (less difficult and long same task) or no effort (windfall endowment). Results proved that moderate effort income was least likely to be evaded as opposed to high effort or endowed income.
To conclude, there are no clear results of the origin of income on tax compliance decisions. There are interactions effects with audit, tax rate, context, income level or periods, gender and hypothetical vs real effort setting. More research is needed to understand how these parameters interact.
0.2 Methodological approach of conceiving a TEG 12
0.2.2.4 Nature of income: self-employed vs salaried job
After deciding if subjects of a TEG earned or were endowed with an income, experimenters can also propose to subjects to choose between an income where they have the opportunity to cheat (self-employed) and one in which they cannot (salaried), so as to reveal participants’ preferences.
In Gërxhani and Schram (2006), participants chose first between unregistered (self-employed) and registered (salaried) income. They then draw randomly within one of these sets, an income. Registered income have a high average and a low standard deviation and unregistered income have a lower average and a higher standard deviation. The registered income was audited for sure. The unregistered income was audited with the probabilities 0%, 16.67% or 50%. The results show that participants who chose a registered income declared truthfully their income. Participants chose more often an unregistered income when tax evasion was possible. However all participants who chose an unregistered income did not cheat. In Alm, Deskins, and McKee (2009), participants earned an income and this income was divided in a “matched” income and “non-matched” income. The probability of detecting matched income was 100%. The probability of detecting non-matched income varied across treatments between 25% to 75%. Thus, non-matched income came from self-employment. Overall subjects did not declare all of their non-matched income. No connection could be made between percent of income received as non-matched income and compliance. There was a slight downward trend but compliance was at the highest when participants received half of their income as non-matched income. Elaborating on the example of Gërxhani and Schram (2006), Lefebvre, Pestieau, Riedl, and Villeval (2015) decided to make participants chose between a registered and an unregistered income. A lottery drew the amount of gross income effectively perceived by the participant, across a set of possible incomes. Unregistered income had the highest standard deviation and registered income, the lowest. The registered income was automatically taxed. People with unregistered income had first to choose between reporting or not, and then decided of the amount to report. The results show that 60.64% of participants chose an unregistered income and among them, 40.65% chose to evade a portion of their income.
When income comes from a salaried job and has 100% chances of getting audited, participants declare their income more truthfully, in comparison to when they have an unregistered income. Unregistered income is rather successful: participants choose more often an unregistered
in-0.2 Methodological approach of conceiving a TEG 13
come when it is available. As unregistered income is expected to be lower when fully taxed, it reveals some intentions to cheat. However it does not lead automatically to more evasion. Therefore people like to keep an opportunity to cheat.
0.2.2.5 Redistribution to participants
There is two ways to use collected taxes in a TEG. The first case studied is when collected taxes are redistributed to participants. In Becker, Büchner, and Sleeking (1987), different rates of transfer share of taxes collected were implemented (0.60%, 1.20%, 1.80% in one condition and 1.70%, 3.40% and 5.10% in one other condition). The results show that the amount of public money received by participants impacted negatively their decision to evade taxes. However this relation was not significant with regard to the amount of taxes evaded. In Alm, Jackson, and McKee (1992a), the compliance rate raised from 26.20% to 55.70% when money was placed in a group fund, multiplied by two and shared equally among the taxpayers. With a similar treatment, Alm, Jackson, and McKee (1992b) observed a raise in compliance from 33.20% to 37.40%, but only in a weakly significant way. Alm, McClelland, and Schulze (1992) showed that the higher the multiplier of the fund, the higher the compliance rate. Compliance rates were: 43.50%, 53.70%, 59.20% with multipliers equal to, respectively, 0, 2 and 6. Increasing the social multiplier increased the compliance but at a decreasing rate. Alm, Sanchez, and De Juan (1995) have investigated the impact of redistribution of the tax fund, but also the composition of the group. In one condition, tax fund was redistributed for a certain number of rounds to a fixed group, in the second condition, tax fund was redistributed to a group whose members turned over. In these two conditions, the social multiplier was equal to 2. These conditions were compared to others without a tax fund. There were no differences between the status of the members of the group that was getting the tax fund (compliance with fixed members: 27.80%, compliance with variable members: 26.60%). The results also show that in this ex-periment, taxpayers in sessions with a tax fund only marginally increased their compliance (compliance in average of 25% in control condition). Bosco and Mittone (1997) implemented a TEG where taxes were partially redistributed. The results show that without redistribution, 80% of participants evaded. With redistribution, this rate decreased to 46.70%. The presence of redistribution decreased the decision to evade and the amount of money evaded. In Alm, Mc-Clelland, and Schulze (1999), when the social multiplier was 1/2, compliance was 14%. When the social multiplier increased up to 2, compliance also increased to 44%. Park and Hyun (2003)
0.2 Methodological approach of conceiving a TEG 14
set a TEG where tax fund was redistributed to participants in one condition compared to when it was not. The results show that the presence of a public good had a significant negative im-pact on tax compliance. Torgler (2003) compared real taxpayers in two conditions: one with redistribution of taxes collected and one without. The social multiplier was set to 2. The results show that with redistribution, taxpayers increased their declaration from 57.50% to 85% of their income. In Gërxhani and Schram (2006), authors ran sessions with or without a redistribution of taxes collected for participants, with a social multiplier equal to 1. The results show that with a public good, participants chose more often a registered income, but it did not overall significantly decrease tax evasion.
To sum up, as proven by Blackwell (2007), redistribution has a strong positive impact on com-pliance, that increases with the size of the social multiplier. Papers showing this result are numerous, even though this effect is not automatic. However it is not the only use of collected tax that has been considered..
0.2.2.6 Public good fund
The second case studied is when taxes fund a real life public good. Mittone (2006) has com-pared compliance rates under three conditions: money was burned in the baseline, or people got the amount of tax collected back via redistribution (without any social multiplier men-tioned), or tax were used to invest in a real-world public good (a scholarship). Evasion rates (measured as the average percentage of acts of evasion) were: higher in the baseline (52.83%), lower with the investment in a public good (39.72%) and even lower in the redistribution condi-tion (27.72%). However in Masclet, Montmarquette, and Viennot-Briot (2013), the results show that there were no differences across the two following conditions: when participants’ taxes were invested in the purchase of carbon offset credit to counter greenhouse effect and when participants’ taxes were burned.
The question of the choice of the real life public good is also important. The more participants supported the organization that would get the tax collected, the more participants complied (Alm, Jackson, and McKee, 1993). Indeed, when students have to comply for two organiza-tions, the favorite one (about student support) and a least favorite one (university support), the favorite one got more tax funding than the other. The results also show that having the possi-bility to vote (or signal preference) on the preferred tax recipient increases compliance in Alm,
0.2 Methodological approach of conceiving a TEG 15
Jackson, and McKee (1993); Wahl, Muehlbacher, and Kirchler (2010); Lamberton, De Neve, and Norton (2014). Alm, McClelland, and Schulze (1999) also showed that participants vote accord-ing to their own interests with respect to the tax fund parameter. When the social multiplier was high, they voted in favor of a tax rate increase, and against when the social multiplier was low.
But what was the difference between redistribution to participants and donation on tax compli-ance? The only paper investigating this effect is from Doerrenberg (2015). Tax fund was either equally distributed between participants, invested in a research fund, donated to Red Cross or transferred to the German federal budget. The results show that compliance rates were re-spectively 30.22%, 42.52%, 40.87% and 34.94%. Even though tax compliance was higher when money was donated for research or charity purpose, these differences were not significant.
An alternative to redistribution is to donate the tax fund to real life public goods. It is interest-ing to underline that even in the case where no direct counterparts are given to the participants, e.g. when the social multiplier is 0 or when money is donated to a real life public good, the com-pliance is never 0. The results have not yet been set concerning the difference between donation and redistribution: which one performs better? Last but not least, when participants have the possibility to choose the destination of the donation, compliance increased (a phenomenon known as the direct democracy effect).
0.2.3 Size of stake
In experiments, the size of the stakes are most of the time rather low and constant. Partici-pants are remunerated for their time often less than 20 e per hour. Some rare experiments, such as Andersen, Ertaç, Gneezy, Hoffman, and List (2011) showed that raising the stake of the experiment (up to one year of income) induced very strong differences of proposals in a ultimatum game. It is obvious that TEG have nothing to do with real life earnings in terms of amounts. Bloomquist (2009) addressed this issue, using field data from the IRS, taxpayers were Schedule C filers subjected to IRS random audits, a subset of the Internal Revenue Service’s National Research Program from 2001. Looking at the behavior of real taxpayers, the idea was to look for stake effects in the distribution of mean reporting rates across ranges of income. “If self-interested behavior increases with the size of stakes, then we should expect to see less compliance
0.2 Methodological approach of conceiving a TEG 16
as income increases” (Bloomquist, 2009, p. 119). The results show that compliance rates do not increase linearly with the income level (from 0 to more than 50,000 $). Looking for stake size in TEG is thus pointless when real life data does not demonstrate such effects.
0.2.4 Students are a valid pool of subjects
Another threat to the external validity of TEG and experiments in general, is that university students are well often invited as subjects. However it is the compliance behavior of taxpayers that researchers want to study. As introduced in Jacquemet and L’Haridon (2017), this threat is worrying only if “(i) real-world economic agents are not university students, and (ii) there are reasons to believe that students behaviour is likely to be different from the [taxpayer] population” (p. 380). There is to worry only if these two points are met.
The first point is indeed valid. Students are not representative of taxpayers. Their social and demographics characteristics are well often different from those of the taxpayers’ population (Alm, Bloomquist, and McKee, 2015). Students also have little to no experience of tax returns filing: e.g. in France they most of the time do not declare their own income and are on their parents’ tax return.6
The second point could also be valid. To address it, some experiments vary their pools of sub-jects. Gërxhani and Schram (2006) made different pools of participants play a TEG. They were high school students, university students, high school teachers, nonacademic university staff and academic staff. Authors did this experiment in Albania and in the Netherlands. The results show that tax evasion rates were higher for students compared to teachers. Alm, Bloomquist, and McKee (2015) proposed an experiment where participants were university students or uni-versity staff and faculty. Authors also varied different parameters in the TEG: audit, informa-tion, benefits etc. The results show that students complied differently from staff members. However across the different treatments, changes of compliance rates went in the same direc-tions for both pools of subjects. In Choo, Fonseca, and Myles (2015), 520 individuals played a framed TEG in the first experiment, including 200 students with no prior experience of tax, 200 company employees who declared taxes directly through their company (declaration for salaried employees) and 120 self-employed taxpayers who declared themselves their incomes. Experimenters tested different set of fines and audit probabilities. The results show that there
0.2 Methodological approach of conceiving a TEG 17
were indeed differences in compliance across groups: students were the least compliant par-ticipants compared to company employees and self-employed taxpayers. However students were more responsive to treatment changes compared to other groups, they complied less after an audit. Removing the tax frame of the experiment, i.e. making it a gamble, suppressed the difference across groups of participants. Norms of compliance from outside the lab were sup-posed to be at the origin of the enhanced compliance observed for non-students participants.
To conclude on the differences coming from the pools of subjects, student and non-student participants are different and they can behave differently (with students being less compliant). This difference could come from a norm from outside the lab and disappears outside the tax frame (Jacquemet and L’Haridon, 2017 already show the impact of experience on lab behavior). It could also come from the fact that real taxpayers benefit from a public good, in real life. This dimension is not taken into account when comparing taxpayers to students, and could explain differences of compliance. Another explanation could come from the difference between social and demographic variable: students can be poorer, younger etc. than real taxpayers. However tax evasion experiments are valuable because changes of students’ behavior are the same, com-pared to non-students. Students sample may be like “fruit flies to the geneticist” (Ashton and Kramer, 1980, p. 13), the first step to generalize a lab experiment to other samples, or to a field experiment. Students are thus a valid pool of subjects for TEG.
0.2.5 Temporal limitation
Muehlbacher and Kirchler (2016) already underlined the temporal problem of compliance: in real life, Austrian taxpayers can know after up to 7 years if their tax declaration is being au-dited. It could lead to a discount of the future fine, or a major stress while waiting for a possible audit. Only three papers studied the impact of temporal distance between the tax declaration and the audit. Muehlbacher, Mittone, Kastlunger, and Kirchler (2012) made participants play a one-shot TEG in which audit results were announced immediately or after three weeks. The results show that immediate feedback provoked higher evasion. Kogler, Mittone, and Kirchler (2016) confirmed this result in a TEG with immediate/non-immediate feedback and repeated periods. However Cadsby, Maynes, and Trivedi (2006) let participants in a TEG think about their tax declarations for one week before filing and it led to the reverse, i.e. tax compliance rates were lower.
0.2 Methodological approach of conceiving a TEG 18
Time seems to have different impacts: when participants know that they will have to await a possible audit, they comply more. However when they have more time to declare, they tend to evade more. Even though more evidence should be needed on this point, temporal aspect seems indeed to be a limit on the external validity of TEG.
0.2.6 The decision task in a TEG is a valid measure of tax behavior
Another important criticism towards tax evasion games (as there are against experimental eco-nomics in general) is that one can wonder if the experiments are really revealing of behaviors in the field. In an experiment, choice set is reduced. To illustrate this, in Lazear, Malmendier, and Weber (2012), participants could opt out from a dictator game and it led to significant different sharing rates.
This question is addressed in an analysis done by Bloomquist (2009) and republished in Alm, Bloomquist, and McKee (2015). The aim of the study was to compare reporting behavior from a group of US taxpayers and participants from different tax evasion experiments. Again, tax-payers were Schedule C filers subjected to IRS random audits. The results show similarities in behaviors. In the field, the mean compliance rate was about 31.30% for an audit probability of 1.72%, compared to 28.80% (or 40.40%) compliance when the audit was 0% (or 5%) in the lab. The results show that the distributions of compliance were also similar: both adopted a bi-modal distribution, with the first mode being 0% of compliance and the second one being 100% compliance. Authors also noted that they observed approximately equal shares of fully compliant individuals in both settings. These similarities were being observed when scrutiny, anonymity, context, size of stakes, pool of participants, individual characteristics, time were significantly different.
To conclude on the criticisms of TEG, when compared to the appropriate data, compliance rates obtained in the lab are globally equivalent to those observed in the field, whatever the framing, size of stake and pool of subjects. Therefore Levitt and List (2007) criticisms are not fully righteous, when applied to the external validity of TEG.
0.3 The impact of traditional deterrent variables on lab tax compliance 19
0.3
The impact of traditional deterrent variables on lab tax
compli-ance
It has been shown previously the elements to take into account to produce a valid tax evasion game, and what do these elements produce in terms of compliance. We have also seen pre-viously that the Allingham and Sandmo model predicted that: audit probability, size of fine should increase tax compliance and tax rate should have an ambiguous impact on tax compli-ance. Yitzhaki’s addition predicted that tax rate should have a negative impact on tax evasion. This Section puts theory to the test of experimental practice, it describes below the impact of the traditional deterrent variables–tax rate, audit probability, size of fine–in incentivized TEG.
0.3.1 Tax rate
As in the Allingham and Sandmo (1972) model, only TEG using flat tax rate are mentioned here. Existing evidence is inconclusive. The effect of tax rate on lab tax compliance is rather ambiguous. The amount of papers collected here is separated in two paragraphs: first, the papers showing a negative effect of tax rate on compliance. Second, the papers having reversed, mixed or no effects.
Friedland, Maital, and Rutenberg (1978) considered two tax rates: 25% and 50%. When the tax rate was 25%, the proportion of income declared was 87%. When the tax rate was about 50%, the proportion of income declared was 66%. In Baldry (1987), an increase in the marginal tax rate increased also participants’ evasion. In Collins and Plumlee (1991), tax rate was set to 30% or 60%. The results show that when tax rate was high, evasion was higher. In the experiment by Alm, Jackson, and McKee (1992b), the tax rates were 10%, 30% and 50%, leading to average compliance rate equal to 37.60%, 33.20% and 20%. Park and Hyun (2003) varied tax rates in their TEG from 10% to 40%. The results show that increasing tax rate had a significant negative impact on tax compliance. Alm, Deskins, and McKee (2009) also varied tax rate from 35 to 50% in their TEG and showed that it decreased compliance by 11.60 points. The most comprehen-sive study on tax rate is probably from Bernasconi, Corazzini, and Seri (2014) where authors compared two tax rates (27% vs 38%) across different treatments and showed that higher tax rate indeed reduced compliance. In Duch and Solaz (2015), there were different tax rates: 10%, 20% and 30%. In the baseline, the results show that high taxes really deterred compliance.
Pe-0.3 The impact of traditional deterrent variables on lab tax compliance 20
liova (2015) ran a TEG where tax rates varied from 10% to 40% with increments of 10%. With 20% audit rate, compliance decreased linearly from 62.83% till 45.83% at 30%, where it did not decrease anymore after. With a 5% audit rate, there was a U-shaped relationship between tax rates and evasion: compliance was decreasing from 45.86% at 10% tax rate to 22%, for a 20% and 30% tax rate, then increasing to 29% for a 40% tax rate. In an hypothetical TEG set by Murakami and Taguchi (2015), a tax rate of 30% corresponded to a compliance rate of 80.30%. A 10% increase in the tax rate marginally but significantly increased the compliance rate at 81.46%.
Second, the papers showing mixed or no effects of tax rate on compliance are mentioned here. In Becker, Büchner, and Sleeking (1987), three tax rates were used on earned income: 33.33%, 50% and 66.66%. The results show that participants considering their tax burden as high, were less prone to decide to evade. The amount of income evaded was not correlated with the perceived tax burden. Beck, Davis, and Jung (1991) set a TEG with different tax rates: 25% and 50%. Increasing tax rate in this experiment did not lead to increased compliance. In Alm, Sanchez, and De Juan (1995), tax rates were varied across treatments in the following way: 10%, 30% and 50%. The results show that increasing tax rate increased compliance. Compliance rates were respectively of 14%, 24% and 31%. In the pre-vote rounds of Alm, McClelland, and Schulze (1999), the results show that the effects of tax rate on compliance were negligible, going from 28% compliance at 20% tax rate to 29% compliance at 50% tax rate. In Boylan and Sprinkle (2001), tax rate was either 20% or 40%. When incomes were endowed, doubling the tax rate decreased declaration from 61.50% to 55.30%. When incomes were earned, doubling the tax rate increased declaration from 48% to 68.70%. The results show that there were no effects of sole tax rate, but an interaction effects between nature of income and tax rates. In Fortin, Lacroix, and Villeval (2007), authors varied the tax rate from 5% to 70%. Their results show a U-shaped relationships with compliance: higher tax rates decreased compliance up to a 39% tax, but raised compliance afterward.
To sum up, the impact of the tax rate on tax evasion is not clear. Blackwell (2007) showed in a meta-analysis on 20 experimental articles that increasing the tax rate had a positive–but non-significant–impact on compliance. Andreoni, Erard, and Feinstein (1998) concluded on this topic that “the effect of tax rates on evasion remains unclear" and "given the importance of this topic, it surely deserves further investigation” (p. 839). In this literature review focusing on flat tax rate only, the tax rate seems to deter compliance when it increases. However a quite high number of