HAL Id: tel-02806552
https://hal.inrae.fr/tel-02806552
Submitted on 6 Jun 2020
HAL is a multi-disciplinary open access archive for the deposit and dissemination of sci-entific research documents, whether they are pub-lished or not. The documents may come from teaching and research institutions in France or abroad, or from public or private research centers.
L’archive ouverte pluridisciplinaire HAL, est destinée au dépôt et à la diffusion de documents scientifiques de niveau recherche, publiés ou non, émanant des établissements d’enseignement et de recherche français ou étrangers, des laboratoires publics ou privés.
Genetic response of tree population to spatial climatic
variation : an experimental genomic and simulation
approach in Fagus sylvatica populations along altitudinal
gradients
Hadrien Lalagüe
To cite this version:
Hadrien Lalagüe. Genetic response of tree population to spatial climatic variation : an experimental genomic and simulation approach in Fagus sylvatica populations along altitudinal gradients. Botanics. Université Montpellier 2 (Sciences et Techniques), 2013. English. �tel-02806552�
SCUOLA SUPERIORE SANT'ANNA
CORSOINTERNAZIONALEDIDOTTORATODIRICERCAIN AGROBIODIVERSITÀ
CURRICULUM A - RISORSEGENETICHEAGRARIEEFORESTALI
_____________________________ UNIVERSITÉDE MONTPELLIER 2
École doctorale: SIBAGHE
SPÉCIALITÉ: BIOLOGIE INTÉGRATIVEDESPLANTES
_____________________________
TESIPERILCONSEGUIMENTODELTITOLODI DOTTOREDI RICERCA
THÈSESOUTENUEPOUROBTENIRLEGRADEDE DOCTEUR
_____________________________
G
ENETIC
RESPONSE
OF
TREE
POPULATION
TO
SPATIAL
CLIMATIC
VARIATION
: A
N
EXPERIMENTAL
GENOMIC
AND
SIMULATION
APPROACH
IN
F
AGUS
SYLVATICA
POPULATIONS
ALONG
ALTITUDINAL
GRADIENTS
.
BY
HADRIEN LALAGÜE
DEFENDEDTHE 13TH MARCH 2013
JURY
DR. GIOVANNI GIUSEPPE VENDRAMIN CNR FLORENCE THESISDIRECTOR
DR. SYLVIE ODDOU-MURATORIO INRA AVIGNON THESISDIRECTOR
PROF. MARTIN LASCOUX UNIV. UPSSALA REVIEWER
PROF. STÉPHANIE MANEL UNIV. AIX-MARSEILLE REVIEWER
The PhD have been prepared within two host laboratories: Italian National Research Council (CNR) Institute of Plant Genetics - Florence CNR – IGV
Via Madonna del Piano, 10 50019 Sesto Fiorentino (Firenze) Italy
French National Institute for Agricultural Research (INRA) Ecology of Mediterranean Forests Unit
INRA
URFM – UR629 Site Agroparc Domaine Saint Paul
Acknowledgments
An adventure of four years ends up now. It has been a long climb, and like the past explorations in unknown lands, it is first of all a teamwork. The work described in this thesis could not have been accomplished without the support and guidance that I received from many people. It is now the time to give my sincere acknowledgments.
First of all I would like to thank my supervisors Sylvie and Beppe, for accepting me as PhD student. Thank you for your patience, for encouraging and pushing me. Thank you also for your skill at guiding me step by step while giving me the necessary liberty. It is a difficult task but from my point of view you perfectly deal with; these four years with you have been very fruitful!
I gratefully acknowledge the funding received towards my PhD from the Scuola Sant'Anna and for the efficiency of its secretary's office. I am also grateful to the funding received through the Evoltree network that facilitated travels between Italy and France and with the European partners.
Sincere acknowledgments go to PhD committee, Professor Martin Lascoux, Professor Stéphanie Manel, Dr Renaud Vitalis and Professor Enrico Mario Pe' for your willingness to read and evaluate my thesis, and the fruitful discussion during the PhD defense.
I first started the PhD in Italy where I met very nice and generous people always ready to help. Despite the initial barrier language, I learned a lot from you. Thank you Sara, Francesca and Federico for teaching me the basis of the lab work. In addition to the 'lab team' I thank Enrico, Andrea, Nicola, Valeria, Carolina, Johanna and Veronika for their good mood and nice company. The lunch time and parties with all of you were always very pleasant, with a special mention to Andrea for providing me (through shady means) discount tickets, you know what I mean!
Thank you Gabriele for taking the time to introduced me to the peculiar programming world; I now start to stand on my own two feet.
When I moved to the INRA of Avignon I discovered a team of passionate and skilled researchers, the door of your office was always open for me; I am very grateful to all of you, especially François
incredible talent for getting money. Money is not only the sinews of war but also the sinews of any research program.
Thank you very much Katalin for your help and support during the end of the PhD, your energy and knowledge helped me during this difficult period. I owe you a lot.
I have to thank Anne and Matthieu for their warm welcome and help in the laboratory of Saint Maurice. A particular thank you to Marie-Claude that manage to make administrative stuff comprehensible and easy.
I am very grateful to Marie-Jo and Cindy, my officemates in France. Thank you for your kindness and good mood, it has been a real pleasure to share the office with you. Thank you Cindy for your help with R each time I was nervously banging my head on the table... Shukran ya Marie-Jo ly mizajik al-ra2iq wa ly durusik al-lughata al-3arabiya rughma Anaa lastu taliban jayyidan.
I thank also the other PhD students and post-doc, Julie, Marion, Aurore, Guillaume, Annabelle, Cyrille and Tonya for all the discussions job and not-job related and the memorable parties.
I also thank the sporty colleagues always ready for running, swimming, biking or climbing, particularly Florence, Damien, Eric, François and Guillaume. By providing these relaxing moments, you played a crucial role to the achievement of the PhD.
During my PhD project I have collaborated with many people I would like to mention here:
Pauline Garnier-Géré for her fundamental help and support for aligning and checking the numerous DNA sequences. You spent a lot of time for me, I am very grateful. I would like to extend a special thank you to Stefania and Jonathan for their help during their internship. Your work was very thankless and difficult but you did not give up and finally succeed, chapeau bas!
Santiago Gonzales Martinez, Delphine Grivet and Katharina Budde for their cordial welcome during my stay in Madrid and more generally for their help during those four years. Many other, through numerous discussions played an important role: Yao Chen Lin, Concetta Burgarella, Anna Roschanski, Yoshiaki Tsuda and Jean Baptiste Lamy.
My hearty thanks go to my family and friends. Thank you for accepting somehow the long periods of silence and my rare and short appearances. I would also like to say a heartfelt thank you to my Mum and Dad for always believing in me and encouraging me to follow my dreams.
It is hardly possible to name everyone who helped me and who influenced my work and life during my PhD. I would like to express my apology to those, whom I could not mention here.
Abstract
A major challenge in population genetics is to understand the local adaptation process in natural population and so to disentangle the various evolution forces contributing to local adaptation. The experimental studies on local adaption generally resort to altitudinal gradients that are characterized by strong environmental changes across short spatial scales. Under such condition, the genetic differentiation of the functional trait (measured by the Qst) as well as the genes coding for trait (measured by Fstq) are expected to be mainly driven by selection and gene flow. Genetic drift and mutation are expected to have minor effect. Theoretic studies showed a decoupling between Qst and Fst under strong gene flow and / or recent selection. In this study, I tested this hypothesis by combining experimental and modelling genomic approach in natural population of Fagus sylvatica separated by ~3 kilometres and under contrasted environments.
Sampling was conducted in south-eastern France, a region known to have been recently colonised by
F.sylvatica. Four naturally-originated populations were sampled at both high and low elevations along
two altitudinal gradients. Populations along the altitudinal gradients are expected to be subjected to contrasting climatic conditions. Fifty eight candidate genes were chosen from a databank of 35,000 ESTs according to their putative functional roles in response to drought, cold stress and leaf phenology and sequenced for 96 individuals from four populations that revealed 581 SNPs. Classical tests of departure of site frequency spectra from expectation and outlier detection tests that accounted for the complex demographic history of the populations were used. In contrast with the mono-locus tests, an approach for detecting selection at the multi-locus scale have been tested.
The results from experimental approaches were highly contrasted according the method highlighting the limits of those method for population loosely differentiated and spatially close. The modelling approach confirmed the results from the experimental data but revealed that up to 95% of the SNPs detected as outliers were false positive. The multi-locus approach revealed that the markers coding for the trait are differentially correlated compared to the neutral SNPs. But this approach failed to detect accurately the markers coding for the trait if no a priori knowledge is known about them. The modelling approach revealed that genetic changes may occur across very few generation. But while this genetic adaptation is measurable at the trait level, the available method for detecting genetic adaptation at the molecular level appeared to be greatly inaccurate. However, the multi-locus approach provided much more promise for understanding the genetic basis of local adaptation from standing genetic variation of forest trees in response to climate change.
Résumé
Un enjeu majeur de la génétique évolutive est de comprendre comment l’adaptation locale se développe en environnement spatialement hétérogène. Le long de gradients altitudinaux présentant une variation rapide de l'environnement, l'adaptation locale devrait conduire à une différentiation génétique des caractères adaptatifs (mesurée par QST) et des gènes déterminant ces caractères (QTL, mesurée par
FSTq) plus forte que celle de marqueurs neutres (mesurée par FST), les valeurs des ces indices dépendant
de façon prédominante de la sélection (QST et FSTq) et des flux de gènes (tous les indices). Cet attendu
justifie l'utilisation des approche d'outlier pour identifier les loci sous sélection comme ceux présentant un FST plus fort qu’attendu sous un modèle neutre. Néanmoins des études théoriques montrent un
découplage entre QST et FSTq et une convergence de FSTq et de FSTq lorsque que les flux de gènes sont
forts et/ou que la sélection est récente. Dans cette thèse, j'ai testé ces attendus en combinant une approche de génomique expérimentale et par simulations dans des populations naturelles de hêtre commun (Fagus sylvatica).
Pour l’approche expérimentale, j'ai échantillonné 4 populations sur deux gradients altitudinaux sur le Mont Ventoux (avec une population à haute altitude et une à basse altitude sur chaque gradient). Cinquante huit gènes potentiellement impliqué dans la réponse aux stress abiotiques et dans le débourrement ont été séquencés sur un total de quatre-vingt seize individus, révélant 581 SNPs (Single Nucleotide Polymorphisms). Le nombre de SNPs outlier détecté varie fortement selon la méthode utilisée(entre 0 et 28). Par ailleurs, j'ai utilisé un modèle mécaniste individu-centré pour simuler les patrons de diversité phénotypique et génétique attendus le long du gradient pour la phénologie du débourrement végétatif, un caractère généralement adaptatif dans la réponse aux variations de température. Les résultats montrent que 5 générations suffisent pour obtenir une différentiation importante du caractère (QST), et confirment le découplage entre QST et FSTq (avec QST> FSTq). Les tests
d'outlier conduits sur les simulations révèlent que plus de 95% des SNPs outlier sont des faux positifs, confirmant les limites des approches d'outliers pour détecter les loci sous sélection dans des populations spatialement proche et génétiquement faiblement différentiée. En revanche, une approche originale multi-locus révéle une forte corrélation inter-populations inter-gènes des QTLs, confirmant les attendus théoriques. Cette approche multi-locus de la sélection ne permet pas à elle seule de détecter les loci sous sélection mais peut être utile en complément des approches d'outliers.
Several intermediate efforts, all basically erroneous but each supplying an important link in a developing story, preceded the successful conclusion.
Stephen Jay Gould Wonderful life, The Burgess Shale and the Nature of History
Contents
Introduction ...17
1.Speed of adaptation of forest trees to climate change...19
2.Overview of the concept of local adaptation...21
3.Main approaches by which to demonstrate local adaption...22
3.1.Approaches to searching for signs of selection among populations...25
3.2.Approaches for searching for the signal of selection within a population...27
4.Disentangling the role of demography and adaptation in the interpretation of patterns of local adaptation...28
5.Latitudinal versus altitudinal gradient as models for investigating local adaptation...31
6.Objectives of the thesis...32
Chapter 1. Species and sites ...35
1.Fagus sylvatica...37
1.1.Phylogenetic origin ...37
1.2.The post-glacial distribution of Fagus sylvatica...39
1.3.Main physiological and ecological properties...40
1.4.Bud burst phenology ...41
1.5.The genome of F. sylvatica ...42
2.Mont Ventoux...44
3.The history of Fagus sylvatica on Mont Ventoux...46
Chapter 2. Candidate genes selection and SNP discovery...49
1.Context ...51
2.Abstract...55
3.Introduction...56
4.Material and methods...59
4.1.Plant material...59
4.2.EST databases and annotation...59
4.3.Candidate gene selection...59
4.4.Primer design and gene amplification...60
4.5.Candidate gene sequencing...60
4.6.Data analysis...61
4.6.1.Phase reconstruction...61
4.6.2.Nucleotide diversity, LD patterns and recombination...61
5.Results...62
5.1.Gene selection, amplification and sequencing...62
5.2.Genomic diversity...67
5.3.Linkage disequilibrium (LD)...67
6.Discussion...69
7.Appendices...73
Chapter 3. Detection of loci under selection in Fagus Sylvatica along an altitudinal gradient: an outlier
experimental approach...81
1.Context...83
2.Abstract ...88
3.Introduction...89
4.Materials and methods ...92
4.1.Study species and site ...92
4.2.Candidate gene selection, sequencing and SNP validation...93
4.3.Genetic diversity, differentiation and linkage disequilibrium at candidate genes...93
4.4.SSR data...94
4.5.Frequentist outlier approach...94
4.6.Bayesian outlier approach...98
4.7.Relation between outlier SNP and traits...98
5.Results...99
5.1.Genetic diversity and differentiation at SNP and SSR markers ...99
5.2.Frequentist outlier approach ...102
5.3.Bayesian outlier approach ...106
5.4.Patterns of between-population correlations for SNP pairs...106
5.5.Relation between outlier SNPs and functional traits...106
6.Discussion ...107
7.References...112
8.Appendices...116
Chapter 4. Interaction between selection and gene flow in the building of genetic differentiation along an altitudinal gradient: lessons from an Eco-Physio-Demogenetic simulation model...123
1.Context...125
2.Introduction...128
3.Materials and Methods...132
3.1.The model and the simulated data sets...132
3.2.Measures of population differentiation...133
3.3.Patterns of genotypic and allelic frequencies across elevation...134
3.4.FST -based outlier approaches...134
3.5.Patterns of covariance among populations...135
4.Results...137
4.1.Patterns of genetic differentiation for the trait (FcritBB), the QTLs and the neutral loci...137
4.2.FST -based genome scan between populations Pop2 and Pop3...137
4.3.Patterns of genotypic and allelic frequencies across elevation...141
4.4.Inter-genic allelic correlation among populations Pop2 and Pop3...141
5.Discussion...144
5.1.Comparison with theoretical expectations...144
5.2.Global performance of FST -based outlier approaches...146
5.3.Performance of methods that are based on clines of genotypic frequencies...147
5.4.Performance of the between-population component of intergenic linkage disequilibrium (Zg) ...148
Discussion...151
1.Experimental genomic approach in non-model species : Methodological insights...153
1.1.Is Sanger-sequencing appropriate for population genomic studies ? ...153
1.2. Are genome-scan approaches appropriate for detecting selection along local environmental gradients ?...156
1.3. Towards integrated approaches to detecting selection at local spatial scale and short evolutionary time scales ?...159
2.Toward a better knowledge of F. sylvatica adaptive response to climate...160
2.1.A low diversity, low differentiation among populations and strong LD ...160
2.2.Genes and traits involved in adaptation of F. sylvatica to climate...163
3.Genetic markers as tools for understanding adaptive response to climate change...167
References...171
Box 1: Definitions from Violle et al. (2007)
Trait: Any morphological, physiological or phenological feature that is measurable at the individual level, from the cell to the whole-organism level, without reference to the environment or any other level of organization.
Functional trait: Any trait that impacts fitness indirectly via its effects on growth, reproduction and survival.
Performance trait: Direct measure of fitness. In plants, only three types of performance traits are recognized: vegetative biomass, reproductive output (e.g., seed biomass, seed number), and plant survival.
18
Figure 1. IPCC report 2007
Figure 2. Arnold’s (1983) framework revisited in a plant ecology perspective. Morpho-physio-phenological (M-P-P) traits (from 1 to k) modulate one or all three performance traits (vegetative biomass, reproductive output and plant survival) which determine plant performance and, in fine, its individual fitness. M-P-P traits may be inter-related (dashed double-arrows). For clarity, interrelations among performance traits and
1. S
PEEDOFADAPTATION OF FORESTTREESTO CLIMATECHANGECycles of glacial and interglacial periods occurred on the earth’s surface for at least the past 2.7 million years, with glacial periods being characterized by a dry and cold climate. The previous period lasted 100 ka and ended 10 ka ago. The study of the pollen that was captured in sedimentary layers (palynology) highlights how plant species survived the previous glacial era and how they recolonize the land once it was free of ice in Africa, Australia, Europe and North America (Adams and Faure, 1997). These palynological surveys showed that hundreds of square kilometers that are now covered by forest in the Northern Hemisphere were covered by a large ice sheet. The biomes shifted across large distances, resulting in drastic modifications in ecosystem composition and connections, with many populations becoming isolated because of land and sea barriers. The primary forest tree genera are 15 to 60 million years old (Collinson 1992, Denk et al. 2002). Palynological surveys indicate that combining pollen data with charcoal and genetic data can be used to estimate the speed of latitudinal recolonization to approximately 100 m annually (Aitken et al. 2008). A body of studies has indicated that past climate changes were quite slow.
In contrast, the principal characteristic of the current climate change is its velocity (Loarie et al. 2009). According the IPCC (2007 report, Figure 1), “the intensity (variation / unit of time) observed and expected has never been reached since the last post-glacial warming”. For instance, near-surface temperature is expected to shift at mean rates of 80-430 m yr-1 during the 21st century for tropical,
Mediterranean, temperate and boreal forests (Loarie et al. 2009), leading to shifts of trees bioclimatic envelopes from 300 to 800 km within one century. Besides, CC predictions (IPPC, Alcamo et al. 2007) suggest not only notable changes in near-surface temperature, but also in precipitation and in the frequency and intensity of heat waves, forest fires and pest outbreaks. The effects of the high velocity of climate change (CC) are reinforced by the small size of protected areas in Mediterranean and in some temperate forests, (Loarie et al. 2009) stressing the need to account for other components of GC (particularly land-use) when forecasting forest responses.
Forests are keystone species of terrestrial natural ecosystems. Forests are not a mere combination of certain woody species; rather, each tree is the habitat for numerous plants, animal and fungus species. This is particularly true for natural forests, which are generally highly heterogeneous and offer a broad
biodiversity reservoir.
One challenge is to understand whether forest trees can respond to the current rapid climate change. An ongoing debate that divides scientists can be approximately classified in three categories. First, certain optimistic scientists argue that trees populations may migrate to follow their respective climatic niche (e.g., Pauli et al. 2007, Parmesan and Yohe 2003, Penuelas and Boada 2003, Walther et al. 2002). Another category of optimistic scientists are convinced that trees populations have high levels of adaptive genetic diversity, which will confer them with a great adaptive capacity in face of climate change (e.g., Hamrick 2004, Petit and Hampe 2006). For yet others, climate change is occurring to rapidly to allow for tree populations to survive either through adaption or migration (e.g., Huges 2000, Davis et Shaw 2001, Thomas et al. 2004).
2. O
VERVIEWOF THECONCEPT OFLOCAL ADAPTATIONAdaptation was first defined as the process by which a novel character (or trait) is maintained by natural selection (Gould and Lewontin, 1979). When individuals exhibiting the new discrete character survive and reproduce better than individuals that lack the new character, the new character increases in frequency in the population in next generation. This ability of an individual organism to transmit its genes more or less efficiently to the next generation defines the fitness. The etymology of adaptation suggests a change “ad” toward a higher aptitude “aptus”. This notion of highest aptitude wrongly leads to the notion of evolutionary progress, with individuals/species becoming more complex. Another abuse described by the term adaptationism is the one consisting in incautiously considering a given trait as “functional” or “adaptive” (see Box 1 and Erreur : source de la référence non trouvée) is. An example is provided by the debate regarding leaf retention during winter by certain individuals of common oak (Quercus robur) and beech (Fagus sylvativa). Otto and Nilsson (1981) proposed that the retention of dry leaves during winter is an adaptive trait in the sense that it avoids the nutrients being flushed away during winter and allows for the litter to be enriched immediately prior to spring. However, considering this trait in the light of the phylogeny of Fagaceae family, Wanntorp (1983) noted that leaf retention is an ancestral character. Of over 1000 Fagaceae species, the majority are evergreen. Moreover, in oaks, a spectrum of leaf shedding habits can be observed, from long persistent to completely deciduous; these different habits are correlated with climate. Evergreen species are primarily located in tropical and Mediterranean regions, semideciduous species are found in intermediate habitats, and deciduous species reach north of Europe. As a consequence, specialization would not be leaf retention but, a contrario, deciduousness.
Since Darwin, adaptation in response to natural selection has been acknowledged to be a keystone concept in evolutionary biology, explaining how individuals suit their environment. Adaptation shapes the tree of life, but it is essentially occurring at local scale. As the forces of natural selection often vary through space, populations of the same species that are distributed within a heterogeneous environment are expected to evolve traits that increase individual fitness in a given habitat. This pattern and the process leading to it is local adaptation (Kawecki and Ebert 2004). In natural populations, it is generally difficult to assess the action of selection and to verify the adaptive advantages of a trait,
fitness (Endler, 1986).
Considering two populations A and B in distinct environmental conditions in which the optimum value ZOPT of the trait (the value conferring the highest fitness) differs among both populations (with the two
respective values ZOPT-A and ZOPT-B), we expect divergent selection among habitat A and B to shift the
distribution of the trait such that the distribution is ideally centered on the optimum value in each habitat (Kawecki and Ebert 2004). The establishment and maintenance of local adaptation is a balance between conflicting evolutionary forces (Yeaman and Otto 2011). Kawecki and Ebert (2004) stated the conditions in which local adaptation may occur: first, gene flow must be sufficiently high as to prevent isolation by distance but not too high to impede specialization; second, selection must be strong against maladaptive genotypes and moderate against intermediate genotypes; third, the temporal variation of selection forces must be very low; fourth, adaptive plasticity must not be favored.
3. M
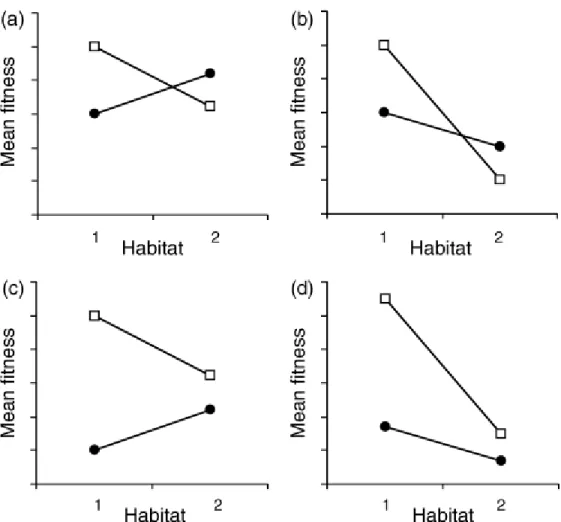
AINAPPROACHESBYWHICHTODEMONSTRATE LOCALADAPTIONThe primary approaches by which patterns of local adaptation in populations can be demonstrated are based on the analysis of either the phenotypic traits or molecular markers. Each approach has its advantage and disadvantages (Hansen et al. 2012). With respect to the traits-based approach, the primary difficulty is separating the portion of the variation that is under genetic control from that which results from environmental variation. A classical approach by which to assess local adaptation is to compare, through reciprocal transplant experiments, the relative fitness of the local vs. foreign genotypes within each habitat (Figure 3). Fitness must be ideally evaluated through lifetime experiments by measuring the contribution of each genotype to the successive generation. Alternatively, proxies of the genotype contribution to the next generation (fitness) may be used, such as vegetative biomass, reproductive output, and plant survival. The population growth rate proxy works quite well for small and short-lived organisms, such as bacteria (Belotte et al. 2003). In long-lived species, such as trees, the most common approach consists of investigating a performance trait, such as survival, fecundity, or growth, and considering it as representative of fitness (Rehfedlt et al. 2001 Savolainen et al 2007). The principal drawback of this approach is the limited knowledge of the relationship between the investigated performance trait and fitness. Moreover, directional selection may not act uniformly on the trait through the different stages of the individual’s lifetime. The resulting fitness depends of different traits each being under differential selection directions and strengths at
different life stages. Moreover, reciprocal transplant experiments are occasionally not possible for legal or ethical reasons and frequently require unwieldy protocols that are hardly compatible with usual scientific project scales, particularly for long life cycle species.
24
Figure 3. Hypothetical patterns of deme × habitat interaction for fitness. Squares: the average of demes originating from habitat 1; circles: the average of demes originating from habitat 2. The patterns in panels (a) and (b) satisfy the ‘local vs. foreign’ criterion. The patterns in panels (a) and (c) satisfy the ‘home vs. away’ criterion. The average difference between the ‘sympatric’ and ‘allopatric’ deme–habitat combinations is the same in all graphs Kawecki and Ebert (2004).
With respect to marker-based approaches to investigate local adaptation , they most often rely on indirect approaches, i.e., on the patterns of genetic differentiation or in the distribution of allelic variants that result from selection. In the case of divergent selection considered here, local adaptation should result in genetic differentiation of the trait that affects fitness between populations A and B. Note that other type of selection are possible: for instance in the case of balancing selection, the trait is selected towards the same optimal value in the different environments (i.e., ZOPT-A = ZOPT-B).
Under divergent selection, genomic regions that contain loci coding for the trait (QTLs, Quantitative Trait Loci) tend to diverge more rapidly than expected under neutrality. This locus-specific process lead to an increase in the frequency of the favorable allele and, to a lesser extent, an increase in the frequency of neutral alleles that are linked with the favorable allele (Maynard Smith and Haigh 1974). This process, also referred to as “hitch-hiking selection”, leads to a drastic reduction in polymorphisms in large genomic regions and to genetic differentiation between the two populations. Subsequently, divergent selection continuously contributes to allelic fixation and to a decrease in nucleotide diversity within each population. If there is no selection, the average time for one locus to become fixed through genetic drift is 4Ne, where Ne is the effective population size. However, selection may also contribute to maintain allelic diversity via overdominance (the heterozygote individual has higher fitness), heterogeneous selection (the genotypes favored are regularly different) or frequency-dependent selection (the rarest genotypes have high fitness). A selection process that maintains alleles at intermediate frequencies more than would be expected under neutrality is referred to as balanced selection. However, balanced selection may be confounded with an incomplete form of divergent selection. This can occur in two ways. The first case is when one allele is under divergent selection, and the second is continuously brought into the population via migration. In the second case, hitch-hiking is interrupted when the allele is at intermediary frequency (Hedrick 2007).
3.1. Approaches to searching for signs of selection among populations
Following the original hypothesis of Cavalli-Sforza (1966), Lewontin and Krakauer (1973) proposed to compare levels of genetic diversity and differentiation between populations. This proposal was made given that loci under directional selection should exhibit larger differences between populations than neutrally evolving loci. Similarly, loci under balancing selection should exhibit less divergence than do
Wrigtht's FST. Loci with an unusually high or low FST values are generally considered to potentially be under the effect of divergent selection and are referred to as “outliers”. Outliers may be either directly or indirectly under selection through linkage. The majority of the recent outliers approaches based on FST scans aimed at to accounting for the high expected variance in FST due to the correlation of allelic frequencies among demes that result from common demographic history, likely to make the original approach of Lewontin and Krakauer (1974) unreliable. Among these developments, the frequentist approach of Beaumont and Nichols (1996) relies on coalescent simulation of the expected neutral distribution of FST assuming an infinite island model of population structure ; this analysis is conditioned on heterozygosity. This approach was shown reported to be remarkably robust to a wide range of alternative models of population structure (e.g., colonizsation, stepping stone).
To avoid the bias that is induced by the demographic and selective history specific to each sampled population, Vitalis et al. (2001) proposed to focus on pairwise population comparison rather the whole meta-population given that the basic assumptions regarding population structure and history cannot generally be verified. Therefore, they defined new population-specific parameters of population divergence and constructed sample statistics that are estimators of these parameters. One advantage of this method would be the detection of a signature of selection that was specific to one population in cases when the signature would be too weak to be detected when the entire population is considered. However, this method is not appropriated for all type of loci, in particular for SNPs1 (Eveno et al.
2008).
Equal migration rates between populations is a strong assumption of the approach that was developed by Beaumont and Nichols (1996). To minimize this constraint, Foll and Gaggiotti (2008), following the model proposed by (Beaumont and Balding 2004), developed a model based on the decomposition of the logit value of FST into i) a locus-specific effect that is shared by all populations and ii) a population-specific effect that is shared by all of the loci. For each loci, posterior probabilities are calculated for the model, with selection being included in or excluded from the model.
1Single Nucleotide Polymorphisms
3.2. Approaches for searching for the signal of selection within a population
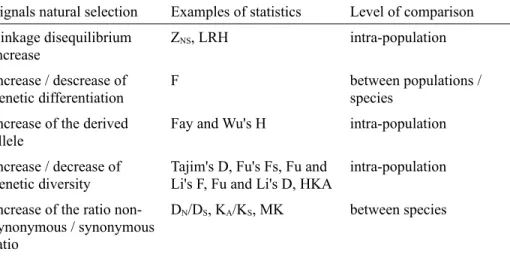
The core of the neutrality test is to compare a descriptive statistic that is computed from the data to the same statistic as computed based on the neutral model. These approaches all are differentially sensitive to different parameters, notably to the time since the selection event occurred, the population structure and the demographic history. An overview of these tests is presented in the Table 1.
Table 1. Summary of the five primary classes of neutrality tests (modified from Eveno 2008) Signals natural selection Examples of statistics Level of comparison
Linkage disequilibrium increase ZNS, LRH intra-population Increase / descrease of genetic differentiation F between populations / species Increase of the derived
allele
Fay and Wu's H intra-population Increase / decrease of
genetic diversity Tajim's D, Fu's Fs, Fu and Li's F, Fu and Li's D, HKA intra-population Increase of the ratio
non-synonymous / non-synonymous ratio
4. D
ISENTANGLING THE ROLEOF DEMOGRAPHYAND ADAPTATION INTHE INTERPRETATION OF PATTERNSOF LOCALADAPTATIONDuring the 1960s and 1970s, the Japanese geneticist M. Kimura discovered in a series of studies a new model to explain the numerous mutations that can be observed in a given organism’s genome (Kimura 1983). In his model, the vast majority of mutations are divided into two groups. The first group is composed of selectively neutral (or nearly neutral) mutations that become fixed in a species by genetic drift. These changes account for nearly all of the observable nucleotide changes between two species and became the name of a model widely used in population genetics, the standard neutral model (SNM). The second group of mutations is composed of selectively deleterious mutations that arise continuously and that are eliminated over time by natural selection. Deleterious mutations are rarely observed when comparing the genomes of two species but are the basis a substantial fraction of population diversity within a species. As they cause mutant phenotypes, deleterious mutations are well known by functional geneticists.
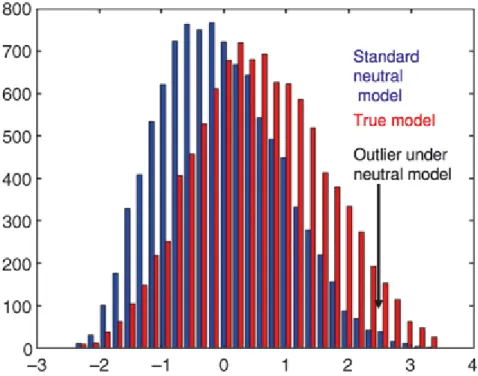
Figure 4. Distribution of the observed statistics (θ, π, Tajima's D, …) under the neutral model (in blue) and the the true model (in red). The demography can influence the distribution of the neutral model and therefore lead to high proportion of false positive (modified from Siol et al. 2010)
In the early 2000s, the neutral theory began to be widely used as a "null model" for so-called null hypothesis testing. The core assumption of the standard neutral model is a constant population size, a hypothesis that is likely to be violated in many natural populations. Nevertheless, the first genomics studies that investigated patterns of genetic diversity or differentiation for candidate genes frequently interpreted deviations to the neutral model as evidence of natural selection (Wright and Gaut 2005). Population expansion may induce a loss of genetic diversity and sub-population differentiation (Wegmann et al. 2006; Slatkin and Excoffier 2012). Moreover, certain alleles may reach high frequencies due to of successive founder events (Edmonds et al. 2004) and genetic surfing (Excoffier and Ray 2008) that mimic the characteristics of a favorable allele under selection. Consequently, a cline in allele frequently that matches a geographic variation, although frequently believed to be a result of selection, may in fact be due to stochastic processes during range expansion (Slatkin and Excoffier 2012)
Population bottlenecks lead to a random genetic sampling and have a greater effect on allelic richness than nucleotide diversity (Nei et al. 1975; Dlugosch and Parker 2008). The consequence of sampling is both immediate and occurs throughout the first successive generations, when the likelihood of losing an allele by genetic drift is higher. Santos et al. (2012) demonstrated experimentally to what degree both the standing variability following the bottleneck and the stochastic changes during the first generations are important parameters in determining the evolutionary potential in Drosophila subobscura. Populations with the same genetic background that independently experienced a bottleneck and subsequent genetic drift developed contrasting adaptation responses to the novel environment.
Through diverse strategies, several recent studies attempted to integrate the confounding effects of demography to provide more realistic null models (Nielsen 2005; Thornton and Jensen 2007; Siol et al. 2010). The basic assumption behind this approach is that demography affects the entire genome, whereas selection acts on specific loci. Therefore, one may generate a distribution of the statistics of interest that is congruent with the observed data and use it as a null model (Figure 1). Early coalescent methods (backward through time) allowed for such approaches (Hudson 2002). Computer capabilities now allow for the simulation of entire populations forward in time (Hernandez 2008). Moreover, likelihood-based approaches can be performed using Markov chain Monte Carlo methods (Beaumont and Rannala 2004; Csillery et al. 2010).
5. L
ATITUDINALVERSUS ALTITUDINALGRADIENT AS MODELSFOR INVESTIGATING LOCALADAPTATIONThe establishment and maintenance of genetic polymorphism along continuously varying environments have been well studied theoretically using models of clinal variation (Slatkin 1973; Slatkin and Maruyama 1975; Barton 1999; Vasemägi 2006). In natural conditions, continuous patterns of differentiation are often observed along environmental gradients. These patterns were first observed in soil that was contaminated by heavy metal (Antonovics et al. 1971). Such clines were then reported for phenological traits (Howe et al. 2003; Savolainen et al. 2007) along latitudinal gradients. For certain trees, populations from northern latitudes flush earlier than do southern populations, such as Pinus
sylvestris in Scandinavia (Giertych, 1991) and Picea sitchensis in North America (Mimura & Aitken,
2007) and Fagus sylvatica in Europe (von Wuehlish, 1995; Gomory and Paule, 2011). In contrast,
Quercus petraea (Liepe, 1993; Deans & Harvey, 1995; Ducousso et al. 1996) and Betulus pubescens
(Worrell et al., 2000), southern populations flush earlier than do northern populations.
Despite the pronounced advantages of population comparisons over wide scales, altitudinal gradients are ideal situations in which to examine local adaptation with a minimum of confounding biogeographic, historic and genetic isolation influences. Along the altitudinal gradient, climatic and edaphic properties change rapidly, whereas the populations from different habitats are genetically well connected. Evidence for local adaptation has been reported for several plant species, e.g., in Silene
ciliata (Gimenez-Benavides et al. 2007), Poa hiemata (Byars et al. 2007) and Festuca eskia
(Gonzalo-Turpin and Hazard 2009), as well as among the Fagaceae family, in Fagus grandifolia (Ledig and Korbobo 1983). Similar evidence has also been observed for Quercus species, for which populations from higher altitudes flushed later than those from lower altitudes do (Vitasse et al. 2009a).
Moreover, an altitudinal gradient affords the trade of space for time, this is a classical hypothesis in ecology. The space-for-time hypothesis considers that the spatial shift in climatic conditions along a gradient can be equivalent to the temporal shift that each local population will face under changing climate conditions. The major phenotypic traits or genes of major effects that are determined to contribute to the spatial genetic variation among populations may then be used as candidate traits/markers for monitoring over time (Jump et al. 2006; Jump et al. 2009).
6. O
BJECTIVES OF THETHESISThe general objective of this PhD thesis was to assess the adaptive genetic response of tree populations to spatial climatic variation at local scale. In a first part of this PhD thesis, I used an experimental approach in F. sylvatica populations on Mont Ventoux for which evidence of local adaptation along an altitudinal gradient were reported (Gauzëre 2011). The objective of this experimental study was to identify signatures at the molecular level of recent selection in populations that are connected by high gene flow. The second objective of this PhD thesis was to evaluate the power of the methods that were used to detect recent selection at local spatial scale. For that purpose, I used a simulation approach relying on individual-based and mechanistic model.
The specific aims of each chapter are as follows:
Chapter 1: To describe the principal characteristics of the species (Fagus sylvatica), the site (the Mont Ventoux), and the particular history of Fagus sylvatica on Mont Ventoux.
Chapter 2: To characterize patterns of nucleotide diversity and linkage disequilibrium in Fagus
sylvatica. This work is on the point to be submitted to the journal Tree, Genes and Genomes.
Chapter 3: To detect signals of local adaptation using outlier tests, inter-genic allelic correlations between populations and allelic correlations with trait values. This work has been submitted to the journal Molecular Ecology.
Chapter 4: To assess the potential of outlier tests and inter-genic allelic correlations between populations to detect QTLs through an individual based model that is specific to F. sylvatica on Mont Ventoux.
C
HAPTER
1.
36
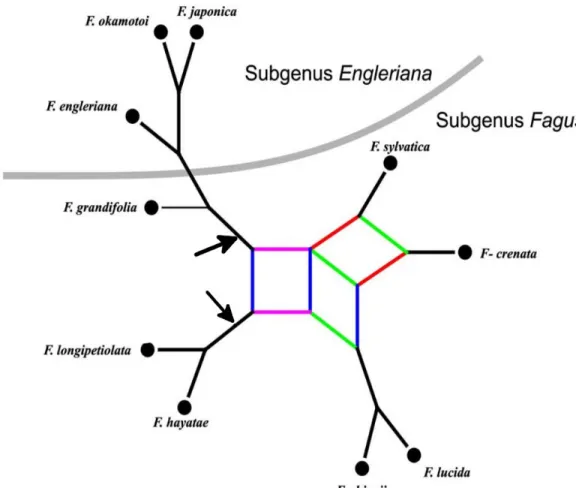
Figure 1.1. Phylogenetic relationships in extant Fagus based on morphological and molecular data. Two potential roots are indicated by arrows. Colored edges represent alternative (in-congruent) relationships indicated by the underlying data. Modified from (Denk and Grimm 2009)
1. F
AGUSSYLVATICA1.1. Phylogenetic origin
Fagaceae is a small genus of Fagales (family Fagaceae) that consists of two morphologically and
genetically distinct subgenera (Fagus and Engleriana). The genus contains 10 species, 1 American (Fagus grandifolia Ehrh) and 9 Eurasian. Members of the subgenus Engleriana descended from a common ancestor and form a well-supported clade2, whereas relationships between members of the
subgenus Fagus are more complex (Figure 1.1). Although the root cannot be determined with confidence, the genus can be considered to be monophyletic (sensu Haeckel, 1866), and a common origin of all of the members is assumed (Denk et al. 2005).
An origin of Fagus in the north Pacific region is likely in the early Eocene. The genus crossed the Bering channel and colonized Eurasia. A second phase of radiation began in the late Oligocene-early Miocene. At this time, the subgenus Engleriana emerged. In the Middle and Upper Miocene, the first differentiation occurred within the Eurasian populations, gradually isolating ancestors of modern lineages (including F. sylvatica). The separation between F. crenata and F. sylvatica is assumed to have begun with the fragmentation of the ancestral population between Europe and northeastern Asia after central Asia became an unsuitable habitat for Fagus during the Miocene (Denk and Grimm 2009).
38
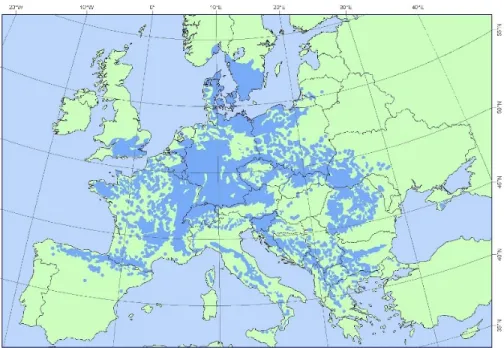
Figure 1.2. Distribution map of beech (Fagus sylvatica) EUFORGEN 2009, www.euforgen.org
Figure 1.3. Tentative location of refuge areas for Fagus sylvatica during the last glacial maximum and hypothesized main colonization routes during the post-glacial period (from (Magri et al. 2006)
1.2. The post-glacial distribution of Fagus sylvatica
Beech was present in Europe before the Quaternary (Denk et al. 2002); however, the data are highly imprecise due to the limited availability of fossil remains. Beech repeatedly appeared during the majority of the temperate periods of the previous 500 ka. At the end of the last interglacial period (the Eemian, 127-112 ka BP), beech is well represented in southern Europe; pollen is observed at numerous sites in central and northern Europe but in limited amounts. During the last glacial period (hereafter, the last glaciation) (110 ka BP to 10 ka BP), beech populations expanded in the southern part of the Italian peninsula and in the Balkan Peninsula (Figure 1.3), in southeastern France as well in the Iberian Peninsula along the Pyrenees and the coast of the Cantabrian Sea. In contrast, beech was a minor component of the forest vegetation in central Europe. At the end of the last glaciation, between 10 ka and 9 ka BP, the presence of beech pollen increased rapidly in central Italy and in the Alps, suggesting the migration and expansion of beech from a small population that persisted during the glacial period. In southern France, beech is found at low elevations, near to the estuary of the Rhône river. The results from anthracological investigations along the Rhône valley indicate that beech could have survived the last glacial period both in the Mediterranean coastal area and in the eastern Alps (Delhon and Thiebault 2005). The outer Alpine chain was rapidly colonized between 7 ka and 6 ka, but the paleo-botanical data do not allow for the determination of whether these populations originated from Austria-Switzerland or from sites near the Rhône valley. Although no paleobotanical data are available from Mont Ventoux, it is likely that its colonization began from refugia located in the southern Rhône valley rather than in Austria or Italy. A mix of these refugia is unlikely to have occurred because of the absence of beech between Mont Ventoux and the Alps or Northern Spain. During the last 5 ka BP, beech rapidly expanded in Germany, crossed the Channel to England, colonized Scandinavia and disappeared from the Rhône valley lowlands. The distribution of beech in Europe of 1 ka BP is very similar to its current distribution (Magri et al. 2006). Beech forests now cover approximately 17 million hectares in Europe (Comps et al., Figure 1.2). In the northern part of its range, beech grows at low elevations, whereas it is found at altitudes above 1000 m asl in the southern part of its range.
1.3. Main physiological and ecological properties
Beech is a long-lived species (up to 250 years or more) but is normally harvested at 80-120 years of age. Beech is generally 30-35 m tall, although it may rarely grow as high as 40-45 m. Beech has separate male and female flowers on the same tree and is wind pollinated (anemophily). Its fecundation is predominantly based on allogamy, although autogamy has been observed in natural conditions (Piotti et al. 2012). Seed production begins between 40 and 50 years of age in open area and between 60 and 80 years of age in the case of dense canopy. The seed abundance is highly variable, and the year of masting1 occurs with a frequency of 5-10 years (von Wuehlisch et al. 1995). The large seeds are first
dispersed by gravity (barochory) and then in certain cases by animals (zoochory), which collect and hide seeds (Nilsson 1985).
Beech grows on well drained, moderately deep to deep soils that range from sub-alkaline to acidic. It does not grow on rocky or dry sites or in soils with stagnant water or those that are regularly flooded. On favorable sites, beech out-competes other tree species due to its efficient use of light. Once beech becomes dominant species, low light levels in the understory allow for beech seedlings to survive better than other species. Beech is then considered to be a late succession species that out-competes pioneer species. Whereas beech is predominantly found in the humid lowland of northern Europe, beech stands are found in particular locations in the Mediterranean region. Precipitation is not an effective estimator of beech distribution. In southern climates, where beech occurs at high altitudes, fog appears to compensate for the lack of precipitation. On mountain slopes, beech distribution coincides with areas that are frequently foggy (Teissier du Cros 1981). Drought is a limiting factor for low-altitude population distributions; more precisely, drought duration is more limiting than drought intensity.
Beech wood is much-appreciated worldwide, and many beech forests are regularly harvested for timber production. Apart of its economic importance, European beech has also a major role in soil preservation and water cycles, making this species a target of ecologically oriented conservation programs.
1 Also called mast seeding or mass seeding, it is the intermittent production of large seed crops by a population of plants
(Kelly 1994).
1.4. Bud burst phenology
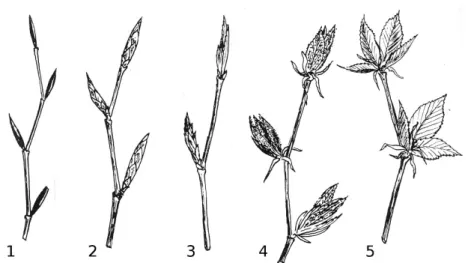
Phenology has well-demonstrated links to climate from the level of genetics to landscapes (Pau et al. (2011). Phenology has been demonstrated to be a major determinant of plant species distribution (Chuine and Beaubien 2001) and to be related to individual fitness (Rathcke and Lacey, 1985), making this a relevant trait that is related to adaptation. A mismatch between the life cycle and seasonal climate fluctuations may result in frost injuries to leaves or flowers, drought injuries if severe drought occurs during the growing season, and failure in the production of mature fruits and seeds if autumnal frosts occur too early. In this work, I focused on leaf phenology and in particular the bud burst given that this is a key factor in determining the duration of the growing season for deciduous species (Vitasse et al. 2009). Bud burst is regulated by temperature during winter, i.e., the chilling temperatures that break winter dormancy. The date of flushing results from a trade-off between increasing the vegetation length and minimizing the risk of damage by either late spring or early autumn frosts (Kramer et al. 2000). The bud-burst can be described with five stages (Figure 1.4). The scores, from 1 to 5, are summed at each date of measurement to calculate a phenology score sum (PSS) for each tree. The higher the PSS at a given date of measurement, the earlier and more rapid is the process of leaf unfolding for the examined tree.
1.5. The genome of F. sylvatica
As for numerous non-model species, little is known of the genomes characteristics of F. sylvatica. The number of chromosomes is 2n=24 (Ohri and Ahuja 1991). According to Gallois et al. (1999), the 2C nuclear DNA content is 1.11 pg (± 0.02) or 1070 Mbp. This analysis revealed that F. sylvatica genome size is at the lower range of known 2C genome sizes of higher plants. The GC percent is 40% (± 0.2), which is a typical value for higher plants (Gallois et al. 1999). The chloroplastic DNA length is the shortest of the Fagaceae, with 161,226 bp (Kremer et al. 2012).
Several studies of geographical variation in Fagus sylvatica have been performed using universal cpDNA markers. Variation is extraordinary low north of the Alps, as only one haplotype is common (Demesure et al. 1996, Magri et al. 2006). The cpDNA variation is much higher in the Mediterranean areas (Vettori et al. 2004), where a high proportion of the genetic variation is distributed among populations. Highly divergent haplotypes were also observed in the Balkan region, especially in Greece, (Magri et al. 2006, Hatziskakis et al. 2009) and in Asia Minor (Turkey) (Gailing & von Wuehlisch 2004), where the major proportion of the genetic variation was detected within populations in specific regions.
Magri et al (2006) used a very large set of complementary paleobotanical and genetic data to elucidate the genetic consequences of long-term survival in refuge areas and postglacial spread. Their analysis was performed on 450 and 600 beech populations for cpDNA markers (RFLPs and SSRs) and nuclear markers (isozymes) respectively, covering the entire F. sylvatica range in Europe. The cpDNA analysis verified the extraordinary low genetic variation north of the Alps, whereas region-specific patterns occur throughout the Mediterranean range (Hatziskakis et al. 2009, Magri et al. 2006, Vettori et al. 2004).
AFLP markers were used to examine differences between Fagus sylvatica and F. orientalis (Gailing & von Wuehlisch 2004) to investigate the spatial genetic structure of European beech and the SGS variations that are observed with different genetic markers (Jump et al. 2012). Jump and Peñuelas (2007) revealed an extensive spatial genetic structure in beech populations using AFLP markers that were not observed with microsatellite markers. A combination of different marker types, including AFLP and microsatellites, was implemented to construct a genetic linkage map for European beech
(Scalfi et al 2004). Jump et al. (2006) also used AFLP markers to examine the adaptation of European beech to temperature changes in the context of the hypothesized climate change in Europe.
The distribution of chloroplast microsatellites revealed the presence of a single haplotype that is widespread in Europe north of the Alps, a typical Italian haplotype and certain highly divergent haplotypes in the southern part of the Balkan Peninsula and Greece (Hatziskakis et al. 2009, Magri et al. 2006, Papageorgiou et al. 2008). As expected given their biparental inheritance, isozymes display a less pronounced level of genetic structure but a more complex pattern than cpDNA throughout the different bio-regions. The combination of isozymes and cpDNA allows for the detection of groups of populations that were undetected when only chloroplast markers were used on a European scale and for the description of the possible migration processes of this species in Europe (Magri et al. 2006).
2. M
ONTV
ENTOUXMont Ventoux geologically belongs to the Alps, although it is often considered to be separated because of the lack of mountains of similar height nearby. During the late Cretaceous, the Pyrenean orogenic1
process originated an overturned anticline2 toward the north. This explains why the north slope is steep
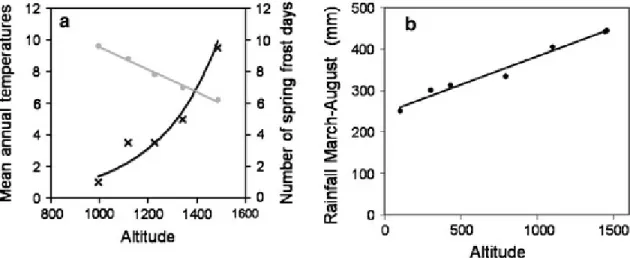
on average (25° ± 9), whereas the south is characterized by a gentle slope (12° ± 8). For the previous 2 Ma during the Quaternary, the succession of glaciations gave to the mountain its current features through the action of frost weathering and the formations of numerous scree deposits. The mountain is 1909 m high, 24 km long on the west-east axis and 15 km long on the north-south axis. The soil is primarily calcareous (Du Merle and Guende 1978) and poor in organic subtract, which is common in the Mediterranean environment but in this specific case is also due to excessive land use during the previous centuries. The top of the mountain is covered with bare limestone without vegetation or trees. The climate characteristics are the same as in the Southern Alps, being typically Mediterranean at the base; this gives way to a temperate climate and then continental with highland climate influences at lower altitudes. The precipitation regimes vary across the seasons, with severe drought during the summer. On the north slope, the temperature decreases with the altitude, with a rate of approximately 0.6°C per 100 m (Figure 1.5a), while precipitation increases (Figure 1.5b). The number of spring frost increases with the altitude (Figure 1.5a). Such events may damage buds and young leaves that began their spring growth and then affect tree growth during the successive months.
1 Deformation of the Earth's lithosphere due to the engagement of tectonic plates 2 A fold that is upwardly convex, with its oldest beds at its core
Figure 1.5. a Altitudinal effect on mean annual temperature (grey circles) and on the number of spring frost days (black crosses) in 2007 and 2008 along the gradient studied on the north-facing slope of Mont Ventoux. The number of spring frost days was calculated as the average of the number of frost days between April and June for the years 2007 and 2008. The slope of the linear regression between mean temperature and altitude is −0.71°C/100 m. b Elevational effect on spring and summer (March–August) rainfall on the Mont Ventoux for the period 2000–2005. The slope of the linear regression between rainfall and altitude is +14 mm/100 m (from (Cailleret and Davi 2011).
3. T
HE HISTORYOFF
AGUSSYLVATICAONM
ONTV
ENTOUXBefore human presence, the tree vegetation of the Mont Ventoux was most likely a combination of dominating beech and silver fir with scattered broadleaves in open areas, specifically, mountain ash (Sorbus aucuparia), white beam (Sorbus aria), and Italian maple (Acer opalus). Progressively, between the 13th and 20th century, humans harvested the wood, and the forest was replaced by grazing, except in steep hard-to-reach spots. Deforestation culminated in the second half of the 19th century. A survey in 1838 estimated that that was approximately 9500 ha of beech in the Mont Ventoux, whereas the following survey in 1876 reported only 2276 ha (Lander et al. 2011). This resulted in severe floods along the valleys around the mountain. In 1861, a program of reforestation was begun (Jean 2008). First, mountain pine (Pinus uncinata), Norway spruce (Picea abies) and larch (Larix decidua) were used. One century later, in the resulting stands, timber was harvested. Meanwhile, a small number of beech and silver fir remnants from the original stands began to colonize artificial stands and reconquer their environment. Beech is now distributed between altitudes of 750 m to 1695 m.
In addition to historical data (see Figure 1.6), Lander et al. (2011) used approximate Bayesian (ABC) computation on microsattellite markers to reconstruct the demographic scenarios of beech on Mont Ventoux. ABC analysis selected three populations as the most likely demographic scenario, with two remnant populations and one being recently expanded (Figure 1.7). The most supported scenario is scenario 7, with the South population diverging from the other populations twenty generations ago (approximately 1000 years), and the East and West populations diverging at t1. The analysis also identified a recent expansion from a smaller ancestral population that occurred 3 generations ago but did not reveal a past bottleneck. Microsatellites have a high mutation rate, ranging from 10-2 to 10-6
nucleotides per locus per generation (Sia et al. 2000), potentially explaining the fact that only recent events are detectable at short time scales. The bottleneck may also have not been sufficiently strong or have lasted sufficiently long to alter the genetic diversity of microsatellite markers. Moreover, the genetic signal of a bottleneck may be detectable after an intermediate number of generations have past (Estoup and Guillemaud 2010).
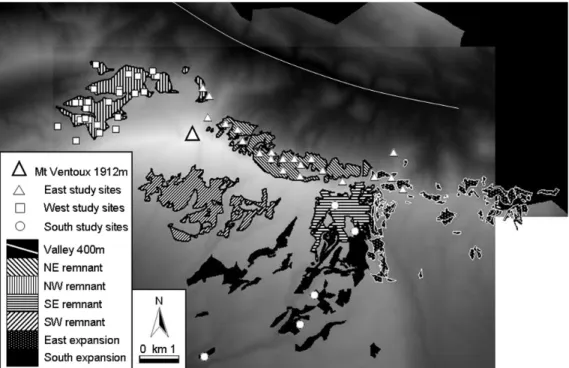
Figure 1.6. Areas of consistent beech presence since 1845 are indicated by polygons filled with black stripes. Areas where beech forest appears to have expanded between 1845 and 2000 are indicated in the east and south by polygons filled with points or solid colour (from (Lander et al. 2011).
Figure 1.7. The scenarios used in the DIYABC analysis. All eight scenarios assume that at the present time (0 years), there are three populations, East, South and West (E, S, W), and these three populations diverged from a single population in the past. Colour or pat- tern change in the branches of the coalescent tree indicates the possibility of population size change. The time scale is shown on the right (from Lander et al. 2011).
C
HAPTER
2.
1. C
ONTEXTThe first chapter of this PhD thesis addresses the selection of putative candidate genes that are involved in the physiological response to climate in the non-model species F. sylvatica. At the beginning of my PhD, no such candidate genes had been described for this species. The only genomic resources available in F. sylvatica were three ESTs banks that were developed by INRA Pierroton in the framework of the EVOLTREE network (http://www.evoltree.eu/index.php/elab-start/elab-est-finder). The first goal was to detect SNPs from the ESTs banks and to design primers for genotyping. However, there was a high risk of detecting false SNPs if the ESTs were poorly aligned, as in the case when conserved parts of different genes were aligned or low-complexity regions were aligned1. Moreover,
the ESTs banks were developed from 3 genotypes, which is a very low number for capturing the nucleotide diversity. Indeed, in silico detection of SNPs from EST banks in non-model species was demonstrated not be the optimum approach in experiments involving samples from narrow genetic backgrounds (Eckert et al. 2009, Lepoittevin et al. 2010). Moreover, the presence of introns is known to cause a high percentage of in silico SNP genotyping failures (Wang et al. 2008).
Instead, it was decided to first select putative candidate genes that are involved in the physiological response to climate in the EST banks, to design primers for sequencing these genes in F.sylvatica, and to sequence these genes in a panel of 96 individuals for SNPs discovery. With this second approach, no prior knowledge was required regarding the diversity within the sequences. In addition this approach allowed for all of the polymorphisms to be captured, including insertion-deletions (INDELs) and low-frequency mutations. The primary drawback of this approach was its reliance on an a priori hypothesis regarding the biological function of the selected candidate genes; this assumption necessarily resulted to the risk of arbitrariness.
Targeted candidate genes were defined as genes that are potentially involved in physiological processes that depend on climatic variables, such as temperature and air humidity. Two groups of candidate genes were selected, one involved in the date of budburst (hereafter, phenology genes) and a second involved in response to abiotic stress (hereafter, stress genes). For the phenology genes, the present study benefited from previous development of candidate genes for phenology in Quercus petraea (Derory et
al. 2006, 2010). The selection of candidate genes for the response to abiotic stress was more complex,
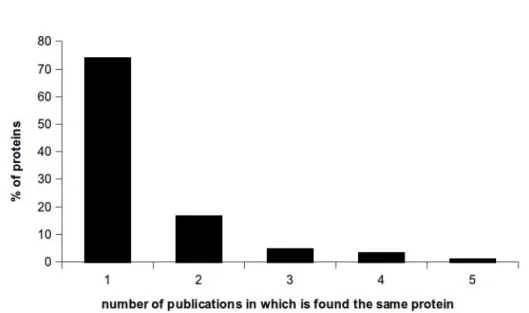
relying on i) candidate genes that were available from Quercus petraea and robur (A. Kremer and P. Garnier-Géré, personal communication), ii) sequences of three proteins that are potentially involved in cavitation resistance in F. sylvatica (S. Herbette, personal communication), and iii) published studies of genes expression profiles. Such studies typically measures the levels of proteins that are expressed in different environmental conditions or between two different stages of development of the plant. To identify the genes of the metabolic pathways that is involved in the response to a given stimuli. For example, to reveal genes that are involved in the response to drought, the expression profile from a plant grown under water-stress would be compared to a plant grown without water-stress. The genes observed to be activated or more highly expressed in drought conditions provide candidate genes for response to drought. The primary limitation of expression studies is that they generally report only the protein sequence, and not the DNA sequence, of the gene coding for the protein. Moreover, with such an approach, the candidate genes selected for further population genomic approach are only the genes that directly encode proteins that are involved in specific responses; the underlying assumption is that any change of the primary structure of the protein may be subjected to selection, the new allele being either advantageous or deleterious. Lastly, expressions studies are generally performed in model species (e.g., Arabidopsis taliana, Populus trichocarpa), and their results may not be transposable among species. To address this issue, I searched literature profile expression studies for cold, heat and drought stress to compile a list of potential list of genes/proteins, prioritizing the genes/proteins that were detected many times. Unfortunately, there is a high variability between the different experiments that were used in these studies; among the 750 proteins that were described in 55 studies, very few proteins are detected more than once (Figure 2.1).
Box 2 : Assembly and Alignment
Assembly: The aligning and merging fragments of DNA sequences to reconstruct the original sequence, which is also referred to as consensus sequence.
Alignment: The process by which several DNA, RNA or protein sequences are arranged against each other for comparison purposes and to identify regions of similarity. The alignment method greatly varies across algorithms and programs but generally relies first on identity, i.e., small stretches of sequences that are identical and or similar, which allows for sequence comparisons and the identification of base mismatch.
N
UCLEOTIDEDIVERSITY AND LINKAGEDISEQUILIBRIUM AT56
STRESS AND PHENOLOGY CANDIDATEGENES INE
UROPEANBEECH(F
AGUSSYLVATICAL.)
H. Lalagüe1,2,4, K. Csilléry2, S. Oddou-Muratorio2, J. Safrana2, S. de Quattro5, B. Fady2, S. C.
González-Martínez3, G.G. Vendramin4.
1) Scuola Superiore Sant'Anna, Piazza Martiri della Libertà 33, 56127 Pisa, Italy
2) INRA, UR629 Ecologie des Forêts Méditerranéennes (URFM), F-84914 Avignon, France
3) Department of Forest Ecology and Genetics, National Institute for Agriculture and Food Research and Technology (INIA) - Forest Research Centre (CIFOR), Madrid, Spain
4) Plant Genetics Institute, National Research Council, Via Madonna del Piano 10, 50019 Sesto Fiorentino (Firenze), Italy
Corresponding author: G. G. Vendramin
CNR, Plant Genetics Institute, Via Madonna del Piano 10, 50019 Sesto Fiorentino (Firenze), Italy E-mail: [email protected]
Tel: +39 055 5225725
Key words: drought, budburst phenology, recombination rate, genomic diversity, single nucleotide polymorphism (SNP), insertion deletion mutation