RESEARCH OUTPUTS / RÉSULTATS DE RECHERCHE
Author(s) - Auteur(s) :
Publication date - Date de publication :
Permanent link - Permalien :
Rights / License - Licence de droit d’auteur :
Bibliothèque Universitaire Moretus Plantin
Institutional Repository - Research Portal
Dépôt Institutionnel - Portail de la Recherche
researchportal.unamur.be
University of Namur
Influence of the nucleus area distribution on the survival fraction after charged
particles broad beam irradiation
Wéra, A. C.; Barazzuol, L.; Jeynes, J. C G; Merchant, M. J.; Suzuki, M.; Kirkby, K. J.
Published in:
Physics in Medicine and Biology DOI:
10.1088/0031-9155/59/15/4197 Publication date:
2014
Document Version Peer reviewed version Link to publication
Citation for pulished version (HARVARD):
Wéra, AC, Barazzuol, L, Jeynes, JCG, Merchant, MJ, Suzuki, M & Kirkby, KJ 2014, 'Influence of the nucleus area distribution on the survival fraction after charged particles broad beam irradiation', Physics in Medicine and Biology, vol. 59, no. 15, pp. 4197-4211. https://doi.org/10.1088/0031-9155/59/15/4197
General rights
Copyright and moral rights for the publications made accessible in the public portal are retained by the authors and/or other copyright owners and it is a condition of accessing publications that users recognise and abide by the legal requirements associated with these rights. • Users may download and print one copy of any publication from the public portal for the purpose of private study or research. • You may not further distribute the material or use it for any profit-making activity or commercial gain
• You may freely distribute the URL identifying the publication in the public portal ?
Take down policy
If you believe that this document breaches copyright please contact us providing details, and we will remove access to the work immediately and investigate your claim.
1
Influence of the nucleus area distribution on the survival
fraction after charged particles broad beam irradiation
Running Head: Influence of nucleus area distribution on survival fractionA.-C. Wéra 1, L. Barazzuol 1a, J. C. G. Jeynes 1, M. J. Merchant 1, M. Suzuki 2 and K. J. Kirkby 1
1
Ion Beam Centre, University of Surrey, Guildford, Surrey GU2 7XH, United Kingdom
2
Heavy Ion Medical Accelerator in Chiba (HIMAC), National Institute of Radiological Sciences (NIRS), Chiba, Japan
E-mail: [email protected]
Abstract
It is well known that broad beam irradiation with heavy ions leads to variation of the number of hit(s) received by each cell as the distribution of particles follows the Poisson statistics. Although the nucleus area will determine the number of hit(s) received for a given dose, the variation in the nucleus area amongst the irradiated cell population is generally not considered. In this work, we investigate the effect of the nucleus area distribution on the survival fraction. More specifically, this work aims to explain the deviation or tail which might be observed in the survival fraction at high irradiation doses. For this purpose, the nucleus area distribution was added to the beam Poisson statistics and the Linear-Quadratic model in order to fit the experimental data generated by broad beam irradiation with high energy heavy ions. As shown in this study, the nucleus size variation and the associated Poisson statistics can lead to an upward bending in the survival fraction after broad beam irradiation. The influence of the distribution parameters (mean area and standard deviation) were studied using a normal distribution. The influence of the Linear-Quadratic model parameters ( and ) is also shown. Finally, the model proposed here was successfully tested to the survival fraction of LN18 cells irradiated with a 85 keV/µm carbon ion broad beam for which the distribution in the area of the nucleus had been determined.
2
1. Introduction
Decades have passed since the introduction of charged particles in radiobiology. Going from radiotherapy to radiation protection, the study of the effect of charged particles on living matter is still of great importance particularly with the increasing interest in the use of particle therapy in radiation oncology. The beam configurations generally used to study the in vitro cell response with heavy charged particle accelerators are: broad beam (Jeynes et al. 2013, Schuff et al. 2002, Wéra et al. 2011, Scampoli et al. 2001) or micro-beam (Barberet et al. 2005, Cholewa et al. 1997, Folkard et al. 1997, Gerardi et al. 2005, Greif et al. 2004, Merchant et al. 2012). Although broad beams are associated with an inherent variation in the number of hit(s) per individual cell as the particle distribution follows a Poisson statistics, they are easier to implement and the large quantity of simultaneously irradiated cells made them a tool of choice to determine the survival fraction, the gold standard measurement in radiobiology.
Over the years a significant amount of work has been done to model the experimental survival curves, these include the Linear-Quadratic (LQ) model, the lethal-potentially lethal (LPL) model, the local effect model (LEM) (Curtis 1986, Joiner and Kogel 2009, Scholz and Kraft 1996). However, although the Poisson distribution in the position of the incident particles is taken into account in some works (Heuskin et al. 2013, Kundrat et al. 2005, Pugliese et al. 1997), the nucleus size variation amongst the irradiated cell population is generally not considered, even if this will determine the probability of hit(s) received by the nucleus of a given cell. The importance of the nucleus area is highlighted in the paper of Konishi et al. (Konishi et al. 2005) where two cell lines were irradiated with the same fluence and the nucleus area was measured. The cell lines used were cervix carcinoma HeLa cells (average nucleus area: 219 µm²) and Chinese hamster ovary CHO-K1 cells (average nucleus area: 127 µm²). After irradiation with 1.14 MeV/nucleon Fe ions at fluences ranging from 1 to 10x106 particles/cm², the inactivation cross section obtained were 96.8 ± 1.8 and 57.9 ± 5.4 µm² for HeLa and CHO-K1 cells, respectively. After normalisation of the inactivation cross section with the mean nucleus area, the ratio obtained, i.e. 0.442 ± 0.008 and 0.456 ± 0.039 for HeLa and CHO-K1 cells, respectively, show that approximately the same number of ions per nucleus was needed to cause cell death. This indicates that the nucleus size should be taken into account when comparing the survival
3
fraction of two cell lines after irradiation with broad particle beams. In addition, a deviation, known as ‘tail’ effect, from the LQ model can be observed at high doses as shown by Belli et al. after irradiation of V79 and SQ20B cells with 30 to 35 keV/µm protons (Belli et al. 2000, Belli et al. 1989) or Folkard et al. after irradiation of V79 cells with 88 and 105 keV/µm alpha particles (Folkard et al. 1996). This deviation or tail was associated to poorly attached or shielded cells receiving an attenuated dose. These cells might strongly affect the survival fraction, especially at high doses. For example, we can consider cancer cells with a plating efficiency of 50% and with a parameter equal to 1.5 Gy-1 after irradiation with 100 keV/µm alpha particles. Without shielded cells, the survival fraction at 5 Gy will be equal to 5.5x10⁻⁴. Now, if 1% of the cell were shielded, the survival fraction will be equal to 5.5x10⁻³ (0.99 x 5.5x10-4 + 0.01), thus about 20 times higher. From these observations, the results obtained at higher doses presenting a plateau or tail were associated with shielding and survival fractions were either not reported beyond 5 Gy or in some cases fitted with a negative parameter. Nevertheless, even if the irradiation systems and the cell handling were improved to avoid cell shielding, a tail or a plateau region can be still observed at high doses. With their model, the probabilistic two-stage model, Kundrát et al. present a successful attempt to fit the plateau obtained by Folkard et al. (Kundrat 2006). They showed that, at high doses, the integration of repair processes into the calculation of the survival fraction might lead to an upward bending but emphasize that additional experimental data are needed to test this hypothesis.
In this work we propose a model integrating the distribution in nucleus area and associated Poisson statistics to the LQ model and apply it to the results obtained after irradiation of LN18 glioblastoma cells with 85 keV/µm carbon ions. More specifically, this work aims to explain the deviation or tail observed at high radiation doses.
4
2. Material and Method 2.1. Broad beam dosimetry
In general terms, the absorbed dose is defined as the energy imparted by ionising radiation to matter per unit of mass (J/kg or Gy).
In the case of in vitro irradiation of a monolayer of cells with heavy charged particles, the macroscopic dose delivered from an ion fluence (particles/cm²) can be given as:
) ( 10 x 6 . 1 9 Gy LET D (1)
Where, LET is the Linear Energy Transfer (keV/µm), the cell density (g/cm³) and 1.6x10⁻⁹ a unit conversion constant. From the LET, the chosen doses are reached by adapting the fluence.
At the cell scale, broad beam irradiation is a statistical process where the probability of n hit(s) within the nucleus of a cell is given by the Poisson statistics:
0 ! ) ( ) ( 0 N n e n N n p (2)
Where N is the number of incident ions over the irradiated area (A), and 0 is the ratio of the area of
interest (i.e. the nucleus area, a) (cm²) and the irradiated area (cm²), a/A. Finally, N0 represents the
mean number of hit(s) per nucleus (Heuskin et al. 2011). As is equal to N/A, N0 can be expressed
as a. From equation 1 and 2, we can note that, while number of hit(s) per nucleus is related to the nucleus area, the nucleus area is not taken into account to determine the required fluence, to achieve a given dose, D.
2.2. Integration of the nucleus size variation in the survival fraction
The nucleus area can be widely distributed within a cell line leading to a wider distribution of the number of hit(s) per nucleus than the one due to the inherent Poisson statistics of the broad beam. Indeed, for a given number of incident ions, the probability of being hit is related to the nucleus area, if this changes, the probability will change as well.
Finally, the overall cell population survival fraction, SF, will be a linear combination of the individual survival fraction, SFi, corresponding to each nucleus area and will be given by:
5
i i i SF y SF (3)Where i refers to the ith nucleus area and yi the corresponding weight (i.e the proportion of cells with
the same nucleus size) of a discrete distribution of nucleus size.
Each individual survival fraction, SFi, being related to its own Poisson statistics, where n is the
number of hit(s):
n i i p n SF D n SF ( ) ( ( )) (4)With SF(D(n)) being the survival fraction associated to D(n), the macroscopic dose corresponding to n hits. This formula can be expressed as:
n n D n D a n i i e e n a SF i ( ) ( )² ! (5)Where ai corresponds to the i
th
nucleus size, and are the radio-sensitivity parameters of the LQ model. The use of the same and for each individual survival fraction assumes that the cell response is not related to the nucleus size. This assumption implies that no tail should be observed after irradiation with a micro-beam and, although limited data are available, to the best of our knowledge no tail has been reported (Schettino et al. 2001, Zhou et al. 2000).
From equation 1, the fluence, can be replaced and SF is thus given by:
i n n D n D LET a D n i i e e n LET a D y SF i )² ( ) ( 10 x 6 . 1 9 9 ! 10 x 6 . 1 (6)Finally, D(n) can be replaced by:
mean a n LET n D 9 10 x 6 . 1 ) ( (7)
Where amean is the mean nucleus area (cm²). The approximations done here are that energy imparted
by hit is the same for each particle and that the energy deposited by one hit is the same regardless of the nucleus size. The first approximation is done for simplification even if the energy deposition is a stochastic process. The assumption that the same energy is deposited by one hit regardless of the
6
nucleus size is also taken during micro-beam experiments where the cell nuclei are irradiated with the same number of ions without considering the nucleus size.
2.3. Cells culture and irradiation
LN18 glioblastoma cells were obtained from the American Type Culture Collection (ATCC, Middlesex, UK) and were confirmed Mycoplasma-free before use. The cells were cultured in Eagle’s Minimum Essential Medium (EMEM) containing 10% foetal bovine serum, 1% penicillin/streptomycin, 4 mM L-glutamine, 1 mM sodium pyruvate, 1500 mg/L sodium bicarbonate, and 1% MEM eagle non-essential amino acids (Lonza, Berkshire, UK). Cells were maintained at 37°C with 5% CO2 and 80% humidity, and passaged weekly by exposing them in 0.25%
trypsin/versene and then re-suspended in growth medium.
Cells were irradiated with 85 keV/µm carbon-ion (265 MeV) beams accelerated by the Heavy Ion Medical Accelerator in Chiba (HIMAC) at National Institute of Radiological Sciences (NIRS) in Japan. The cells were irradiated in broad field as described elsewhere (Futami et al. 1999, Kanai et al. 1999, Suzuki et al. 2000, Torikoshi et al. 2007).
2.4. Clonogenic assay
As described in (Barazzuol et al. 2014), cells were irradiated in T25 flasks (Nunc, New York, USA) at 80% confluence. After irradiation, cells were seeded in 6-well plates under appropriate conditions and incubated for up to 14 days. Cells were fixed with 50% ethanol in phosphate-buffered saline (PBS) and finally stained with crystal violet. The colonies presenting more than 50 cells were scored to determine the plating efficiency of control cells and irradiated cells. The associated survival fraction was calculated based on three independent experiments.
2.5. Nucleus area measurement
Cells were cultured in Lab-Tek flasks on microscopic slide (Nunc, New York, USA) at 80% confluence to match the conditions used for the irradiation. Cells were fixed in paraformaldehyde, washed three times with PBS and permeabilized in 0.2% Triton-X100 in PBS (Sigma-Aldrich, Dorset,
7
UK) for 5 min at room temperature. Cells were stained with 2.5 µg/ml DAPI (4',6-diamidino-2-phenylindole dilactate) (Invitrogen, Oregon, USA) (100 ng/ml) in PBS for 1 min in the dark at room temperature. After three PBS washes, coverslips were mounted with 10 µl of Prolong Gold anti-fade reagent (Invitrogen, Oregon, USA). Samples were analysed using a fluorescent microscope (Nikon Eclipse Ci) with a 40 times objective. The image analysis software of the microscope was used to measure the nucleus area.
3. Results
3.1. Influence of the nucleus area distribution on the survival fraction
This part studied the influence of the term yi in equation 3 on the survival fraction. To determine the
influence of both the mean and the spread of the nucleus area over a population of cells, we used a normal distribution characterized by a mean, amean, and a standard deviation, . For the following
simulations, the radio-sensitivity parameters and have been set to 1.50 Gy-1 and 0.0 Gy-2, respectively and the LET, determining the fluence, was set to 100 keV/µm.
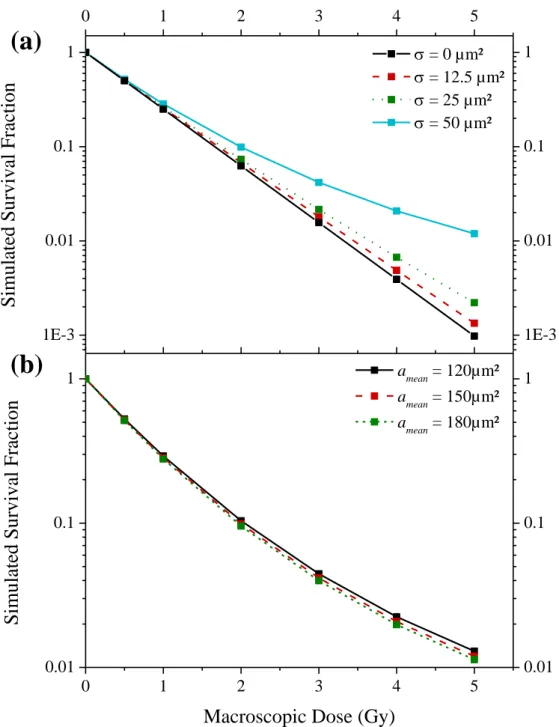
Firstly, the influence of the standard deviation was studied with a distribution characterized by a mean value of 150 µm² (Figure 1a). One can observe a tail at high doses for the wider distribution. This is due to the smaller nuclei for which the average number of hit(s) is lower. Indeed, for a dose of 5 Gy, the nucleus with a mean area of 150 µm² will receive 46.9 hits in average while the 50 µm² area nuclei will only receive 15.6 hits. For comparison, the results obtained for equal to 0 µm², i.e. a constant size value, are also displayed.
The influence of the mean is shown in Figure 1b in which the standard deviation was kept to a third of the mean. We can observe a small decrease in the survival fraction with the increase of the mean nucleus area; however, the tail seems not to be influenced.
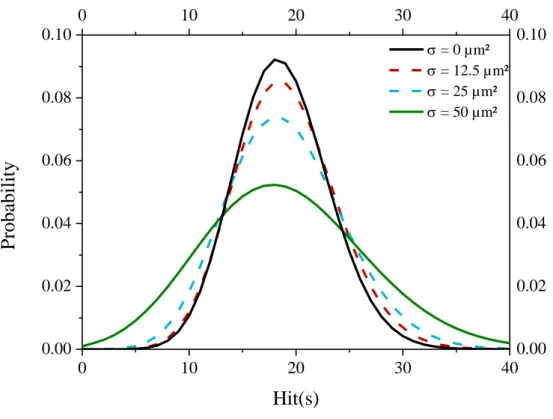
Finally, the influence of the standard deviation, , on the hit probability is presented in Figure 2. The probability of n hit(s) is calculated from the Poisson distribution of the beam for a dose of 2 Gy at a
8
LET of 100 keV/µm (N = 12.5x10⁶ particles) and normal nucleus area distribution (amean = 150 µm²)
and is given by:
i i i y n p n p( ) ( ) .Where i refers to the ith nucleus area and yi the corresponding weight, in this case given by a discrete
normal distribution. Figure 2 presents the hit probability for different standard deviation. For a
corresponding to 0 µm², the variation in the number of hit is due to Poisson statistics. While the mean number of hit is equal to 18.75, we can observe that an increasing standard deviation leads to an increased variation in the number of hit(s) per nucleus.
9
Figure 1: Influence of the nucleus area distribution on a survival fraction with radio-sensitivity parameters set to 1.50 Gy-1 and 0.0 Gy-2. The survival fraction has been simulated for different doses (linked squares). (a): Influence of the standard deviation of the distribution (mean nucleus area: 150 µm²). (b): Influence of the mean of the distribution, the standard deviation was set to a third of the mean, i.e. 40, 50 and 60 µm² respectively.
1E-3 0.01 0.1 1 0 1 2 3 4 5 1E-3 0.01 0.1 1
Simu
la
te
d Su
rvival Fra
ct
ion
= 0 µm² = 12.5 µm² = 25 µm² = 50 µm² 0 1 2 3 4 5 0.01 0.1 1 0.01 0.1 1Simu
la
te
d Su
rvival Fra
ct
ion
Macroscopic Dose (Gy)
amean = 120µm² amean = 150µm² amean = 180µm²
(a)
10
Figure 2: Influence of the standard deviation of the nucleus area distribution on the hit probability for a dose of 2 Gy with a LET of 100 keV/µm.
3.2. Influence of α and β on the survival fraction
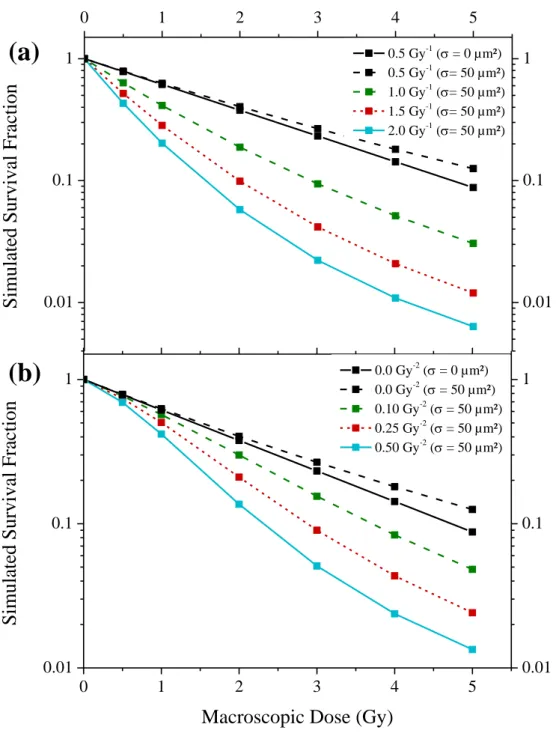
To study the influence of the parameter, the mean nucleus size was set to 150 µm² and the standard deviation to 50 µm². The results obtained with a parameter set to 0.0 Gy-2 are presented in Figure 3a. The results highlight that a higher value of is required to obtain a tail. For comparison, the results obtained for a constant nucleus area are also displayed for set to 0.5 Gy-1.
The influence of the parameter was studied with the same nucleus size distribution. The simulations were performed for a parameter of 0.50 Gy-1 (Figure 3b). As expected, the results show a decreasing shouldered survival fraction with an increasing parameter. Moreover, the increase of the parameter combined with the wide nucleus size distribution leads to a concave curve related to a tail. This is the case even when the value of the parameter (with a parameter set to 0.0 Gy-2) would mean that no tail was observed. For comparison, the results obtained for a constant nucleus area are also displayed for set to 0.0 Gy-2.
0 10 20 30 40 0.00 0.02 0.04 0.06 0.08 0.10 0 10 20 30 40 0.00 0.02 0.04 0.06 0.08 0.10 = 0 µm² = 12.5 µm² = 25 µm² = 50 µm²
Prob
abili
ty
Hit(s)
11
Figure 3: Influence of the radio-sensitivity parameter on a survival fraction characterised by a normal distribution of the nucleus area (mean: 150 µm², standard deviation: 50 µm²). The survival fraction has been simulated for different doses (linked squares). (a): Influence of the parameter with set to 0.0 Gy-2. (b): Influence of the parameter with set to 0.50 Gy-1 . 0.01 0.1 1 0 1 2 3 4 5 0.01 0.1 1
Simu
la
te
d Su
rvival Fra
ct
ion
0.5 Gy-1 ( = 0 µm²) 0.5 Gy-1 (= 50 µm²) 1.0 Gy-1 (= 50 µm²) 1.5 Gy-1 (= 50 µm²) 2.0 Gy-1 (= 50 µm²) 0 1 2 3 4 5 0.01 0.1 1 0.01 0.1 1Simu
la
te
d Su
rvival Fra
ct
ion
Macroscopic Dose (Gy)
0.0 Gy-2 ( = 0 µm²) 0.0 Gy-2 ( = 50 µm²) 0.10 Gy-2 ( = 50 µm²) 0.25 Gy-2 ( = 50 µm²) 0.50 Gy-2 ( = 50 µm²)
(a)
(b)
12
3.3. The case of low LET irradiation with low radio-sensitivity parameter
If the cell irradiation is performed with low LET, than the number of incident particles increases to reach a chosen dose. This means that for a given nucleus size, the Poisson distribution influence is limited on the dose variation for a given nucleus area. Indeed, for an increasing number of incident particles (N), the relative variation in the number of hit(s) per nucleus decreases and a good approximation is that the probability of the mean number of hit(s), p(N0), is equal to 1. Thus, each
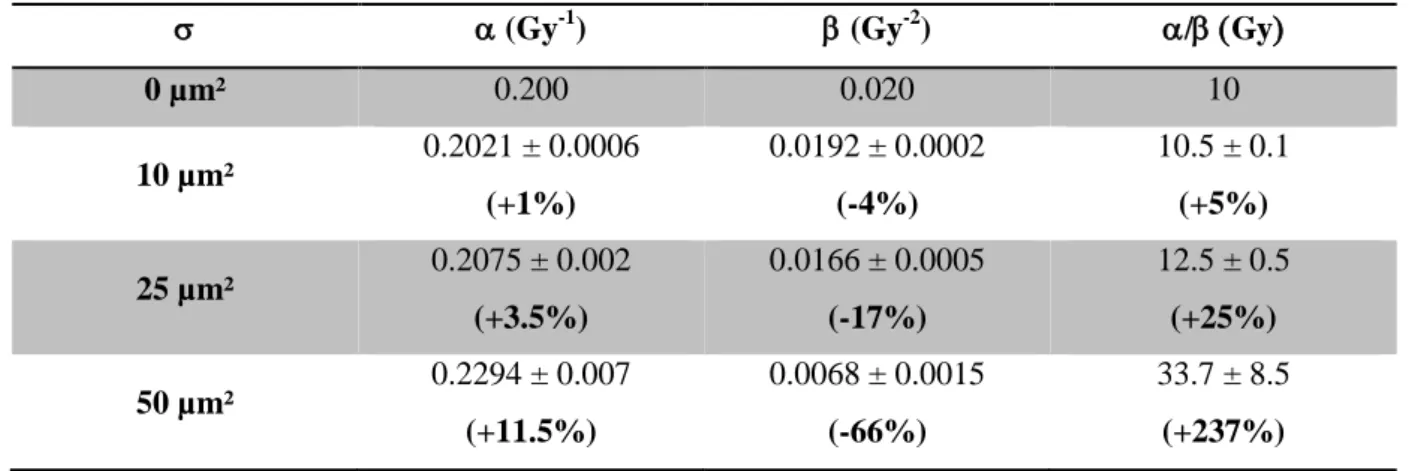
cell with the same nucleus size will receive the same number of hit(s). In other words, the variation in the number of hit(s) per nucleus amongst a cell population is only related to the nucleus size variation and not to the Poisson distribution of the beam. Moreover, for low LET, the and parameter are generally small and this will limit the influence of the nucleus size variation. Figure 4 presents an example for and equal to 0.2 Gy-1 and 0.02 Gy-2, respectively. The mean nucleus size is set to 150 µm² and the standard deviation to 0, 10, 25 and 50 µm².
One can observe that, for low radio-sensitivity parameter, a slight upward bending of the survival fraction is only observed in the case of wide distribution ( set to 50 µm²) and for high doses (above 10 Gy). For narrower distribution, no tail is observed at high dose but a linear behaviour might be observed. Moreover, the simulated data have been fitted with the LQ model using Origin 8.6 (OriginLab) and ² minimisation method. The calculated parameters and the calculated ratio are presented in Table 1. The relative variation of the parameter in comparison to the initial ones ( = 0.2 Gy-1, 0.02 Gy-2) are also presented.
13
Figure 4: Influence of the nucleus area distribution in the case of low LET irradiation. The and parameter are set to 0.2 Gy-1 and 0.02 Gy-2 for the calculation. The mean nucleus size is set to 150 µm². The survival fraction has been simulated for different doses (square) and afterward fitted with the LQ model (line).
Table 1: Radio-sensitivity parameter obtained after the LQ model fit of the simulated survival fraction for different nucleus size standard deviation in the case of low LET irradiation and calculated ratio. The relative variation from the initial parameter is indicated.
(Gy-1) (Gy-2) /Gy 0 µm² 0.200 0.020 10 10 µm² 0.2021 ± 0.0006 (+1%) 0.0192 ± 0.0002 (-4%) 10.5 ± 0.1 (+5%) 25 µm² 0.2075 ± 0.002 (+3.5%) 0.0166 ± 0.0005 (-17%) 12.5 ± 0.5 (+25%) 50 µm² 0.2294 ± 0.007 (+11.5%) 0.0068 ± 0.0015 (-66%) 33.7 ± 8.5 (+237%) 0 2 4 6 8 10 12 14 1E-4 1E-3 0.01 0.1 1 0 2 4 6 8 10 12 14 = 0 S imu la te d Su rv iv al F ra cti o n 0 2 4 6 8 10 12 14 0 2 4 6 8 10 12 14 1E-4 1E-3 0.01 0.1 1 = 10 µm² LQ Model 0 2 4 6 8 10 12 14 1E-3 0.01 0.1 1 = 25 µm² LQ Model S imu la te d Su rv iv al F ra cti o n
Macroscopic Dose (Gy)
0 2 4 6 8 10 12 14 1E-3 0.01 0.1 1 = 50 µm² LQ Model
14 3.4. Application to experimental data
3.4.1. LN18 survival fraction after 85 keV/µm carbon ion irradiation.
LN18 glioblastoma cells were irradiated with a 85 keV/µm carbon ion broad beam. The survival fraction obtained is presented in Figure 5a. The experimental data have been fitted with a linear model using Origin 8.6 (OriginLab) and ² minimisation method. The determined radio-sensitivity parameter
is equal to 1.46 ± 0.035 Gy-1. The ² value obtained from the fitted survival is 26.2, corresponding to a reduced ² of 3.84.
On this figure, we can observe a deviation between the experimental data and the linear model at higher doses.
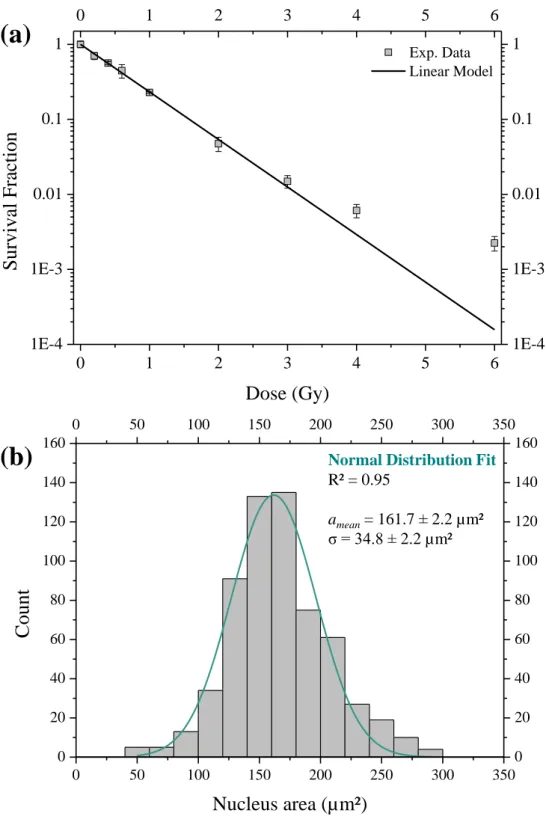
The nucleus area was determined from the DAPI staining of the DNA content and the distribution is presented in Figure 5b from the measurement of 612 cells. A normal fit of these data gave a mean size, amean, of 161.7 µm² and a standard deviation, , of 34.8 µm².
15
Figure 5: (a): LN18 glioblastoma cells survival fraction after 85 keV/µm broad carbon ions beam irradiation. Filled square: experimental data; straight line: linear model fit (= 1.46 ± 0.02 Gy-1
). (b): Nucleus area distribution of 612 LN18 cells and normal fit.
(a)
(b)
0 1 2 3 4 5 6 1E-4 1E-3 0.01 0.1 1 0 1 2 3 4 5 6 1E-4 1E-3 0.01 0.1 1 Exp. Data Linear ModelSu
rvival Fra
ct
ion
Dose (Gy)
0 50 100 150 200 250 300 350 0 20 40 60 80 100 120 140 160 0 50 100 150 200 250 300 350 0 20 40 60 80 100 120 140 160Co
un
t
Nucleus area (µm²)
Normal Distribution Fit
R² = 0.95
amean= 161.7 2.2 µm² σ = 34.8 2.2 µm²
16
The formulation of the survival fraction described in this paper was used to try to fit the experimental data and more particularly the deviation at high doses.
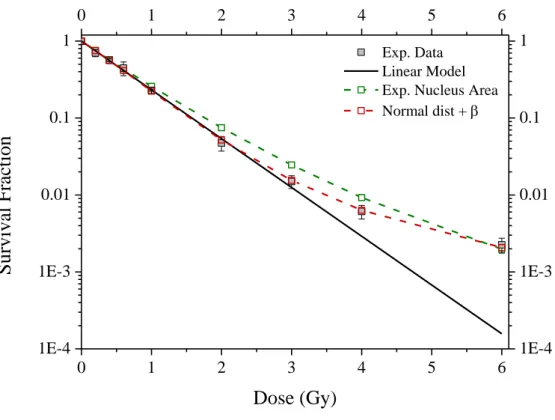
We firstly used the measured nucleus area and a parameter equal to 1.46 Gy-1 (Figure 6). We can observe that the use of the nucleus area distribution leads to a tail at high doses, which matches the survival at 6 Gy. However, the nucleus area distribution leads to an overestimation of the survival fraction at medium doses (from 1 to 4 Gy) leading to a calculated ² of62.5.
To obtain a better fit of the experimental data, a python program integrating a nucleus area normal distribution, the associated Poisson statistics and the LQ model was built. The python version 2.7.3 (https://www.python.org/download/releases/2.7.3/) was used with the numpy package 1.6.0. The python optimizer (Nelder-Mead method) was used for the least square minimization on the logarithm of the survival fraction. The parameter and standard deviation found are 0.306 Gy-2 and 47.7 µm² leading to a ² equal to 1.92, corresponding to a reduced ² of 0.384 which 10 times lower than the one obtained with the linear model and below 1.
17
Figure 6: LN18 glioblastoma cells survival fraction after 85 keV/µm broad carbon ions beam irradiation. Filled square: experimental data; straight line: linear model fit (= 1.46 Gy-1); green dashed line linked open square: linear model integrating the measured nucleus area; red dashed line linked open square: linear-quadratic (= 1.46 Gy-1, = 0.306 Gy-2) model integrating a nucleus area normal distribution (=47.7 µm²).
3.4.2. V79-379A survival fraction after 88 and 105 keV/µm alpha particles irradiation.
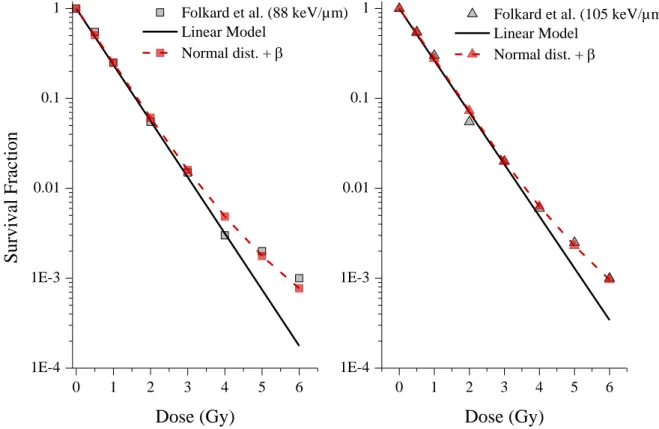
This model was also tested on the data generated by Folkard et al. after irradiation of V79-379A cells with 88 and 105 keV/µm alpha particles (Folkard et al. 1996) for which a tail was observed. The data were fitted using the same method and the results obtained are presented in Figure 7. The best fits obtained lead to equal to 0.196 Gy-2 and to 23.3 µm² (for amean set to 100 µm²) for 88 keV/µm
alpha particles and to equal to 0.198 Gy-2 and to 22.9 µm² for 105 keV/µm. The area distributions found by the optimizer are in very good agreement (within 2%).
0 1 2 3 4 5 6 1E-4 1E-3 0.01 0.1 1 0 1 2 3 4 5 6 1E-4 1E-3 0.01 0.1 1
Su
rvival Fra
ct
ion
Dose (Gy)
Exp. Data Linear Model Exp. Nucleus Area Normal dist + 18
Figure 7: V79-379A survival fraction after irradiation with 88 keV/µm (left) and 105 keV/µm (right) alpha particles (data taken from (Folkard et al. 1996)). Experimental data (grey square and triangle), linear model (straight line), linear-quadratic model integrating a nucleus area normal distribution (linked red square and triangle).
4. Discussion and Conclusions
The gold standard measurement in radiobiology is the survival fraction and when it comes to heavy charged particles, broad beam are generally used as they enable a large number of cells to be irradiated simultaneously. The survival curves obtained after irradiation are generally fitted using the Linear-Quadratic model, or Linear model for higher LET radiations. However, at high doses, a deviation from these models can be observed as shown by Belli et al. (Belli et al. 2000, Belli et al. 1989) or Folkard et al. (Folkard et al. 1996). These tails have been associated to shielded cells, and although, a shielding effect of some cells may arise in some experimental set-ups or from the use of low energy particles, this might not be the only explanation.
In this paper, we asked the question about the influence of the area of the nucleus and its size distribution on the survival fraction and especially how this might explain some of the tail observed at higher doses. The model proposed in this study integrates the nucleus size distribution and the
0 1 2 3 4 5 6
1E-4 1E-3 0.01 0.1
1 Folkard et al. (88 keV/µm) Linear Model Normal dist. +
Sur
vival Fr
ac
tion
Dose (Gy)
0 1 2 3 4 5 6 1E-4 1E-3 0.01 0.11 Folkard et al. (105 keV/µm) Linear Model
Normal dist. +
19
associated Poisson statistics into the LQ model and shows that this distribution can lead to an upward bending in the survival curve at high doses. The influence of the nucleus area distribution was studied using a normal distribution and highlighted, as expected, the strong influence of the standard deviation, , for a minor contribution of the mean size, amean. This small contribution is related to the
normalisation of the dose, D(n), to the mean area, amean (Equation 7). The strong influence of is due
to the increasing variation of the hit probability as shown in Figure 2. More particularly, it is due to the increase probability of a lower number of hit(s) per nucleus due to the presence of small nuclei. For a given distribution, we have studied the influence of the LQ parameters, and , and we showed that, for set to 0.0 Gy-2, α value higher than 0.5 Gy-1 is required to lead to a tail in the survival fraction even if a wide distribution is used. However, increasing parameter can lead to a plateau region even for small parameter. The presence of an upward bending for increasing parameter is related to an increase in the weight of the smaller nucleus. More particularly, the appearance of a tail with an increasing parameter is due to the exponential behaviour of SF(n). Indeed, a larger nucleus will be strongly affected by an increase of the parameter with respect to smaller nuclei. For example, for the normal nucleus area distribution used here, the two extreme nucleus areas, corresponding to a yi ≃ 0.003, are 10 µm² and 290 µm². For 10 µm², the overall
survival fraction at 5 Gy given by p (n)SF(n)
n i
, is equal to 0.85 and 0.63 for parameters equal to 0.5 and 1.5 Gy-1, respectively. These values have the same order of magnitude. For of 290 µm², the survival fraction are 9x10⁻³ and 1.5x10⁻⁶ for parameters equal to 0.5 and 1.5 Gy-1, respectively, corresponding to a decrease of more than two orders of magnitude. This small example highlights the dramatic influence of the parameter increase on the overall survival for the larger nucleus. As the increase of the parameter, the appearance of a tail with increasing parameter is due to the exponential behaviour of the survival fraction and its influence on larger nuclei with respect the smaller ones.The case of low LET has also been studied and highlighted that, for low LQ parameter, an upward bending will be observed only for wide nucleus size distribution and only at very high doses (above
20
10 Gy). As the model proposed here is based on geometric consideration (nucleus size) and not on the energy deposition process, we think that the observations made for low LET particles can be extended to X-rays survival curve. This can explain the linear behaviour which might be observed at high doses and cannot be fitted with the LQ model as shown by Garcia et al. (Garcia et al. 2006). Moreover, the simulated survival points have been fitted with the LQ model and the change in the radio-sensitivity parameter obtained increases with the standard deviation. As the distribution of nucleus area becomes wide, tends to increase while decreases with variation up to 11.5% and 66%, respectively. Consequently, the calculated changes drastically to reach more than three time the initial value for the wider size distribution. In other words, the nucleus size distribution amongst the irradiated cell population will change the obtained survival fraction and if the size distribution is not taken into account, the obtained radio-sensitivity parameters will not be the intrinsic ones as shown in Table 1. Finally this model was used to fit the survival data obtained after irradiation of LN18 cells with 85 keV/µm carbon ions where the tail that was observed at higher doses could not be explained by shielded cells. Indeed, the HIMAC facility delivers a beam with a spot size larger than the T25 flask and the range in water of 265 MeV carbon ions is more than 1.5 mm. The measured nucleus areas of the LN18 cells were used and the results presented in Figure 6. These display a tail and the use of the
parameter allows us to match the survival at medium doses as well. The reason why the standard deviation found from the minimization method is higher than the one found from the fit of the nucleus size measurement (47.7 µm² instead of 34.8 µm²) is because of the probability of smaller nucleus. Indeed, the measurement show that the probability of having a 50 µm² nucleus is ~8x10⁻³, with a 47.7 µm² normal distribution this probability is equal to 9.7x10⁻³ and falls to 1.1x10⁻³ for 34.8 µm² distribution. This model was also successfully tested on the data by Folkard et al. after irradiation of V79-379A cells with 88 and 105 keV/µm alpha particles (Folkard et al. 1996) for which a tail was observed. As presented in the results section, a parameter was used in combination to the nucleus area distribution in order to fit the experimental data.
A further step for this work would be to consider the stochastic nature of the energy deposition as well as consider the effect of the track structure and more particularly the non-zero radial extension of the
21
track. Indeed, as shown in the commentary of Cucinotta et al. (Cucinotta et al. 1998), the width of an ion track due to the lateral extension of secondary electron can be considerable. They showed that for 20 MeV/nucleon carbon ions and 100 µm² cells, the track area (core + penumbra) can be around 10 times higher than the cell area for an energy cut-off set to 1 mGy leading to the possible irradiation of adjacent cells. Moreover, this means that the smaller is the nucleus the higher is the probability that part of the energy will be deposited outside the nucleus. In addition to the Poisson statistics, this lead to a further decrease of the macroscopic dose associated to smaller nuclei compared to larger ones.
To conclude, we highlighted the influence of the nucleus area distribution on the survival fraction and especially at high doses and where this can lead to a deviation from the LQ model. Although this tail (or plateau) can be related to shielded cells for low energy and/or small beam irradiation, it is also being found after high energy broad beam irradiation. We have shown that the determination of the nucleus area distribution and its integration into the calculation of the survival fraction should be taken into account and might explain the observed results.
In addition, we showed that, by taking into account the area distribution of the nucleus, a positive parameter can be used to obtain a better fit of the survival fraction measured after high LET irradiations. Moreover, we showed that, for low LET radiation, the nucleus size variation will influence the survival fraction and thus might lead to an erroneous calculation of the radio-sensitivity parameter and consequently of the / ratio. These finding are of interest for treatment planning as the / ratio might be used in addition to the relative biological effectiveness.
Acknowledgment:
The authors report no conflict of interest. This work has been supported by Marie Curie Actions - Initial Training Networks (ITN) as an Integrating Activity Supporting Postgraduate Research with Internships in Industry and Training Excellence (SPRITE) under EC contract no. 317169B and PARTNER through European Community’s Seventh Framework Programme under grant agreement n°215840-2 and in part by the Research Project with Heavy Ions at NIRS-HIMAC.
22
References
Barazzuol L., Jeynes J. C., Merchant M. J., Wéra A.-C., Barry M., Kirkby K. J. and Suzuki M. 2014. Radiosensitisation of glioblastoma cells using a histone deacetylase inhibitor (SAHA) comparing carbon ions with X-rays in press Int. J. Radiat. Biol.
Barberet P., Balana A., Incerti S., Michelet-Habchi C., Moretto P. and Pouthier T. 2005. Development of a focused charged particle microbeam for the irradiation of individual cells. Rev. Sci. Instrum., 76, 015101.
Belli M., Bettega D., Calzolari P., Cera F., Cherubini R., Dalla Vecchia M., Durante M., Favaretto S., Gialanella G., Grossi G., Marchesini R., Moschini G., Piazzola A., Poli G., Pugliese M., Sapora O., Scampoli P., Simone G., Sorrentino E., Tabocchini M. A., Tallone L. and Tiveron P. 2000. Inactivation of human normal and tumour cells irradiated with low energy protons. Int. J. Radiat. Biol., 76, 831-839.
Belli M., Cherubini R., Finotto S., Moschini G., Sapora O., Simone G. and Tabocchini M. A. 1989. RBE-LET relationship for the survival of V79 cells irradiated with low energy protons. Int. J. Radiat. Biol., 55, 93-104.
Cholewa M., Saint A., Legge G. J. F. and Kamiya T. 1997. Design of a single ion hit facility. Nucl. Instrum. Methods Phys. Res. B., 130, 275-279.
Cucinotta F. A., Nikjoo H. and Goodhead D. T. 1998. The effects of delta rays on the number of particle-track traversals per cell in laboratory and space exposures. Radiat. Res., 150, 115-119.
Curtis S. B. 1986. Lethal and potentially lethal lesions induced by radiation--a unified repair model. Radiat. Res., 106, 252-270.
Folkard M., Prise K. M., Vojnovic B., Newman H. C., Roper M. J. and Michael B. D. 1996. Inactivation of V79 cells by low-energy protons, deuterons and helium-3 ions. Int. J. Radiat. Biol., 69, 729-738.
Folkard M., Vojnovic B., Prise K. M., Bowey A. G., Locke R. J., Schettino G. and Michael B. D. 1997. A charged-particle microbeam: I. Development of an experimental system for targeting cells individually with counted particles. Int J Radiat Biol, 72, 375-385.
Futami Y., Kanai T., Fujita M., Tomura H., Higashi A., Matsufuji N., Miyahara N., Endo M. and Kawachi K. 1999. Broad-beam three-dimensional irradiation system for heavy-ion radiotherapy at HIMAC. Nucl. Instrum. Methods Phys. Res. A., 430, 143-153.
Garcia L. M., Leblanc J., Wilkins D. and Raaphorst G. P. 2006. Fitting the linear–quadratic model to detailed data sets for different dose ranges. Phys. Med. Biol., 51, 2813.
Gerardi S., Galeazzi G. and Cherubini R. 2005. A microcollimated ion beam facility for investigations of the effects of low-dose radiation. Radiat. Res., 164, 586-590.
Greif K. D., Brede H. J., Frankenberg D. and Giesen U. 2004. The PTB single ion microbeam for irradiation of living cells. Nucl. Instrum. Methods Phys. Res. B., 217, 505-512.
Heuskin A.-C., Michiels C. and Lucas S. 2013. Toward computer simulation of high-LET in vitro survival curves. Phys. Med. Biol., 58, 6495.
Heuskin A. C., Wéra A. C., Riquier H., Michiels C., Bulgheroni A., Jastrzab M., Caccia M. and Lucas S. 2011. On the comparison of three methods of assessing beam quality for broad beam in vitro cell irradiation. Nucl. Instrum. Methods Phys. Res. B., 269, 3132-3136.
Jeynes J. C. G., Merchant M. J., Barazzuol L., Barry M., Guest D., Palitsin V. V., Grime G. W., Tullis I. D. C., Barber P. R., Vojnovic B. and Kirkby K. J. 2013. “Broadbeam” irradiation of mammalian cells using a vertical microbeam facility. Radiat. Environ. Biophys., 1-9. Joiner M. and Kogel A. V. D. 2009. Basic Clinical Radiobiology, Hodder Arnold.
Kanai T., Endo M., Minohara S., Miyahara N., Koyama-Ito H., Tomura H., Matsufuji N., Futami Y., Fukumura A., Hiraoka T., Furusawa Y., Ando K., Suzuki M., Soga F. and Kawachi K. 1999. Biophysical characteristics of HIMAC clinical irradiation system for heavy-ion radiation therapy. International Journal of Radiation Oncololy*Biology*Physics, 44, 201-210.
Konishi T., Takeyasu A., Yasuda N., Natsume T., Nakajima H., Matsumoto K., Asuka T., Sato Y., Furusawa Y. and Hieda K. 2005. Number of Fe Ion Traversals Through a Cell Nucleus for Mammalian Cell Inactivation Near the Bragg Peak. J. Radiat. Res., 46, 415-424.
23
Kundrat P. 2006. Detailed analysis of the cell-inactivation mechanism by accelerated protons and light ions. Phys. Med. Biol., 51, 1185-1199.
Kundrat P., Lokajicek M. and Hromcikova H. 2005. Probabilistic two-stage model of cell inactivation by ionizing particles. Phys. Med. Biol., 50, 1433-1447.
Merchant M. J., Jeynes J. C., Grime G. W., Palitsin V., Tullis I. D., Barber P. R., Vojnovic B., Webb R. P. and Kirkby K. J. 2012. A focused scanning vertical beam for charged particle irradiation of living cells with single counted particles. Radiat. Res., 178, 182-190. Pugliese M., Durante M., Grossi G. F., Monforti F., Orlando D., Ottolenghi A., Scampoli P. and
Gialanella G. 1997. Inactivation of individual mammalian cells by single alpha-particles. Int. J. Radiat. Biol., 72, 397-407.
Scampoli P., Casale M., Durante M., Grossi G., Pugliese M. and Gialanella G. 2001. Low-energy light ion irradiation beam-line for radiobiological studies. Nucl. Instrum. Methods Phys. Res. B., 174, 337-343.
Schettino G., Folkard M., Prise K. M., Vojnovic B., Bowey A. G. and Michael B. D. 2001. Low-Dose Hypersensitivity in Chinese Hamster V79 Cells Targeted with Counted Protons Using a Charged-Particle Microbeam. Radiat. Res., 156, 526-534.
Scholz M. and Kraft G. 1996. Track structure and the calculation of biological effects of heavy charged particles. Advance Space Research, 18, 5-14.
Schuff J. A., Policastro L., Duran H., Kreiner A. J., Mazal A., Molinari B. L., Burlon A., Debray M. E., Kesque J. M., Somacal H., Stoliar P., Valda A., Bernaola O. A., De La Hoz A. P., Saint-Martin G., O'connor S., Davidson J., Davidson M., Naab F., Ozafran M. J., Vazqueza M. E., Caneva S., Delacroix S., Favaudon F., Henry Y., Nauraye C., Brune E., Gautier C., Habrand J. L., Palmieri M. and Ruffolo M. 2002. Relative biological effectiveness measurements of low energy proton and lithium beams on tumor cells. Nucl. Instrum. Methods Phys. Res. B.,
187, 345-353.
Suzuki M., Kase Y., Yamaguchi H., Kanai T. and Ando K. 2000. Relative biological effectiveness for cell-killing effect on various human cell lines irradiated with heavy-ion medical accelerator in Chiba (HIMAC) carbon-ion beams. International Journal of Radiation Oncololy*Biology*Physics, 48, 241-250.
Torikoshi M., Minohara S., Kanematsu N., Komori M., Kanazawa M., Noda K., Miyahara N., Itoh H., Endo M. and Kanai T. 2007. Irradiation System for HIMAC. J. Radiat. Res., 48, A15-A25. Wéra A. C., Riquier H., Heuskin A. C., Michiels C. and Lucas S. 2011. In vitro irradiation station for
broad beam radiobiological experiments. Nucl. Instrum. Methods Phys. Res. B., 269, 3120-3124.
Zhou H., Randers-Pehrson G., Waldren C. A., Vannais D., Hall E. J. and Hei T. K. 2000. Induction of a bystander mutagenic effect of alpha particles in mammalian cells. Proc. Natl. Acad. Sci. U.S.A., 97, 2099-2104.