HAL Id: tel-03216720
https://tel.archives-ouvertes.fr/tel-03216720
Submitted on 4 May 2021
HAL is a multi-disciplinary open access
archive for the deposit and dissemination of sci-entific research documents, whether they are pub-lished or not. The documents may come from teaching and research institutions in France or abroad, or from public or private research centers.
L’archive ouverte pluridisciplinaire HAL, est destinée au dépôt et à la diffusion de documents scientifiques de niveau recherche, publiés ou non, émanant des établissements d’enseignement et de recherche français ou étrangers, des laboratoires publics ou privés.
Alexandra-Anca Purcel
To cite this version:
Alexandra-Anca Purcel. Economic Development and Environmental Quality Nexus in Developing and Transition Economies. Economics and Finance. Université Clermont Auvergne; Universitatea Babeș-Bolyai (Cluj-Napoca, Roumanie), 2020. English. �NNT : 2020CLFAD013�. �tel-03216720�
Ecole Doctorale des Sciences Économiques, Juridiques, Politiques et de Gestion Centre d’Etudes et de Recherche sur le Développement International (CERDI)
Université Clermont Auvergne, CNRS, IRD, CERDI, F-63000 Clermont-Ferrand, France
Şcoala Doctorală Ştiinţe Economice şi Gestiunea Afacerilor
Universitatea Babeș-Bolyai, Facultatea de Știinte Economice și Gestiunea Afacerilor, St. Teodor Mihali 58-60, 400591 Cluj-Napoca, România
ECONOMIC DEVELOPMENT AND ENVIRONMENTAL QUALITY
NEXUS IN DEVELOPING AND TRANSITION ECONOMIES
Thèse présentée et soutenue publiquement le 14 Décembre 2020
pour l’obtention du titre de Docteur en Sciences Économiques
par
Alexandra-Anca PURCEL
sous la direction de
Mme. Dorina LAZĂR et M. Alexandru MINEA
Membres du JuryDorina LAZĂR Professeur, Université Babeș-Bolyai de Cluj-Napoca Directrice
Alexandru MINEA Professeur, Université Clermont Auvergne Directeur
Mihai MUTAȘCU Professeur, Université de l’Ouest de Timișoara; et Zeppelin University Rapporteur
Carmen PINTILESCU Professeur, Université Alexandru Ioan Cuza de Iași Rapportrice
Alexandru TODEA Professeur, Université Babeș-Bolyai de Cluj-Napoca Président
i
University Clermont Auvergne and Babeș-Bolyai University do not give any approval or disapproval to the views expressed in this thesis. These views must be considered as belonging to the author.
L’Université Clermont Auvergne et l’Université Babeș-Bolyai n’entend donner aucune approbation ni improbation aux opinions émises dans cette thèse. Ces opinions doivent être considérées comme propres à leur auteur.
Universitatea Clermont Auvergne şi Universitatea Babeș-Bolyai nu aprobă sau dezaprobă punctele de vedere exprimate în această teză. Aceste puncte de vedere trebuie considerate ca aparţinând autorului.
ii
The achievement of this thesis has been possible with the support of the French Embassy and French Institute in Romania.
La réalisation de cette thèse a été possible avec le soutien de l'Ambassade de France et Institut Français en Roumanie.
Realizarea acestei teze a fost posibilă cu sprijinul Ambasadei Franţei și Institutului Francez în România.
iv
Acknowledgements
"One day, in retrospect, the years of struggle will strike you as the most beautiful." — Sigmund Freud I have always tried to do the things I really enjoy because they give you the most satisfaction in life. Indeed, even the present thesis does not detract from this, given that it is the result of work that I have done with great pleasure, out of a passion for what delights me professionally. I have embarked on this adventure, aware that I will encounter ups and downs, but firmly convinced that all the experiences and people I will meet will contribute to my self-improvement. Certainly, the destination matters a lot, but just as much we have to enjoy the voyage, and I hope that this particular one has brought out a better me.
These being said, I would like to express my deepest gratitude to the persons who believed in my ideas and accepted to join my research adventure. On this occasion, my heartfelt appreciation goes for Dorina Lazăr and Alexandru Minea. Thank you, a million times, for supervising this work, the confidence and freedom you have given me in this regard. Your kindness, support, and devotion will guide me both professionally and personally. I would also like to extend my most warm thanks to Mihai Mutașcu, Carmen Pintilescu, Alexandru Todea, and Marcel Voia, for accepting to be a member of my jury. It is truly an honor and a privilege to share my research efforts embodied by this thesis with you.
Given that this thesis is the result of four years of research, carried out at FSEGA-UBB (four years) in Cluj-Napoca and at CERDI-UCA (three years) in Clermont-Ferrand, I am grateful to both work environments for providing me the best conditions to carry out my research and documentation activity. Notably, I gratefully acknowledge the support from the French Embassy and French Institute in Romania through «Bourse du Gouvernement Français
(BGF) pour le Doctorat en Cotutelle». Besides, I would like to give my sincerest appreciation
and thanks to the Ph.D. thesis advisory committee from both universities. I am deeply grateful for the constructive comments, valuable recommendations, and high enthusiasm you greeted me each time. Without a doubt, my profound and warmest thanks also go to my professors, colleagues, and friends from the Department of Statistics, Forecasts, Mathematics at FSEGA. Many thanks for the precious advice, words of encouragement, candies, coffees, songs, and all the good times we have spent together. I am also grateful to my colleagues and friends who offered me help when needed, with whom I have enjoyed participating in a series of seminars, workshops, conferences, but also trips and events of all kinds.
Last but not least, I would like to warmly thank my closest friends and, most importantly, my family, for all the love, good vibes, and unconditional support they have given over time. My eternal love and appreciation for you. Words would simply fall short of expressing how much you mean to me.
v
Abstract
This thesis tackles one of the most debatable and in vogue topics in economics, namely the economic development and environmental quality nexus. Notably, it studies the economic development's effects—in terms of its economic, social, and political dimensions—on the environmental quality for developing and transition economies. In this vein, four essays, one literature survey, and three empirical papers shape its anatomy and cover different key related aspects. Chapter I provides an updated literature survey on pollution-growth nexus via the environmental Kuznets curve (EKC) hypothesis, both from theoretical and empirical standpoints. On the one hand, it offers a literature review on the most well-known rationale behind the EKC prevalence and discusses the key components of the research design when estimating the EKC. On the other hand, it brings together the most influential empirical papers published in the last decade, focusing on EKC estimation in developing and transition economies. Overall, the findings reveal that the recent empirical studies, indeed, succeeding to curtail some of the deficiencies suggested by theoretical contributions, might indicate a certain consensus regarding pollution-growth nexus and EKC validity. First, reinforcing the EKC nature, several studies reveal a long-run relationship between indicators. Second, according to income coefficients' signs, the traditional bell-shaped pattern seems to be at work for some developing and transition economies. However, in some cases, the estimated turning point lies outside the income sample range, calling into question not only the true pattern between pollution and growth but also the identification of EKC. Taken collectively, both the theoretical foundations and empirical evidence could contribute to a better understanding of the pollution-growth nexus in the EKC context, and suggest some useful insights into the future works on the subject as well as the crucial policy implications in this group of countries. Chapter II focuses on the relationships between pollution and growth in eleven Central and Eastern European (CEE) countries. On the one hand, it unveils an increasing nonlinear link between GDP and CO2 at the aggregate level, which is powerfully robust to different estimators and control variables. On the other hand, the country-level analysis reveals that the relationship between GDP and CO2 is characterized by much diversity among CEE countries, namely: N-shaped, inverted-N, U-shaped, inverted-U, monotonic, or no statistical link. Thus, despite an aggregated upward trend, some CEE countries managed to secure both higher GDP and lower CO2 emissions. From a policy perspective, EU policymakers could pay more attention to these countries and amend the current unique environmental policy to account for country-heterogeneities to support economic growth without damaging the environment. Chapter III explores, for a rich sample of developing states, the responsiveness (both within the period and over a twenty-year horizon) of aggregated and sectoral CO2 emissions following external disturbances to output and urbanization, assuming a transmission channel that incorporates two of the key elements used in mitigating environmental degradation—renewable energy and energy efficiency. On the one hand, robust to several alternative specifications, the results indicate that output, urbanization, and energy intensity increase the aggregated CO2 emissions, while renewable energy exhibits an opposite effect. Moreover, regarding the CO2 responsiveness in the aftermath of output and urbanization shocks, the pattern may suggest that these countries are likely to attain the threshold that would trigger a decline in CO2 emissions. However, the
vi
findings are sensitive to both countries' economic development and Kyoto Protocol ratification/ascension status. On the other hand, the sector-specific analysis unveils that the transportation, buildings, and non-combustion sector exhibits a higher propensity to increase the future CO2 levels. Overall, this chapter may provide useful insights concerning environmental sustainability prospects in developing states. Chapter IV studies the link between CO2 emissions and political stability. Considering a sample of low and lower-middle income countries, it shows that a nonlinear, bell-shaped pattern characterizes the relationship between variables at the aggregate level. Moreover, while this result is robust to a broad set of alternative specifications, significant heterogeneities are found regarding countries' distinct characteristics and alternative pollution measures. Besides, the country-specific estimates unveil contrasting patterns regarding the relationship between CO2 and political stability. Overall, the findings suggest that both the formal and informal sides of political stability play a vital role in mitigating CO2 pollution in developing countries, and may provide meaningful insights for policymakers.
Keywords: environmental Kuznets curve hypothesis; CO2 emissions; economic growth;
urbanization; political stability; renewable energy; energy efficiency; literature survey; Central and Eastern European countries; developing economies;
heterogeneous panels; cross-sectional dependence; nonstationarity, cointegration.
vii
Résumé
Cette thèse aborde l'un des sujets les plus discutés et en vogue dans le domaine de l'économie, à savoir le lien entre le développement économique et la qualité environnementale. En particulier, on met l’accent sur les effets du développement économique—tant dans ses
dimensions économique, sociale que politique—sur la qualité de l'environnement pour les économies en développement et en transition. Dans ce sens, quatre essais, une étude de la
littérature et trois études empiriques modélisent son anatomie et couvrent divers aspects clés associés. Le chapitre I propose une mise à jour de la littérature sur la relation entre la pollution et la croissance économique, vue à travers l'hypothèse de la Courbe de Kuznets Environnementale (CKE), à la fois théoriquement et empiriquement. D'une côté, il présente une revue de la littérature sur les raisons les plus connues de la prévalence de la CKE et discute les composants essentiels du plan de recherche lors de l'estimation de la CKE. De l’autre côté, il rassemble les travaux empiriques les plus influents publiés au cours de la dernière décennie, qui se concentrent sur l'estimation de la CKE dans les économies en développement et en transition. Dans l'ensemble, les résultats révèlent que des études empiriques récentes, parvenant à réduire certaines lacunes suggérées par les contributions théoriques, pourraient en effet indiquer un certain consensus sur la relation entre la croissance et la pollution, à savoir la validité de la CKE. Tout d'abord, en renforçant la nature de la CKE, plusieurs études révèlent un lien à long terme entre les indicateurs. Deuxièmement, selon les signes des coefficients de revenu, le modèle traditionnel en forme de cloche semble s'appliquer à certaines économies en développement et en transition. Cependant, dans certains cas, le point maximum estimé se situe en dehors de la plage des valeurs de revenu, ce qui remet en question non seulement la vraie forme de la relation entre les variables, mais aussi la stratégie d'identification de CKE. Pris collectivement, les fondements théoriques et les preuves empiriques pourraient contribuer à une meilleure compréhension de la relation pollution-croissance économique dans le contexte de la CKE, et suggérer des idées utiles pour les travaux futurs sur ce sujet, ainsi que les implications politiques cruciales pour ce groupe de pays. Le chapitre II se concentre sur le lien entre la pollution et la croissance économique dans onze Pays d'Europe Centrale et Orientale (PECO). D'une part, il révèle un lien de croissance non linéaire entre le PIB et le CO2 agrégé, qui est fortement robuste pour différents estimateurs et variables de contrôle. En revanche, l'analyse au niveau des pays révèle que la relation entre le PIB et le CO2 se caractérise par une grande diversité dans les PECO, à savoir: en forme de N, en N inversé, en forme de U, en U inversé, monotone ou sans lien statistique. Ainsi, malgré une tendance globale à la hausse, certains pays d'Europe Centrale et Orientale ont réussi à assurer à la fois un PIB plus élevé et une réduction des émissions de CO2. Du point de vue politique, les décideurs de l'UE pourraient accorder plus d'attention à ces pays, c'est-à-dire envisager de changer la politique environnementale unique actuelle pour intégrer plus rigoureusement les hétérogénéités des pays et, en même temps, soutenir la croissance économique sans nuire à l'environnement. Le chapitre III explore, pour un échantillon complet de pays en cours de développement, la réponse (à la fois dans la période actuelle et sur un horizon de vingt ans) des émissions de CO2 agrégées et sectorielles résultant des perturbations externes du PIB et de l'urbanisation, en supposant un canal de transmission qui intègre deux des éléments clés utilisés dans la lutte contre la dégradation de
viii
l'environnement—les énergies renouvelables et l'efficacité énergétique. D'une part, robustes à plusieurs spécifications alternatives, les résultats indiquent que la production globale, l'urbanisation et l'intensité énergétique augmentent les émissions totales de CO2, tandis que les énergies renouvelables ont l'effet inverse. Par ailleurs, en ce qui concerne la réponse du CO2 aux chocs de production et d'urbanisation, le modèle peut suggérer que ces pays atteindront le seuil maximum qui conduirait à un changement de la tendance des émissions à la baisse. Cependant, les résultats varient en fonction du niveau de revenu et du statut des pays sur la ratification/l'adhésion au Protocole de Kyoto. D'autre part, l'analyse sectorielle montre que les transports, les bâtiments et les secteurs non-combustion sont plus susceptibles de contribuer à l'augmentation des niveaux futurs de CO2. En général, ce chapitre peut fournir des informations précieuses sur les perspectives de durabilité environnementale dans les pays en développement. Le chapitre IV examine le lien entre les émissions de CO2 et la stabilité politique. Pour un échantillon de pays à revenu intermédiaire et faible, il montre qu'une évolution non linéaire en forme de cloche décrit la relation entre les variables au niveau agrégé. De plus, bien que ce résultat reste stable pour une large gamme de spécifications alternatives, nous identifions des hétérogénéités significatives dans les caractéristiques distinctes des pays et les mesures alternatives de pollution. En outre, des estimations désagrégées révèlent des schémas contrastés pour la relation entre le CO2 et la stabilité politique. Dans l'ensemble, les conclusions suggèrent que la dimension formelle et informelle de la stabilité politique joue un rôle clé dans l'atténuation de la pollution par le CO2 dans les pays en cours de développement, fournissant ainsi des informations utiles aux décideurs.
Mots-clés: l'hypothèse de la courbe de Kuznets environnementale; émissions de CO2;
croissance économique; urbanisation; stabilité politique; énergie renouvelable; efficacité énergétique; enquête bibliographique; Pays d'Europe Centrale et
Orientale; économies en cours de développement; modèles hétérogènes pour des données de panel; la dépendance en coupe transversale; non-stationnarité, cointégration.
ix
Rezumat
Această teză abordează unul dintre cele mai discutabile și în vogă subiecte în domeniul economiei, și anume joncțiunea dintre dezvoltarea economică și calitatea mediului. În particular, aceasta se concentrează pe efectele dezvoltării economice—din punct de vedere atât
a dimensiunii sale economice, sociale, dar și politice—asupra calității mediului pentru economiile în curs de dezvoltare și în tranziție. În această direcție, patru eseuri, respectiv un
rezumat al literaturii de specialitate și trei lucrări empirice, constituie structura tezei. Capitolul I realizeaza un rezumat de actualitate al literaturii privind relația dintre poluare și creșterea economică, văzută din perspectiva ipotezei Curbei Kuznets de Mediu (CKM), atât din punct de vedere teoretic cât și empiric. Pe de o parte, acesta prezintă o revizuire a literaturii cu privire la cele mai cunoscute motivații din spatele prevalenței CKM și discută componentele esențiale ale cercetării atunci când estimăm CKM. Pe de altă parte, reunește cele mai influente lucrări empirice publicate în ultimul deceniu, care se concentrează pe estimarea CKM în economiile în curs de dezvoltare și de tranziție. În ansamblu, concluziile dezvăluie că studiile empirice recente, într-adevăr, reușind să reducă unele deficiențe sugerate de contribuțiile teoretice, ar putea indica un anumit consens în privința relației dintre creștere și poluare, respectiv validitatea CKM. În primul rând, consolidând natura CKM, mai multe studii dezvăluie o legătură pe termen lung între indicatori. În al doilea rând, în funcție de semnele coeficienților asociați venitului, modelul tradițional în formă de clopot pare să fie adevcat pentru unele economii în curs de dezvoltare și de tranziție. Cu toate acestea, în unele cazuri, punctul de maxim estimat se situează în afara intervalului valorilor venitului, punând în discuție nu numai adevarata formă a relației dintre variabile, ci și strategia de identificare a CKM. Luate colectiv, atât fundamentele teoretice cât și evidențele empirice contribuie la o mai bună înțelegere a relației dintre poluare și creșterea economică în contextul CKM, sugerând câteva idei utile viitoarelor lucrări ce vor aborda această temă; de asemenea sunt delimitate implicațiile cruciale ale politicii de mediu pentru acest grup de țări. Capitolul II se concentrează pe legătura dintre poluare și creșterea economică în unsprezece țări din Europa Centrală și de Est (ECE). Pe de o parte, acesta dezvăluie o legătură neliniară, de creștere, între PIB și CO2 la nivel agregat, care este puternic robustă pentru diferiți estimatori și variabile de control. Pe de altă parte, analiza la nivel de țară relevă că relația dintre PIB și CO2 se caracterizează printr-o mare diversitate în țările ECE, și anume: formă de
N, N-inversat, formă de U, U-inversat, monotonă sau chiar lipsa legăturii statistice. Astfel, în
ciuda unei tendințe ascendente agregate, unele țări din ECE au reușit să asigure atât un PIB mai mare, cât și emisii de CO2 mai scăzute. Din perspectiva politicii, factorii de decizie din UE ar putea acorda mai multă atenție acestor țări, respectiv pot considera modificarea actualei politici unice de mediu pentru a incorpora mai exigent eterogeneitățile țărilor și, simultan, sprijini creșterea economică fără a dăuna mediului. Capitolul III explorează, pentru un eșantion cuprinzător de state în curs de dezvoltare, răspunsul emisiilor de CO2 agregate și sectoriale (atât în perioada curentă cât și de-a lungul unui orizont de douăzeci de ani) în urma perturbațiilor externe în PIB și urbanizare, presupunând un canal de transmisie care încorporează două dintre elementele cheie utilizate în lupta contra degradării mediului— energia regenerabilă și eficiență energetică. Pe de o parte, robuste la mai multe specificații alternative, rezultatele indică faptul că producția agregată, urbanizarea și intensitatea
x
energetică cresc emisiile totale de CO2, în timp ce energia regenerabilă prezintă un efect opus. Mai mult, în ceea ce privește răspunsul CO2 la șocurile în producție și urbanizare, modelul poate sugera că aceste țări vor atinge pragul maxim care ar determina schimbarea trendului emisiilor în sensul scăderii. Cu toate acestea, rezultatele variază în funcție de nivelul de venit și statutul țărilor privind ratificarea/ascensiunea la Protocolul de la Kyoto. Pe de altă parte, analiza sectorială arată că sectorul transporturilor, clădirilor și non-combustiei sunt mai predispuse să contribuie la creșterea nivelurilor viitoare de CO2. În general, acest capitol poate oferi informații valoroase cu privire la perspectivele de sustenabilitate a mediului în statele în curs de dezvoltare. Capitolul IV studiază legătura dintre emisiile de CO2 și stabilitatea politică. Pentru un eșantion de țări cu venituri medii-mici și mici, acesta arată că o evoluție neliniară, sub formă de clopot, descrie relația dintre variabile la nivel agregat. Mai mult, deși acest rezultat rămâne stabil la o serie vastă de specificații alternative, identificăm eterogeneități semnificative cu privire la caracteristicile distincte ale țărilor și diferite măsuri alternative de poluare. În plus, estimările la nivel dezagregat dezvăluie tipare contrastante privind relația dintre CO2 și stabilitatea politică. Per total, concluziile sugerează că atât dimensiunea formală cât și informală a stabilității politice joacă un rol esențial în atenuarea poluării cu CO2 în țările în curs de dezvoltare, astfel, oferind informații relevante pentru factorii de decizie.
Cuvinte cheie: ipoteza curbei Kuznets de mediu; emisiile de CO2; creștere economică;
urbanizare; stabilitate politică; energie regenerabilă; eficiență energetică; sondaj de literatură; țările din Europa Centrală și de Est; economii în curs de dezvoltare; modele eterogene pentru date panel; dependență transversală; nonstaționaritate; cointegrare.
xi
Contents
GENERAL INTRODUCTION AND OVERVIEW ... 1
1. CONTEXT OF THE RESEARCH ... 1
2. A GLIMPSE ON THESIS' DATA AND METHODOLOGY ... 6
2.1. Data ...6
2.2. Methodology ...8
3. THESIS OUTLINE ... 9
«CHAPTER I» ... 17
NEW INSIGHTS INTO THE ENVIRONMENTAL KUZNETS CURVE HYPOTHESIS IN DEVELOPING AND TRANSITION ECONOMIES:ALITERATURE SURVEY ... 18
I.1.INTRODUCTION ... 19
I.2.THEORETICAL ASPECTS OF EKC ... 22
I.2.1. The rationale behind the EKC hypothesis ... 22
I.2.2. Model specification, assumptions, econometric methodology, and identification strategy ... 26
I.2.2.1. Model specification ... 26
I.2.2.2. Model assumptions, and econometric methodology ... 28
I.2.2.3. Identification strategy ... 29
I.3.CO2 EMISSIONS STYLIZED FACTS: A SHORT DESCRIPTIVE EMPIRICAL EXERCISE ... 32
I.4.EMPIRICAL LITERATURE REVIEW ON EKC HYPOTHESIS ... 36
I.4.1. Panel data analysis ... 36
I.4.2. Time-series analysis ... 47
I.4.3. New perspectives on modelling environmental degradation and economic growth nexus ... 55
I.5.CONCLUSION, AND POLICY IMPLICATIONS ... 56
«CHAPTER II» ... 59
POLLUTION AND ECONOMIC GROWTH:EVIDENCE FROM CENTRAL AND EASTERN EUROPEAN COUNTRIES ... 60
II.1.INTRODUCTION ... 61
II.2.THEORY, THE MODEL, AND SOME RELATED LITERATURE ... 64
II.2.1. Theory ... 64
II.2.2. The model ... 65
II.2.2. Some related literature ... 65
II.3.DATA, MODELING CONSIDERATIONS, AND METHODOLOGY ... 66
II.3.1. Data ... 66
II.3.2. Modeling considerations ... 68
II.3.2.1. Cross-sectional dependence, and heterogeneity ... 68
II.3.2.2. Stationarity, and cointegration ... 70
II.3.3. Methodology ... 72
II.4.RESULTS: AGGREGATED ANALYSIS ... 74
II.4.1. Results ... 74
xii
II.4.3. Robustness: additional controls ... 77
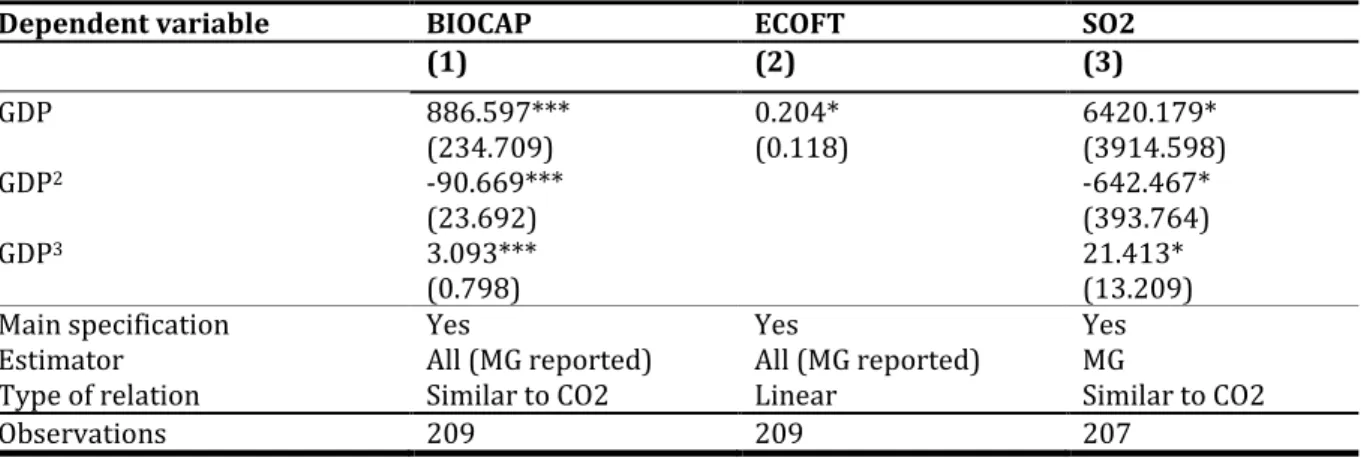
II.4.4. Alternative measures of environmental quality ... 80
II.5.RESULTS: COUNTRY ANALYSIS ... 82
II.5.1. Results ... 82
II.5.2. Patterns ... 83
II.5.3. Turning points ... 86
II.5.4. Discussion ... 87
II.5.4.1. The link between aggregated and disaggregated estimations ... 87
II.5.4.2 Structural characteristics of the CEE countries... 88
II.6.POLICY IMPLICATIONS, AND FUTURE RESEARCH TOPICS ... 90
APPENDIX ... 92
«CHAPTER III» ... 113
DEVELOPING STATES AND THE GREEN CHALLENGE.ADYNAMIC APPROACH ... 114
III.1.INTRODUCTION ... 115
III.2.LITERATURE REVIEW ... 118
III.3.STIRPAT FRAMEWORK, METHODOLOGY, AND DATA ... 122
III.3.1. STIRPAT framework ... 122
III.3.2. Methodology ... 123
III.3.3. Data ... 125
III.4.EMPIRICAL RESULTS ... 126
III.4.1. Some preliminary data evaluations ... 126
III.4.2. Identification and estimation of the structural panel VAR model... 128
III.4.2.1. Identification ... 128
III.4.2.2. Estimation ... 130
III.5.ROBUSTNESS ... 135
III.5.1. Alternative ordering ... 135
III.5.2. Altering the sample... 136
III.5.3. Exogenous control factors ... 137
III.6.HETEROGENEITY... 137
III.6.1. The level of economic development ... 137
III.6.2. The Kyoto Protocol status ... 139
III.7.SECTORAL CO2 EMISSIONS... 140
III.8.CONCLUSION, AND POLICY IMPLICATIONS ... 144
APPENDIX ... 146
«CHAPTER IV» ... 163
DOES POLITICAL STABILITY HINDER POLLUTION?EVIDENCE FROM DEVELOPING STATES ... 164
IV.1.INTRODUCTION... 165
IV.2.DATA AND METHODOLOGY ... 171
IV.2.1. Data... 171
IV.2.2. Panel Autoregressive Distributed Lag (ARDL) approach ... 173
IV.3.RESULTS ... 177
IV.3.1. Preliminary analysis ... 178
IV.3.1.1. Cross-sectional dependence ... 178
xiii
IV.3.1.3. Cointegration ... 179
IV.3.2. Pollution and political stability: baseline estimates ... 180
IV.3.3. Pollution and political stability: threshold effect estimates ... 183
IV.4.ROBUSTNESS CHECKS ... 187
IV.4.1. Alternative estimation technique ... 187
IV.4.1.1. The Cross-Section Augmented ARDL (CS-ARDL) approach ... 188
IV.4.1.2. The Cross-Section Augmented Distributed Lag (CS-DL) approach ... 191
IV.4.1.3. The Common Correlated Effects (CCE) approach ... 193
IV.4.1.4. The Augumented Mean Group (AMG) approach ... 195
IV.4.2. Additional controls ... 197
IV.4.3. Altering the sample ... 199
IV.4.4. Political stability subcomponents... 202
IV.4.5. Alternative methods in computing the PS composite index ... 204
IV.4.6. Alternative approach in estimating the threshold effect ... 206
IV.5.HETEROGENEITY ... 210
IV.5.1. Level of economic development ... 210
IV.5.2. Kyoto Protocol ... 212
IV.5.3. Legal origin ... 213
IV.5.4. Alternative measures of pollution ... 215
IV.6.COUNTRY-SPECIFIC ANALYSIS ... 219
IV.6.1. Estimates, turning points, and patterns ... 219
IV.6.2. Discussion ... 227
IV.7.CONCLUSION, AND POLICY IMPLICATIONS ... 230
APPENDIX ... 233
GENERAL CONCLUSION ... 258
1. KEY FINDINGS ... 258
2. POLICY IMPLICATIONS, AND FUTURE RESEARCH AVENUES ... 261
REFERENCES ... 267
GENERAL INTRODUCTION AND OVERVIEW ... 267
CHAPTER I.«NEW INSIGHTS INTO THE ENVIRONMENTAL KUZNETS CURVE HYPOTHESIS IN DEVELOPING AND TRANSITION ECONOMIES: A LITERATURE SURVEY» ... 272
CHAPTER II.«POLLUTION AND ECONOMIC GROWTH:EVIDENCE FROM CENTRAL AND EASTERN EUROPEAN COUNTRIES» ... 285
Additional References for the Appendix ... 288
CHAPTER III.«DEVELOPING STATES AND THE GREEN CHALLENGE.ADYNAMIC APPROACH» ... 289
Additional References for the Appendix ... 294
CHAPTER IV.«DOES POLITICAL STABILITY HINDER POLLUTION? EVIDENCE FROM DEVELOPING STATES» ... 295
Additional References for the Appendix ... 300
xiv
List of Tables
Main Tables
Table I.1: Theoretical studies on EKC based on Kijima et al. (2010) ... 24
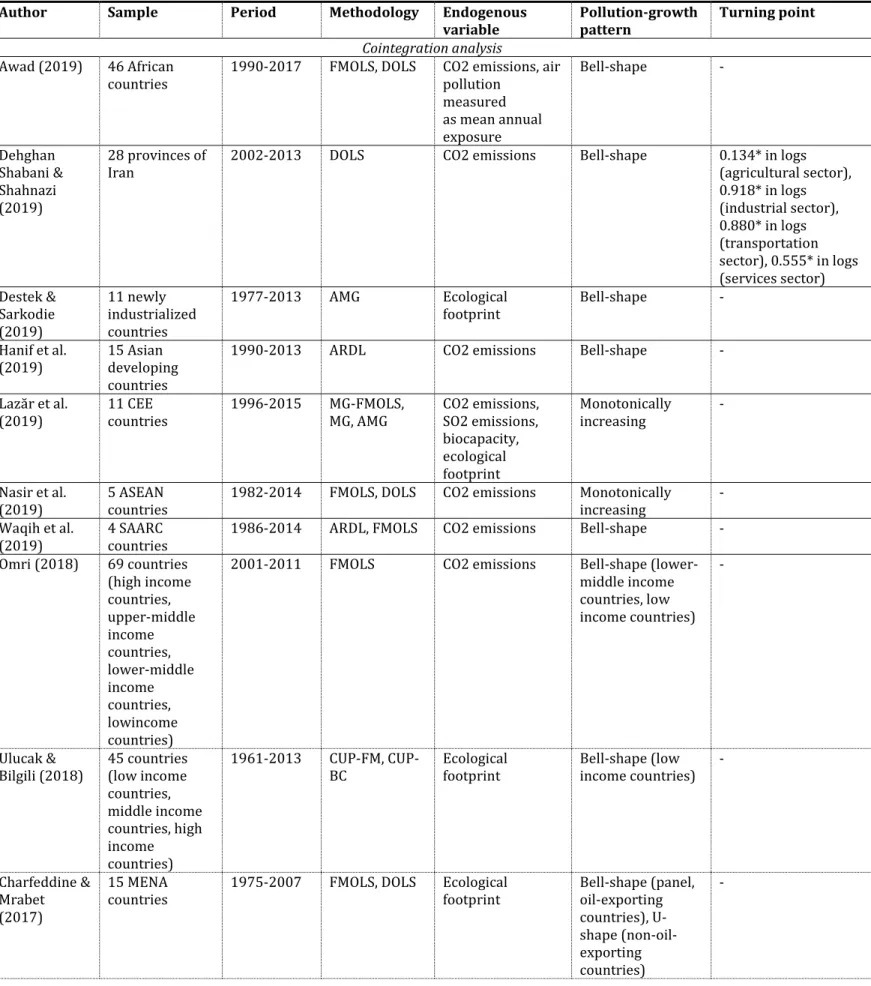
Table I.2: Panel data literature survey ... 41
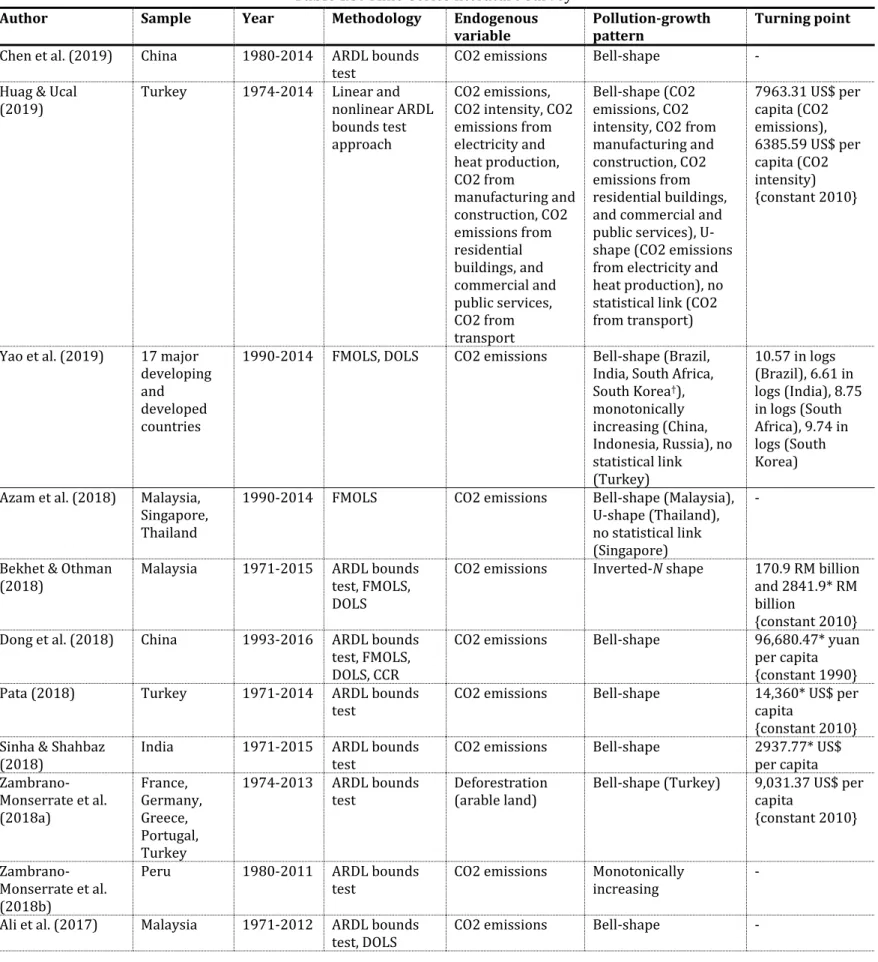
Table I.3: Time-series literature survey ... 51
Table II.1: Cross-sectional dependence analysis ... 69
Table II.2: Stationarity analysis ... 71
Table II.3: Pedroni (1999, 2004) cointegration tests ... 71
Table II.4: Westerlund (2007) cointegration tests ... 72
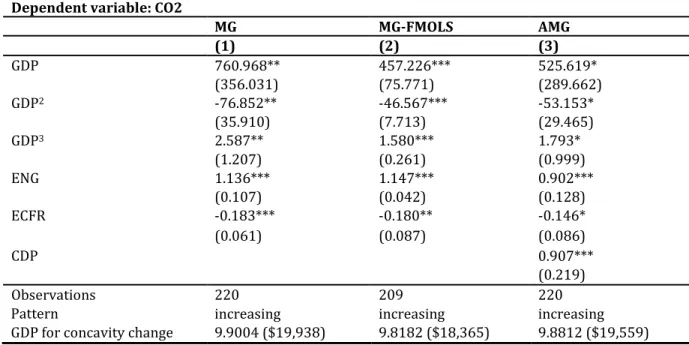
Table II.5: Aggregated estimates ... 75
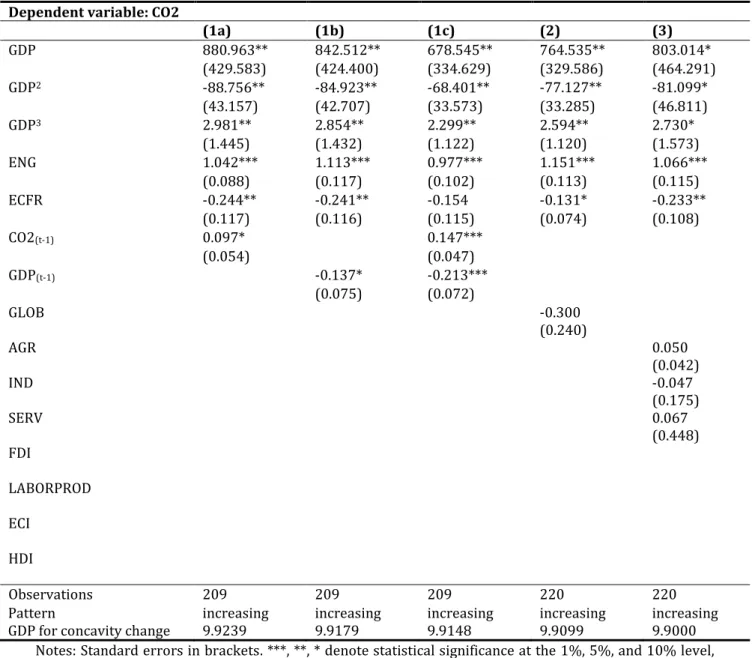
Table II.6: Robustness: additional variables ... 79
Table II.7: Aggregated estimates with alternative measures of environmental quality ... 81
Table II.8: Country-specific estimates [cubic specification] ... 83
Table II.9: Country-specific estimates [quadratic specification]... 83
Table II.10: Country-specific estimates [linear specification] ... 83
Table II.11: Turning points ... 86
Table II.12: Aggregated estimates on subsamples [nonlinear versus linear] ... 88
Table II.13: Aggregated estimates on subsamples [increasing versus decreasing] ... 88
Table III.1: Cross-sectional dependence tests ... 127
Table III.2: Stationarity analysis I ... 127
Table III.3: Stationarity analysis II ... 128
Table III.4: Panel cointegration tests ... 128
Table III.5: Forecast-error variance decompositions ... 135
Table IV.1: Cross-sectional dependence analysis ... 178
Table IV.2: Stationarity analysis ... 179
Table IV.3: Cointegration analysis ... 179
Table IV.4: CO2 emissions and political stability: baseline estimates ... 181
Table IV.5: CO2 emissions and political stability: threshold estimates ... 186
Table IV.6: Threshold estimates: robustness [CS-ARDL and CS-DL estimator] ... 190
Table IV.7: Long-run threshold estimates: robustness [CCE estimator]... 195
Table IV.8: Long-run threshold estimates: robustness [AMG estimator] ... 197
Table IV.9: Threshold estimates: robustness [additional control factors] ... 198
Table IV.10: Threshold estimates: robustness [altering the sample] ... 201
Table IV.11: Threshold estimates: robustness [political stability subcomponents] ... 204
Table IV.12: Threshold estimates: robustness [alternative computation of PS index] ... 206
Table IV.13: Average long-run threshold effects estimates on CO2 [POLS estimator] ... 209
Table IV.14: Average long-run threshold effects estimates on CO2 [MG estimator] ... 210
Table IV.15: Average long-run threshold effects estimates on CO2 [CS-ARDL-PMG estimator] ... 210
Table IV.16: Threshold estimates: heterogeneity [level of economic development, ... 214
Table IV.17: Threshold estimates: heterogeneity [alternative measures of pollution] ... 217
Table IV.18: Country-specific estimates [quadratic specification] ... 221
xv
Appendix Tables
Table A - II.1: Variables' description ... 92
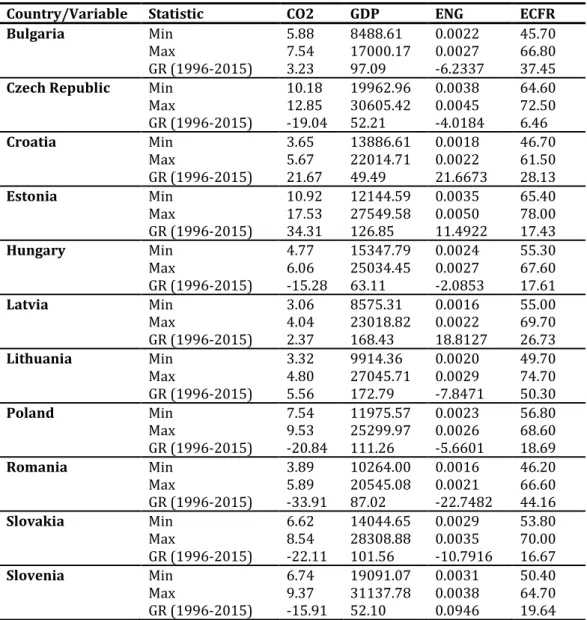
Table A - II.2: Descriptive statistics of the main variables ... 93
Table A - II.3: Panel ECM estimates... 97
Table A - II.4: Aggregated estimates quadratic specification ... 97
Table A - II.5: Aggregated estimates linear specification ... 98
Table A - II.6: Panel ECM estimates with lagged values of the main variables ... 98
Table A - II.7: Variables' description [globalization index] ... 99
Table A - II.8: Aggregate estimates [de facto & de jure globalization index and economic globalization] ... 100
Table A - II.9: Aggregated estimates [social globalization] ... 101
Table A - II.10: Aggregated estimates [political globalization] ... 102
Table A - II.11: Countries' classification by agriculture average over 1996-2015 ... 111
Table A - II.12: Countries' classification by industry average over 1996-2015 ... 111
Table A - II.13: Countries' classification by services average over 1996-2015 ... 111
Table A - II.14: Countries' classification by foreign direct investments average over 1996-2015... 111
Table A - II.15: Countries' classification by labor productivity average over 1996-2015 ... 112
Table A - II.16: Countries' classification by economic complexity average over 1996-2015 ... 112
Table A - II.17: Countries' classification by human development index average over 1996-2015... 112
Table A - III.1: List of countries ... 146
Table A - III.2: Variables' definition ... 147
Table A - III.3: Descriptive statistics [full-sample] ... 148
Table A - III.4: Descriptive statistics [subsamples] ... 148
Table A - III.5: Panel SVAR-Granger causality Wald test ... 149
Table A - III.6: Panel SVAR selection order criteria ... 149
Table A - III.7: Model stability condition ... 150
Table A - III.8: First-order panel SVAR-GMM estimates ... 150
Table A - III.9: Cross-sectional dependence tests ... 159
Table A - III.10: Stationarity analysis I ... 159
Table A - III.11: Stationarity analysis II ... 159
Table A - III.12: Forecast-error variance decompositions: sectoral CO2 emissions ... 160
Table A - III.13: List of Non-Annex I parties of the Kyoto Protocol to the UNFCCC based on UN Treaty Collection-Status of Treaties ... 161
Table A - IV.1: List of countries ... 233
Table A - IV.2: Variables' definition ... 234
Table A - IV.3: Summary statistics [full sample] ... 236
Table A - IV.4: Summary statistics [subsamples] ... 237
Table A - IV.5: CO2 emissions and political stability [baseline and threshold estimates: ... 238
Table A - IV.6: Countries' classification by agriculture average over 1990-2015 ... 245
Table A - IV.7: Countries' classification by agriculture median over 1990-2015 ... 246
xvi
Table A - IV.9: Countries' classification by industry median over 1990-2015 ... 248
Table A - IV.10: Countries' classification by unemployment mean over 1990-2015 ... 249
Table A - IV.11: Countries' classification by unemployment median over 1990-2015 ... 250
Table A - IV.12: Countries' classification by globalization mean over 1990-2015 ... 251
Table A - IV.13: Countries' classification by globalization median over 1990-2015 ... 252
Table A - IV.14: Countries' classification by forest rents mean over 1990-2015 ... 253
Table A - IV.15: Countries' classification by forest rents median over 1990-2015 ... 254
Table A - IV.16: Countries' classification by military in politics mean over 1990-2015 ... 255
Table A - IV.17: Countries' classification by military in politics median over 1990-2015 .. 256
Table A - IV.18: List of Non-Annex I parties of the Kyoto Protocol to the UNFCCC based on UN Treaty Collection-Status of Treaties ... 257
xvii
List of Figures
Main Figures
Figure 1: Global CO2 atmospheric concentration ... 2
Figure 2: CO2 per capita emissions over time [1960-2016] ... 4
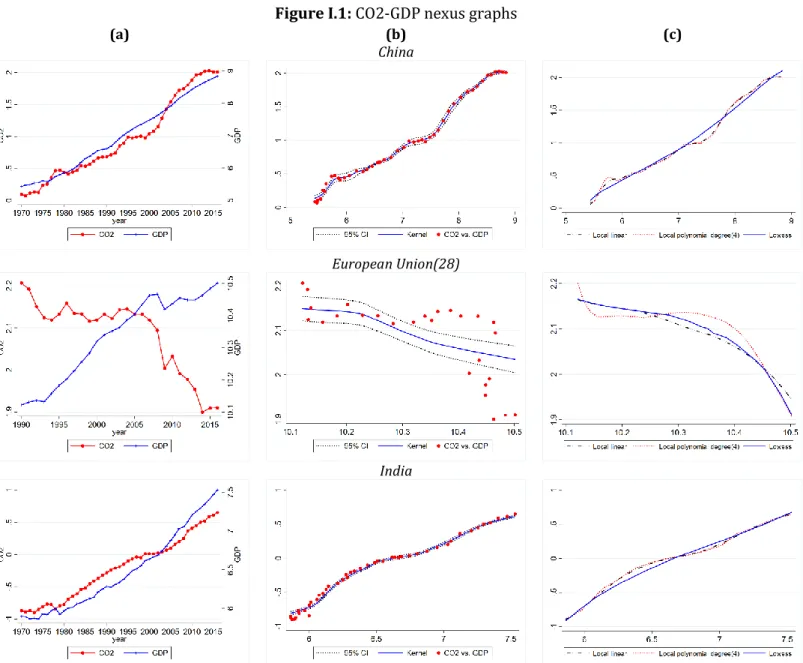
Figure I.1: CO2-GDP nexus graphs ... 34
Figure II.1: Traditional EKC [Inverted-U shape] and Extended EKC [N-shape] ... 64
Figure II.2: CO2 emissions per capita by year ... 67
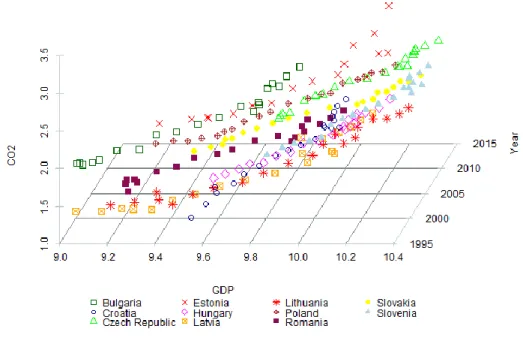
Figure II.3. Combined three-dimensional scatterplot for each panel member ... 68
Figure II.4: The estimated relationship between GDP and CO2 [aggregated analysis] ... 76
Figure II.5: The estimated relationship between GDP and CO2 [aggregated analysis: robustness] ... 77
Figure II.6: The estimated relationship between GDP and CO2 [aggregated analysis], in the presence of GDP and CO2 lags ... 78
Figure II.7: The estimated relationship between GDP and CO2 [country analysis] ... 84
Figure III.1: Cumulative orthogonalized IRFs ... 134
Figure III.2: Cumulative orthogonalized IRFs: sectoral CO2 emissions ... 143
Figure IV.1: CO2 and PS kernel density plots and histogram [full sample] ... 173
Figure IV.2: CO2 and PS evolution over time and scatterplot [full sample] ... 173
Figure IV.3: The estimated relationship between PS and CO2 [augmented model] ... 184
Figure IV.4: The estimated relationship between PS and CO2 [core model] ... 184
Figure IV.5: The estimated relationship between PS and CO2 [country analysis] ... 224
Appendix Figures
Figure A - II.1: CO2 and GDP evolution over 1996-2015... 94Figure A - II.2: The estimated relationship between GDP and CO2 [globalization control variables] ... 103
Figure A - II.3: The estimated relationship between GDP and CO2 [control variables] ... 109
Figure A - III.1: Inverted roots of AR characteristics polynomial [GMM-SVAR] ... 150
Figure A - III.2: Orthogonalized IRFs ... 151
Figure A - III.3: Cumulative orthogonalized IRFs: robustness [alternative ordering] ... 152
Figure A - III.4: Cumulative orthogonalized IRFs: altering the sample & CO2 and GDP in per capita terms ... 154
Figure A - III.5: Cumulative orthogonalized IRFs: exogenous additional controls ... 156
Figure A - III.6: Cumulative orthogonalized IRFs: level of income and the Kyoto Protocol status ... 158
Figure A - IV.1: The estimated relationship between PS and CO2 [CS-ARDL-PMG approach] ... 239
Figure A - IV.2: The estimated relationship between PS and CO2 [AMG approach] ... 239
Figure A - IV.3: The estimated relationship between PS and CO2 [DMG approach] ... 239
Figure A - IV.4: The estimated relationship between PS and CO2 [PS index computed as simple average] ... 240
xviii
Figure A - IV.5: The estimated relationship between PS and CO2 [PS index computed as
geometric mean] ... 240
Figure A - IV.6: The estimated relationship between PS and CO2 [PS index computed as
harmonic mean] ... 240
Figure A - IV.7: The estimated relationship between PS and CO2 [PS index computed as
median] ... 241
Figure A - IV.8: CO2 and PS kernel density plots [subsamples] ... 241 Figure A - IV.9: CO2 and PS evolution over time and scatterplot [subsamples] ... 243
1
General Introduction and Overview
1. Context of the research
Over time, following the awareness of the adverse effects that the dynamic and multidimensional process of economic development has on the environment, the interest in maintaining and enhancing the quality of the environment has increased considerably. The First Industrial Revolution (FIR) onset was the basis for diversification and intensification of economic activities, leading to significant changes in nations' economic systems. More on this point, along with the development of the industry, various key changes interfere concerning the evolution of the economic sphere, such as (i) the gradual replacement of manual production with the mechanized ones (i.e. technical progress), (ii) the diversification of production/division of labor, (iii) the productivity gains due to increased production, (iv) the emergence of numerous conglomerates due to the process of concentration of production, and (v) shifts in the sectoral economic structure—the largest contribution to the gross domestic product belongs to the industry. Indeed, the aspects mentioned above, among others, have substantially contributed to the development of the countries, but they have also caused several threats to the environment.
Prior to the FIR, the population's activities were mainly agrarian and, thus, the connection between man and nature being also very tight. On the one hand, the FIR led to the acceleration of technological progress, which has significantly helped improve the population's living standards. However, on the other hand, the worrying increase in environmental degradation, accompanied by the alteration of the human-nature relationship, may be considered some of its main side effects. In this fashion, a straightforward example is given by the sharp increase of the atmospheric carbon dioxide (CO2) concentration, following the FIR's start. According to Figure 1, before the emergence of FIR, the average concentration of the CO2 in the atmosphere ranges between approximatively 270 and 280 parts per million (ppm), then the trend rapidly changes and the concentration reach in 2018 the record value of 400 ppm, and even exceed it. Put differently, considering an average CO2 concentration of about 277 ppm in 1760 and 400 ppm in 2018, the growth rate in 2018 compared with 1760 is roughly 44.4%.
2
Figure 1: Global CO2 atmospheric concentration
Notes: Average concentration of carbon dioxide (CO2) in the atmosphere, measured in parts per million (ppm). Source: Adapted from Ritchie & Roser (2017) based on National Oceanic and Atmospheric Administration (NOAA)/Earth System Research Laboratories (ESRL) (2018).
https://ourworldindata.org/co2-and-other-greenhouse-gas-emissions
Broadly speaking, two clear-curt conclusions may be drawn by evaluating this simple suggestive plot. First, globally, environmental degradation has reached unprecedented levels, endangering the well-being of societies. Second, its exponential evolution suggests, among others, the difficulty of combating these kinds of phenomena once they have been triggered. As Figure 1 illustrates, despite the passage of new industrial stages that assume, among others, an evolution of societies in terms of technologies and methods to mitigate environmental degradation, and also an inevitable shift in population's perceptions of environmental issues, the atmospheric concentration of CO2 has remained steady upward. These facts indicate that the efforts made today in the fight against climate change may only be seen after a fairly long period, while consistent international cooperation may underpin the efficacity of the related actions.
Accordingly, the last decades' actions of (supra)national authorities and several profile organizations, have been directed towards finding an equilibrium point between economic development and the environment, namely to ensure sustainable development. On this path, at the international level, the United Nations (UN) put into place the United Nations Framework Convention on Climate Change (UNFCCC), whose main scope is to adjust the "greenhouse gas (GHG) concentrations in the atmosphere at a level that would
3
prevent dangerous anthropogenic interference with the climate system" (UN, 1992, p. 9).1
On the one hand, under this framework has been adopted the well-known Kyoto Protocol and the Paris Agreement, which governs the parties' actions regarding the reduction of GHG emissions. Notably, the former treaty has targeted merely the developed states, while the latter agreement has labor the point towards the involvement of both industrialized and developing economies in tackling climate change.
On the other hand, within the Kyoto Protocol also operates three flexible mechanisms, one of which [i.e. the Clean Development Mechanism (CDM)] is designed to jointly engage developed and developing states in limiting emissions and securing sustainable development. Specifically, industrialized countries (i.e. Annex B Parties to the Kyoto Protocol) can contribute to meeting their climate commitments by purchasing the Certified Emission Reductions (CERs) issued following the implementation of projects and/or programs aimed to reduce GHG emissions in developing economies (i.e. Non-Annex I states). Indeed, probably as any other market-based mechanism, the CDM has its weaknesses and strengths [see e.g. Carbon Market Watch (CMW), 2018] but, overall, it has proven to be an effective tool in the fight against climate change [see UN Climate Change (UNCC), 2018]. Based on the last report mentioned above, over the period 2001-2018, the CDM has engaged 140 countries (36 being included in the group of 46 of the poorest countries in the world), while the projects and programs that have been registered in 111 developing countries have reached a record number of 8116. Moreover, among its many achievements, one of the most prominent is the equivalent reduction of roughly 2 billion tonnes of CO2 in Non-Annex I economies (i.e. 2 billion CERs have been issued due to a reduction in emissions through the projects and programs implemented in developing states), following the financing of the significant number of climate action projects totaling 303,8 billion US$ (UN, 2018).
Certainly, the CDM has represented a first step regarding the involvement at the global level of developing countries in the fight against climate change, paving the way for a more active contribution of these states in reducing GHG emissions alongside the developed ones. In this vein, the Paris Agreement has provided a novel framework concerning the actions aimed at tackling climate change, which equally targets both
1https://unfccc.int/files/essential_background/background_publications_htmlpdf/application/pdf/conve
4
industrialized and developing economies. Likewise, it has established the basis of the CDM’s predecessor, namely the Sustainable Development Mechanism (SDM), which borrows some of the characteristics and builds on the shortcomings that CDM has revealed during its implementation; thus, post-2020, the SDM may represent the next phase of international carbon markets and a vital tool in lowering the global emissions levels (CMW, 2017).
As stated previously, regarding climate change mitigation, the emphasis was initially put more on industrialized economies due to their predisposition to pollute more than developing countries and financial capacity to contribute to related actions. However, along with economic development, circumstances are gradually changing, and major transformations occur in developing countries from both economic, social, and political perspectives, leading (more or less) to an increase in environmental degradation. As such, their propensity to contribute to the worsening of climate change is growing concurrently with their active involvement at the (inter)national level in combating it. Figure 2 illustrates the evolution of CO2 per capita by region and income group or other classifications, paying particular attention to developing economies. Overall, apart from the nonlinearities visible in some series' evolution, the vast majority of them seem to be characterized by an upward trend, which is more or less pronounced over the analyzed period and/or the recent years.
Figure 2: CO2 per capita emissions over time [1960-2016]
(a) by region (b) by income group and other classifications
Notes: CO2 emissions are measured in metric tonnes per capita. The starting date for the Euro Area group is 1991. We use the World Bank classification that excludes the high income economies for the regions where this is available, namely East Asia & Pacific, Europe & Central Asia, Latin America & Caribbean, Middle East & North Africa, and Sub-Saharan Africa. Source: Author’s elaboration using the World Development Indicators Data-World Bank (2020).
5
Given the (sudden) dynamics of climate change and the desire to find some legitimacies about its evolution/behavior and explore its potential determinants, the related macroeconomic literature has seen a real breakthrough. Undeniably, the wave of the research in the field was even more noticeable since the early 1990s with the
introduction of Environmental Kuznets Curve (EKC) hypothesis2 (Grossman & Krueger,
1991) and the Stochastic Impacts by Regression on Population, Affluence, and Technology
(STIRPAT) framework3 (Dietz & Rosa, 1994, 1997). These two popular theoretical
backgrounds taken separately or together, respecified or mixed with other theoretical and/or empirical foundations, have been the starting grid for numerous empirical and theoretical works that have targeted the drivers (especially economic growth) of environmental degradation. Besides, since their genesis several other theoretical studies (see e.g. Xepapadeas, 2005; Brock & Taylor, 2010; Kijima et al., 2010; Ordás Criado et al., 2011) have provided various insights with respect to pollution-growth nexus, adding to the general understanding of this seemingly simplistic relationship which, eventually, turned out to be much more complex. Also, this rapidly expanding literature has been the starting point for many surveys, criticisms, and recommendations, both in terms of the underlying economic theory, and econometric and statistical aspects (see e.g. Stern et al., 1996; Borghesi, 1999; Lieb, 2003; Stern, 2004; He, 2007; Wagner, 2008; Aslanidis, 2009; Vollebergh et al., 2009; Carson, 2009; Stern, 2010; Bo, 2011; Pasten & Figueroa, 2012; Kaika & Zervas, 2013a, b; Bernard et al., 2014; Hervieux & Mahieu, 2014; Stern, 2015; Sen et al., 2016; Stern et al., 2017; Tiba & Omri, 2017). However, in the light of those mentioned above, most studies have mainly focused on developed countries, while specific groups of states such as developing and transition ones have not received such great attention. Lately, the literature has started to develop in this direction, but the empirical evidence can still be considered scarce.
Building on these facts and in consonance with the UN Sustainable Development Goals (SDGs), we exploit the peculiarities of transition and developing economies (e.g. the liberalization and globalization process, energy transition and its efficiency, sectoral structure, environmental prospects, among others) to pinpoint the impact of economic
2 According to traditional EKC, the relationship between economic growth and environmental degradation
follows a bell-shaped pattern.
3 The STIRPAT framework represents the stochastic counterpart of IPAT identity proposed by Ehrlich &
Holden (1971, 1972), based on which the human pressures on the environment are computed as a product between three terms: population, affluence, and technology.
6
development—through its three dimensions namely, economic, social and political—on environmental degradation as effectively as possible. More specifically, depending upon the context, along with the commonly acknowledged determinant of environmental pollution, namely the economic growth (see e.g. the peioneering works of Shafik & Bandyopadhyay, 1992; Panayotou, 1993; Shafik, 1994; Stern et al., 1996; Panayotou, 1997; Dasgupta et al., 2002; Coondoo & Dinda, 2002; Stern, 2003, 2004; Martinez-Zarzoso & Bengochea-Morancho, 2004; and the more recent studies of Kasman & Duman, 2015; Yang et al., 2015; Hanifa & Gago-de-Santos, 2017; Ozokcu & Ozdemir, 2017; Alvarado et al., 2018; Albulescu et al., 2019; Awad, 2019; Destek & Sarkodie, 2019; among others), we explore the potential impact of other key aspects of economic development process, which are more related to its social and political dimensions, namely the urbanization (see e.g. Poumanyvong & Kaneko, 2010; Martínez-Zarzoso & Maruotti, 2011; Zhu et al., 2012; Liddle, 2013; Sadorsky, 2014a; Wang et al., 2015; Wang et al., 2016; Chen et al., 2019; Xie & Liu, 2019; among others), and political stability, respectively (see e.g. Desai, 1998; López & Mitra, 2000; Welsch, 2004; Cole, 2007; Leitão, 2010; Gani, 2012; Halkos &
Tzeremes, 2013; Zhang et al., 2016; Joshi & Beck, 2018; among others).4
Consequently, this thesis contributes to the nascent literature on economic development's effects on environmental quality in transition and developing countries. In this vein, aiming to broaden the knowledge in the field, we provide four genuine essays, one literature survey, and three empirical essays whose objectives stem to some extent from the lessons learned following the literature survey.
2. A glimpse on thesis' data and methodology
2.1. Data
Given that the thesis aims to provide original empirical evidence and contribute to the literature on the environmental pollution-economic development nexus for transition
4 Concerning the link between urbanization/political stability and environmental degradation, some studies
control to a greater or lesser extent for their potential effects, while exploring the impact of other phenomena on environmental pollution [see e.g. Iwata & Okada (2014), Li et al. (2016), Awad & Warsame (2017), Lin & Zhu (2017), Joshi & Beck (2018) for urbanization, and Shahbaz et al. (2013), Ozturk & Al-mulali (2015), Abid (2017), Sarkodie & Adams (2018) for political stability. Furthermore, it is worth noted that regarding the political stability as a whole, most of the works investigate the effects of its different components on environmental pollution (or put in other words the political stability is proxied by various indicators related to political system) such as corruption, governance, democracy, institutional quality, among others.
7
and developing countries, the data collection necessary for the empirical analysis may be challenging. It is generally agreed that concerning the transition economies, the data quality and availability are relatively poor for the years that precede the fall of the Communist Bloc. The same holds for several low and lower-middle income states, whose series of macroeconomic indicators, for certain reasons, are completely missing for specific periods or display missing values.
The first chapter being a literature survey that comprises, among its specific elements, a short empirical exercise, does not require extra effort for data collection. However, we mention that for some countries included in our descriptive investigation, the series values are available only starting with 1990.
The second chapter focuses on Central and Eastern European (CEE) states, which experienced major imbalances at the beginning of the 1990s. Thus, we mitigate such instabilities by restricting our sample to start only in 1996. This period allows obtaining a relatively well-balanced sample around a critical period that triggered important structural changes, namely the mid-period of the two dates of European Union (EU) enlargement with CEE countries (2004 and 2007, with Croatia joining EU in 2013). On top of that, starting our analysis with 1996, we control for the possible hard times that these economies cross after the end of the Cold War.
Regarding the last two chapters (the third and fourth one), which target the low and lower-middle income countries, the samples' members are solely selected according to data availability. Likewise, we also set the time dimension starting point (i.e. 1992 for the third chapter and 1990 for the last one), taking into account the lack of observations for the primary indicators. Indeed, having the starting year at the beginning of the 1990s, we also avoid the distortions caused by both the Soviet Empire's collapse and/or the end of the Cold War. Besides, via the robustness checks, depending on the period examined, we drop the years before and/or following the end of the Cold War to further control for its potential detrimental effects.
Overall, the empirical studies of the thesis resort to various data sources, namely Emissions Database for Global Atmospheric Research (Janssens-Maenhout et al., 2017), World Bank Indicators, Eurostat, Heritage Foundation, KOF Swiss Economic Institute (Dreher, 2006; Gygli et al., 2019), Observatory of Economic Complexity (Haussman &
8
Hidalgo, 2009; Hausman et al., 2011), UN Development Programme, Global Footprint Network, European Environmental Agency, International Country Risk Guide of Political Risk Services Group, and UN Conference on Trade and Development.
2.2. Methodology
The empirical strategy employs in each chapter seeks to fit as well as possible on the characteristics of the sample, and the uni- and multi-variate properties of the variables under investigation. Consequently, in light of the progress in statistics and econometrics, we try to keep up with it as much as possible, using a series of modern statistical and econometric techniques to capture the phenomena studied with a high degree of accuracy.
In the first chapter, complementary to some classical descriptive techniques, we also use with illustrative purposes several nonparametric ones. These nonparametric methods, such as local linear, local polynomial, and lowess regression, are implemented to consolidate our judgment with respect to the potential patterns between the variables. Next, the econometric modeling in the second chapter relies on three estimators, namely the Mean Group (MG) (Pesaran & Smith, 1995), the Mean Group Fully Modified Least Squared (MG-FMOLS) (Pedroni, 2000, 2001), and the Augmented Mean Group estimator (AMG) (Eberhardt & Teal, 2008, 2010; Eberhardt & Bond, 2009), which have good small sample properties and deals with the variables' nonstationary and cointegration. Moreover, these estimators are designed for heterogeneous slope coefficients panel data models, where cross-sectional dependence (the AMG approach) may be at work. As well, the A(MG) techniques allow the estimation of country-specific regressions, while they are also robust to a different order of variables' integration.
To answer the third chapter's research questions from a methodological standpoint, we employ the panel vector autoregression (VAR) analysis. In this manner, bearing in mind the sample's features, we specify a generalized method of moments (GMM) panel VAR model in the spirit of Love & Zicchino (2006) and Abrigo & Love (2016). This quite appealing empirical strategy allows us to further compute, based on the model's estimations, the important impulse response functions (IRFs), and forecast-error variance decompositions (FEVDs), which help us shape the conclusion regarding the study's main objective.
9
In the last chapter, we model the nexus between variables using the Panel Autoregressive Distributed Lag (ARDL) approach. In this regard, given the cointegration presence, we employ the panel vector error correction model (PVECM) version of the ARDL technique, which enables us to retrieve both the long-run elasticities and short-run dynamics between variables. Specifically, in line with the assumed hypotheses, we center our analysis around the technique preferred by the data, namely the Pool Mean Group (PMG) estimator coined by Pesaran et al. (1999). Furthermore, to control for the correlation across countries, in the robustness section we employ a set of four much novel techniques, namely the Cross-Section Augmented ARDL (CS-ARDL) (Chudik et al., 2013), the Cross-Section Augmented Distributed Lag (CS-DL) (Chudik et al., 2013; Chudik et al., 2016), the Common Correlated Effects (CCE) (Pesaran, 2006; Chudik & Pesaran, 2015) and the AMG approach (Eberhardt & Teal, 2008, 2010; Eberhardt & Bond, 2009). It is also worth mentioning that depending on the technique, we employ its error correction counterpart, relax the long-run slope coefficients poolability assumption, and specify a static or dynamic model.
In sum, this thesis's methodology falls within the one specific to the panel time-series data models, where the nonstationarity, cointegration, slopes heterogeneity, and cross-sectional dependence may be considered a concern—all together or mixtures between them.
3. Thesis outline
Chapter I «New Insights into the Environmental Kuznets Curve Hypothesis in Developing
and Transition Economies: A Literature Survey» gives a fresh look on the literature
concerned with examining the pollution-growth nexus via the EKC hypothesis in developing and transition economies. Overall, the previous related works have provided mixed empirical findings regarding the EKC validity, while, during the years, several theories that have tried to explain the potential bell-shaped pattern between environmental degradation and economic growth have emerged in the literature. Our study brings together into an integrated setup, both the most well-known economic reasonings behind the EKC incidence and a significant number of empirical papers published in the last decade in various top journals in the field. Indeed, on the one hand, focusing on a more homogeneous group of countries such as developing and transition
10
economies, which possess a series of particularities compared to developed nations, we can obtain specific insights and better understand the well-debatable relationship between pollution and growth. On the other hand, we certainly could not deny that the advance in statistical and econometric techniques and the increase in data availability/quality have changed how researchers address the EKC hypothesis. Thus, we expect to observe some improvements in its prediction and the associated threshold value.
More specifically, to offer a more comprehensive picture of the pollution-growth nexus and, ultimately, distinguish whether the empirical works have managed to overcome the shortcomings suggested by the theory, we proceed as follows. First, we cover in our theoretical survey the economic rationale behind EKC and the crucial components of the research design when estimating it, namely the model specification, assumptions, econometric methodology, and identification strategy. In short, we discuss not only the economic theory behind EKC but also the advance in the econometric tools. Second, using descriptive and several nonparametric techniques, we conduct a short descriptive empirical exercise to disentangle the pollution-growth pattern for four top global CO2 emitters (namely China, the European Union, India, and the Russian Federation), and also at the global level. Third, in the empirical survey, we differentiate between panel-data and time-series studies, while we also discuss some new econometric perspectives regarding the modeling of environmental degradation-economic growth nexus.
According to the empirical review, several studies find a long-term relationship between indicators, strengthening EKC's intrinsic nature. Also, the bell-shaped pattern is invoked quite often as an empirical result among many of these works. Thus, it seems that the difficult times experienced by developed countries in terms of achieving sustainable development, among others, have been a solid foundation of valuable know-how for developing ones, helping them to get through this stage much more quickly. Nonetheless, some studies find turning point values that exceed the upper or lower income range limit. This may indicate that economic growth still increases environmental degradation and/or the associated identification strategy is deficient.
Regarding the identification strategy and research design in general, it seems that many problematic aspects raise by the theory have been mitigated along with the
11
progress in statistical and econometric tools. Moreover, our short nonparametric descriptive exercise may highlight the importance of using complementary techniques, among other robustness checks, to guarantee the high accuracy of results before concluding. In this fashion, new techniques borrowed from other spheres, such as the wavelet analysis that moves beyond the time domain, can bring ancillary information and provide a different view on modeling the relationship between environmental quality and economic growth.
Overall, this chapter attempts to offer a more comprehensive and updated assessment of the evolution of the relationship between environmental quality and economic growth through EKC. Dividing our survey into three different key phases, namely (i) theoretical review, (ii) empirical exercise, and (iii) empirical review, while targeting a group of economies that have not enjoyed much attention in the literature, and with a slightly different role in terms of involvement in international climate change agreements compared to developed countries, we aim to provide new valuable insights on this subject. In addition, this review offers a solid basis for valuable information that helps us identify gaps in the literature that we address empirically in subsequent studies that shape this thesis.
Chapter II «Pollution and Economic Growth: Evidence from Central and Eastern
European Countries» examines the relationship between pollution (expressed by CO2
emissions per capita) and economic growth (expressed by GDP per capita) in eleven CEE countries. Referred as transition economies, the CEE states have undergone laborious changes on their path to liberalization (i.e. the transition from a socialist economy to a market economy) that has involved several economic, social, and political processes. By all means, these transformations have shifted in one way or another how the authorities and the population relate to the environmental issues, perceive the news about climate change, and, ultimately, react to all these aspects. In the wake of the aforementioned, in our analysis, we start from the premise that economic growth and other adjacent processes at the macroeconomic level may significantly impact environmental degradation.
Motivated by the sparse literature on this group of economies, we build our study around the intuition that these countries may have different development paths, and their economies carry the footprint associated with past communist regimes. Concerning the

![Table II.8: Country-specific estimates [cubic specification]](https://thumb-eu.123doks.com/thumbv2/123doknet/14556480.726091/104.892.25.876.125.280/table-ii-country-specific-estimates-cubic-specification.webp)