RESEARCH OUTPUTS / RÉSULTATS DE RECHERCHE
Author(s) - Auteur(s) :
Publication date - Date de publication :
Permanent link - Permalien :
Rights / License - Licence de droit d’auteur :
Bibliothèque Universitaire Moretus Plantin
Dépôt Institutionnel - Portail de la Recherche
researchportal.unamur.be
University of Namur
Assessment of the analytical performances and sample stability on ST Genesia system
using the STG-DrugScreen application
Douxfils, Jonathan; Morimont, Laure; Bouvy, Céline; de Saint-Hubert, Marie; Devalet,
Bérangère; Devroye, Célia; Dincq, Anne-Sophie; Dogné, Jean-Michel; Guldenpfennig, Maïté;
Baudar, Justine; Larock, Anne-Sophie; Lessire, Sarah; Mullier, François
Published in:
Journal of thrombosis and haemostasis : JTH
DOI:
10.1111/jth.14470
Publication date:
2019
Document Version
Publisher's PDF, also known as Version of record
Link to publication
Citation for pulished version (HARVARD):
Douxfils, J, Morimont, L, Bouvy, C, de Saint-Hubert, M, Devalet, B, Devroye, C, Dincq, A-S, Dogné, J-M,
Guldenpfennig, M, Baudar, J, Larock, A-S, Lessire, S & Mullier, F 2019, 'Assessment of the analytical
performances and sample stability on ST Genesia system using the STG-DrugScreen application', Journal of
thrombosis and haemostasis : JTH, vol. 17, no. 8, pp. 1273-1287. https://doi.org/10.1111/jth.14470
General rights
Copyright and moral rights for the publications made accessible in the public portal are retained by the authors and/or other copyright owners and it is a condition of accessing publications that users recognise and abide by the legal requirements associated with these rights. • Users may download and print one copy of any publication from the public portal for the purpose of private study or research. • You may not further distribute the material or use it for any profit-making activity or commercial gain
• You may freely distribute the URL identifying the publication in the public portal ? Take down policy
If you believe that this document breaches copyright please contact us providing details, and we will remove access to the work immediately and investigate your claim.
J Thromb Haemost. 2019;17:1273–1287. wileyonlinelibrary.com/journal/jth
|
1273 Received: 8 January 2019|
Accepted: 29 April 2019DOI: 10.1111/jth.14470
O R I G I N A L A R T I C L E
Assessment of the analytical performances and sample
stability on ST Genesia system using the STG‐DrugScreen
application
Jonathan Douxfils
1,2| Laure Morimont
1| Céline Bouvy
2|
Marie de Saint‐Hubert
3| Bérangère Devalet
4| Célia Devroye
5| Anne‐Sophie Dincq
6|
Jean‐Michel Dogné
1| Maïté Guldenpfennig
5| Justine Baudar
5| Anne‐Sophie Larock
7|
Sarah Lessire
6| François Mullier
51Department of Pharmacy, Namur Research Institute for Life Sciences, Namur Thrombosis and Hemostasis Center, University of Namur, Namur, Belgium 2Qualiblood s.a., Namur, Belgium 3Department of Geriatric, CHU UCL Namur, Université catholique de Louvain, Yvoir, Belgium 4Department of Hematology, Namur Research Institute for Life Sciences, Namur Thrombosis and Hemostasis Center, CHU UCL Namur, Université catholique de Louvain, Yvoir, Belgium 5Hematology Laboratory, Namur Research Institute for Life Sciences, Namur Thrombosis and Hemostasis Center, CHU UCL Namur, Université catholique de Louvain, Yvoir, Belgium 6Department of Anesthesiology, Namur Research Institute for Life Sciences, Namur Thrombosis and Hemostasis Center, CHU UCL Namur, Université catholique de Louvain, Yvoir, Belgium 7Department of Pharmacy, Namur Research Institute for Life Sciences, Namur Thrombosis and Hemostasis Center, CHU UCL Namur, Université catholique de Louvain, Yvoir, Belgium This is an open access article under the terms of the Creat ive Commo ns Attri bution-NonCo mmercial License, which permits use, distribution and reproduction in any medium, provided the original work is properly cited and is not used for commercial purposes.
© 2019 The Authors. Journal of Thrombosis and Haemostasis published by Wiley Periodicals, Inc. on behalf of International Society on Thrombosis and Haemostasis Manuscript handled by: Robert Gosselin Final decision: Robert Gosselin, 29 April 2019 Correspondence Prof. Jonathan Douxfils, University of Namur, Department of Pharmacy, NAmur Research Institute for LIfe Sciences, Namur Thrombosis and Hemostasis Center, Qualiblood s.a., Namur, Belgium. Email: jonathan.douxfils@unamur.be
Abstract
Background: Thrombin generation testing has been used to provide information on the coagulation phenotype of patients. The most used technique is the calibrated au-tomated thrombogram (CAT) but it suffers from a lack of standardization, preventing its implementation in routine. The ST Genesia is a new analyzer designed to assess thrombin generation based on the same principle as the CAT. Unlike the CAT system, the ST Genesia is a benchtop, fully automated analyzer, able to perform the analyses individually and not by batch, with strict control of variables such as temperature and volumes, ensuring, theoretically, maximal reproducibility. Objectives: This study aimed at assessing the performance of the STG-DrugScreen application on the ST Genesia analyzer. We also aimed at exploring stability of plasma samples after freezing and defining a reference normal range.Results: Results demonstrated the excellent interexperiment precision of the
1 | INTRODUCTION
Thrombin generation has been used since the early 1950s.1 At
the start, whole blood or plasma was supplemented with triggers such as tissue factor or activator of the intrinsic pathway of the coagulation combined with calcium chloride to initiate coagula-tion. Thrombin generation was then evaluated by sampling the clotting mixture at regular intervals into a test tube containing fibrinogen. The clotting times were then recorded and the quan-tity of thrombin generated was derived from a calibration curve
constructed with a known amount of thrombin.2 Changes have
been made and the test was improved by replacing fibrinogen by a chromogenic substrate specific for thrombin. This required the use of defibrinated plasma and a computer was used to calculate
the parameters stemming from the thrombogram.3 Finally, the
chromogenic substrate was replaced by a fluorogenic substrate, which permits the measurement of thrombin in samples that were not defibrinated because fluorescence is not hampered by the tur-bidity generated during the clotting process. These improvements have laid the groundwork for what is now known as calibrated
automated thrombogram (CAT).4 Currently, different solutions
are available on the market to measure thrombin generation.5
These are the Innovance ETP (Siemens Healthcare), the only one still based on the cleavage of a chromogenic substrate as readout, the Technothrombin TGA (Technoclone) and the Thrombinoscope CAT (Diagnostica Stago). These last two both use a fluorogenic
substrate5; however, some limitations have been highlighted, such
as the lack of established standardization of the methods and re-agents, and missing quality controls. In addition, batch-to-batch variations have been reported which further hampers
study-to-study comparisons.6‒8 As a consequence, efforts have been made since the past decade to reduce the interlaboratory variation, such as the use of a reference plasma to normalize the results.9 Without the use of this reference plasma, coefficient of variation (CVs) for the most global parameter of CAT (i.e., the endogenous thrombin potential [ETP]), were often higher than 15%. This also raised the question of different local
practices which may explain, in part, this high CV.10 Even if this strat-egy appeared to efficiently reduce the interlaboratory variation and showed the potential benefit of results normalization, improvements are still needed to ensure a proper standardization of the method and its implementation in the routine daily care of patient. Namely, it has been reported that standardization of the tested conditions (e.g., control of the temperature throughout the process, preheating of the sample and the reagents, collection tube or centrifugation) may significantly affect the CAT parameters.8‒11 Thus, for its implemen-tation in routine daily care, the CAT system had to move to a next generation of analyzers able to perform the analyses individually and not by batch, with strict control of all variables to ensure maximal reproducibility. The newly developed ST Genesia is a fully automated system in- tended to measure thrombin generation. It provides capacity to con-tinuously load patients’ samples for unitary testing. This new system has been designed to offer enhanced reproducibility compared with CAT and also to provide traceability and standardization, two criteria necessary to fulfill the requirements of an in vitro diagnostics format and to enter the clinical laboratory.
Numerous studies showed that thrombin generation measure-ment is sensitive enough to detect the presence of anticoagulants in inter-experiments variability. Stability revealed that plasma samples are stable for at least 11 months at −70°C or lower, except for those containing low molecular weight heparins which have to be tested within 6 months. Freezing had no effect on the ma-jority of thrombin generation parameters except on time to peak. Conclusions: Our results suggest an easy implementation of thrombin generation with the use of ST Genesia in the routine laboratory. This will facilitate the design of mul- ticentric studies and enable the establishment of reliable and evidence-based thresh-olds, which may improve the management of patients treated with anticoagulants. K E Y W O R D S anticoagulants, blood coagulation tests, clinical laboratory techniques, normal range, reproducibility Essentials • Thrombin generation testing is widely used to provide information on the coagulation phenotype of patients. • Some limitations have been highlighted such as the lack of established standardization. • This is the first study reporting precision results of the ST Genesia.
• Normal range of the STG-DrugScreen application has been assessed in healthy subjects.
• The ST Genesia may facilitate the implementation of thrombin generation in the routine laboratory.
patients’ plasma and to evaluate the intensity of the treatment12‒19
therefore, Diagnostica Stago aimed at developing a kit for the as-sessment of thrombin generation in anticoagulated patients, the STG-DrugScreen. The first aim of this study was to determine the precision of the device with this kit and the utility of the normaliza-tion of the results. Second, this study aimed at assessing the stability of the plasma samples over time after freezing as well as defining the normal range of the STG-DrugScreen application in a normal healthy population.
2 | MATERIALS AND METHODS
The study intends to evaluate the precision performance of the de-vice under final user setting and investigate the stability of thrombin generation results on samples stored at −70°C or lower. The study was in accordance with the Declaration of Helsinki and has been approved by the Ethical Committee of the CHU UCL Namur, Yvoir, Namur, Belgium. The study took place from June 2016 to September 2017 at the CHU UCL Namur, Yvoir, Belgium.
2.1 | Plasma collection of patients’ and healthy
donors’ samples
Blood was taken by venipuncture in the antecubital vein and collected into 0.109 M sodium citrate (9:1 v/v) tubes (Vacuette, Greiner, Austria) without corn trypsin inhibitor using a 21-gauge needle (Terumo). The first tube was always discarded and the first centrifugation was per-formed within 30 minutes. The platelet-poor plasma (PPP) was obtained from the supernatant fraction of blood tubes after a double centrifuga-tion for 15 minutes at 1500 × g at room temperature. The centrifuge brake was set to the minimum position at the end of the process. The residual platelet count was assessed every week to ensure the centrifu- gation procedure provides plasma with a platelet count <10,000 plate-lets/μL. Immediately after centrifugation, PPP was aliquoted by 600 μL (n = 12 for the stability study, n = 4 for the normal range definition study) and frozen at ≤−70°C without any delay (except for one aliquot tested fresh in the stability study). Frozen PPP samples were thawed, heated to 37°C for 2-3 minutes and mixed gently just before the experiment. All tests were performed within 4 hours after thawing.2.2 | Normal and targeted population and samples
Six healthy individuals and 23 samples from patients treated with an anticoagulant have been included in the stability study (apixaban n = 4; dabigatran n = 3; low-molecular-weight heparins [LMWH] n = 5; rivaroxaban n = 5; vitamin K antagonists [VKA] n = 6). For patients on apixaban, dabigatran, and rivaroxaban, plasma had to be taken at peak (i.e., between 30 minutes and 4 hours after drug intake) to obtain the highest effect on thrombin generation. For patients under LMWH, the blood had to be taken between 1 and 6 hours after the administration while for patients under VKA, the targeted international normalized ratio (INR) was between 2 and 3.For the definition of the normal range, 42 healthy individuals (mean age = 20 ± 3 years; min-max range = 18-32 years), not taking any antithrombotic therapy and not having any hemostasis disorders were included in the study.
2.3 | Assessment of thrombin generation
Thrombin generation has been assessed on an ST Genesia analyzer using the STG-DrugScreen application. More information about the analyzer, its methodology and the reagents are provided in the sup-plementary material.
2.4 | Assessment of anticoagulant activity with
specific tests
For patients on apixaban, rivaroxaban, and LMWH, the estimated concentrations or the anti-Xa activity have been measured using the STA-Liquid Anti-Xa (Diagnostica Stago) and the correspond-ing calibrators and controls accordcorrespond-ing to the recommendations of the manufacturer on an STA-R Max analyzer (Diagnostica Stago). For dabigatran samples, the estimated dabigatran plasma concen-trations have been measured using the STA-ECA II (Diagnostica Stago) with the corresponding calibrators and controls. For VKA pa-tients, the INRs have been measured with the STA–Neoplastine R (Diagnostica Stago) according to the recommendations of the manu-facturer. For healthy individuals, the prothrombin time (PT) and the activated partial thromboplastin time (aPTT) have been assessed using the STA–Neoplastine R (Diagnostica Stago) and the STA-C.K. Prest (Diagnostica Stago) according to the recommendations of the manufacturer.
2.5 | Determination of the precision of the ST
Genesia in its STG‐DrugScreen application
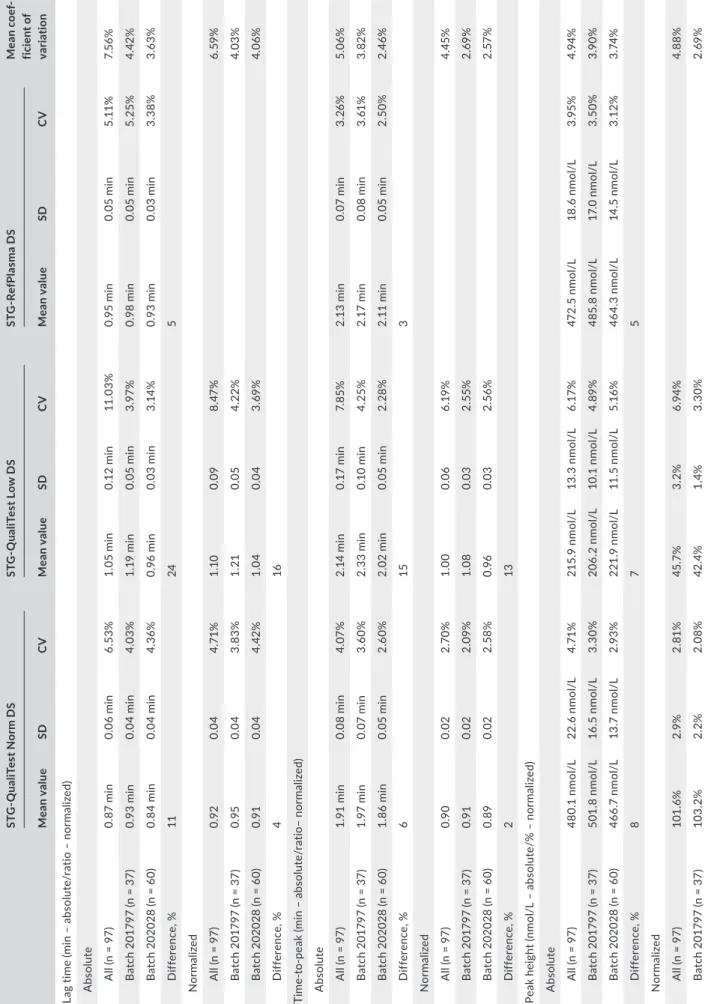
Each day of testing (n = 97), a new calibration is set and the quality controls (two levels) and the reference plasma are assessed. During the study period, two batches of reagent kits were used (batch 201797, from 21 June 2016 to 3 November 2016, and batch 202028, from 4 November 2016 to 29 September 2017). The precision has been assessed by collecting the daily values of the quality controls (two levels [i.e., the STG-QualiTest Norm DS and the STG-QualiTest Low DS]) and the reference plasma (i.e., the STG-RefPlasma DS) over this period. Both the absolute and normalized results of the lag time, time-to-peak, ETP, and peak height were extracted, and the mean, standard deviation and CV computed from those results.
2.6 | Determination of the stability after
freezing of the plasma samples for thrombin
generation measurement
Fresh plasma from the six healthy individuals, six patients on VKA, five on LMWH, four on apixaban, three on dabigatran, and five on ri-varoxaban were tested at different time points to assess the stability
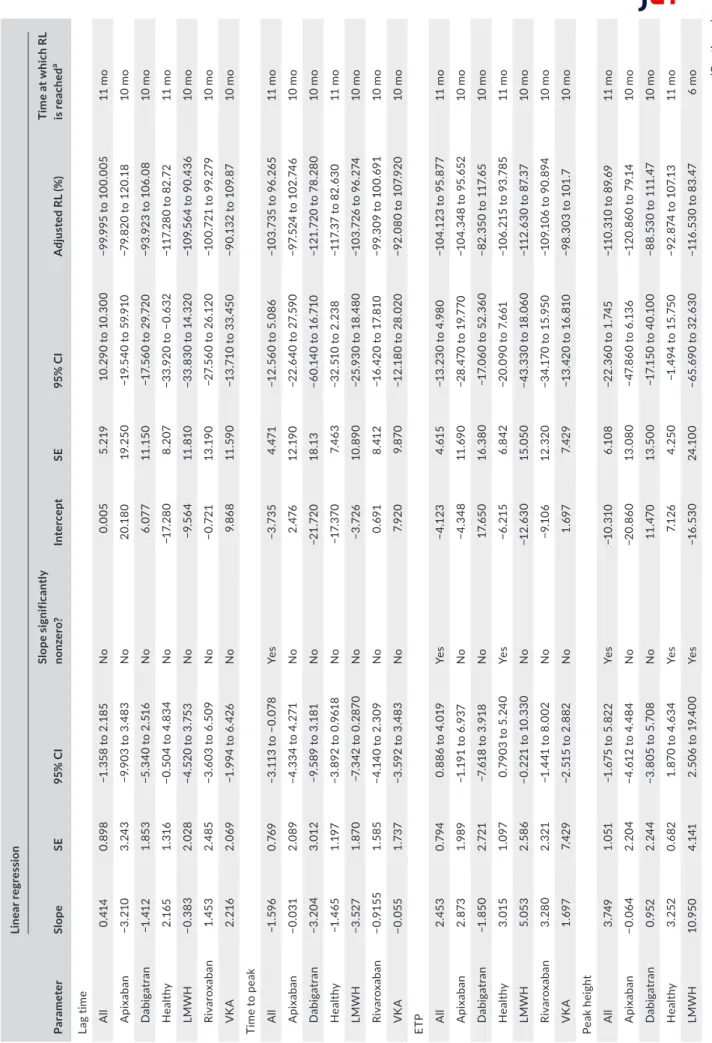
of the different thrombin generation parameters over time. Testing was performed on follows. • On a fresh sample (the day of plasma collection after centrifugation) • At day 1, month 1, month 3, month 6, month 9, month 10, and month 11 (for healthy individuals only) after freezing at −70°C or lower. The maximal deviation tolerated was 7 days except for day 1 for which no deviation was tolerated. The stability of thrombin generation results once the plasma has been frozen at −70°C or lower was assessed on the lag time, time-to-peak, ETP, and peak height using the method of the rejection limit (RL). This method aims to establish the length of time during which the measurement of the thrombin generation is acceptable, when carefully following laboratory's established sample handling and storage conditions. Briefly, the percent bias (or the %RL) was plotted vs time for each time point. The regression line of this plot represents the average percent bias (proportional change) over time. For each parameter, the 100% RL is defined based on the maximal allowable error (MAE). To take into account method precision, reagents aging, and sample aging, the MAE was set at 20% for the ETP and at 18% for the lag time, time-to-peak, and the peak height. The RL is also adjusted according to the value of the intercept of the linear regression with the y axis. The maximal sample stability is defined as the intercept of the 95% confidence interval (CI) of the linear regression with the adjusted rejection limit. If there is no interception, the maximal duration limit is de-fined as the last point of measurement (see the Results section and Figures 1 and 2 for graphical representation). F I G U R E 1 Stability of the different thrombin generation parameters. The 100% rejection limit (RL) has been defined as the maximal allowable error (MAE). For the endogenous thrombin potential (ETP), the MAE was 20% and for the lag time, time to peak, and the peak height; the MAE was 18% based on the data from the precision study. The Y-intercept was used to determine the adjusted RL (upper adjusted RL = 100 + Y-intercept – lower adjusted RL = −100 + Y-intercept). The 95% confidence interval of the linear regression (blue hashed zone) do not cross the adjusted RL, which means that the samples are stable over the analyzed period (i.e., 11 months for healthy subject and 10 months for anticoagulated patients) 2 4 6 8 10 –150 –100 –50 0 50 100 150 Adjusted RL Adjusted RL Time (mo) % RL Lag time Y = 0.005 + 0.414 * X 2 4 6 8 10 –150 –100 –50 0 50 100 150 Adjusted RL Adjusted RL Time (mo) % RL Peak height Y = –10.310 + 3.749 * X 2 4 6 8 10 –150 –100 –50 0 50 100 150 Adjusted RL Adjusted RL Time (mo) % RL Time to peak Y = –3.735 – 1.596 * X 2 4 6 8 10 –150 –100 –50 0 50 100 150 Adjusted RL Adjusted RL Time (mo) % RL
Endogenous thrombin potential
Y = –4.123 + 2.453 * X F I G U R E 2 Stability results for samples from patients treated with low molecular weight heparin (LMWH). The upper 95% confidence interval limit of the linear regression crosses the adjusted rejection limit (RL) after 6 months determining the maximal stability of the samples 2 4 6 8 10 –150 –100 –50 0 50 100 150 Adjusted RL Adjusted RL Time (mo) % RL Peak height LMWH Y = –16.530 + 10.950 * X
The impact of freezing was assessed comparing the results of each sample at day 0 (i.e., fresh sample) to the results obtained at day 1. To provide evidence of the normal distribution of the results, a Shapiro-Wilk test using an α-risk of 5% (two-sided CI) has been performed. If the population had not a normal distribution, then the paired results were compared using a Wilcoxon matched rank-signed test. If the distribution was normal, then the means were compared with a t test for paired samples. In both cases, a P value below 5% leads to the conclusion of significant impact of freezing on results.
3 | RESULTS
3.1 | Thrombin generation values of the reference
plasma and controls and precision of the ST‐Genesia
The within-batch variability was always below the between-batches relative differences, except for the normalized ETP of the STG-QualiTest Low DS (Table 1). The within-batch variability was always below 6%. All results are summarized in Table 1.3.2 | Impact on freezing on thrombin
generation parameters
On the total cohort (n = 29 samples), Shapiro-Wilk normality test showed normal distribution for the lag time and the ETP parame-ters, whereas the normality failed for the peak height and the time to peak. This means that, according to the statistical analysis plan, a t test for paired samples was used for the lag time and the ETP, whereas a Wilcoxon matched rank-signed test was used for the peak height and the time-to-peak. Because of a small sample size, the Wilcoxon matched rank-signed test was used when the results were stratified by treatment (Table 2).
Wilcoxon matched rank-signed test revealed no significant difference between the two conditions on lag time, peak height, and ETP, whereas the time-to-peak was impaired (mean of differ-ence = −0.15 minutes). When results are analyzed by treatment, there is no significant difference between fresh and frozen plasma (Table 2).
3.3 | Stability of the plasma samples once
conserved at −70°C or below
For the lag time, the adjusted RLs are −100% to 100%, the slope of the linear regression was equal to 0.414 (95% CI, −1.358 to 2.185). The 95% CI of the linear regression did not cross the adjusted RLs (Figure 1) and the maximal storage duration was defined as the latest point assessed in this study (i.e., 11 months for healthy vol-unteers and 10 months for anticoagulated patients). Stratification by treatment did not provide different results (Table 3). For the time to peak, the adjusted RLs were −104% to 96%, the slope of linear regression was equal to −1.596 (95% CI, −3.113 to −0.078; significant nonzero). The 95% CI of the linear regression did not cross the adjusted RLs (Figure 1) and the maximal storage dura-tion for this parameter was also defined at the latest point as-sessed in this study (i.e., 11 months). Again, stratification by treatment did not provide different results (Table 3). For the peak height, the adjusted RLs were −110% to 90%, the slope of lin-ear regression was equal to 3.749 (95% CI, −1.675 to 5.822). The 95% CI of the linear regression did not cross the adjusted RLs (Figure 1) and the maximal storage duration for this parameter was also defined at the latest point assessed in this study (i.e., 11 months). Stratification by treatment revealed that the peak height is only stable for 6 months in samples from patients with LMWH (Table 3 and Figure 2). For the ETP, the adjusted RLs were −104% to 96%, the slope of linear regression was equal to 2.453 (95% CI, 0.886-4.019). The 95%CI of the linear regression did not cross the adjusted RLs (Figure 1) and the maximal storage dura-tion for this parameter was defined at the latest point assessed in this study (i.e., 11 months). Stratification by treatment did not provide different results (Table 3).
3.4 | Thrombin generation in the normal and
targeted population
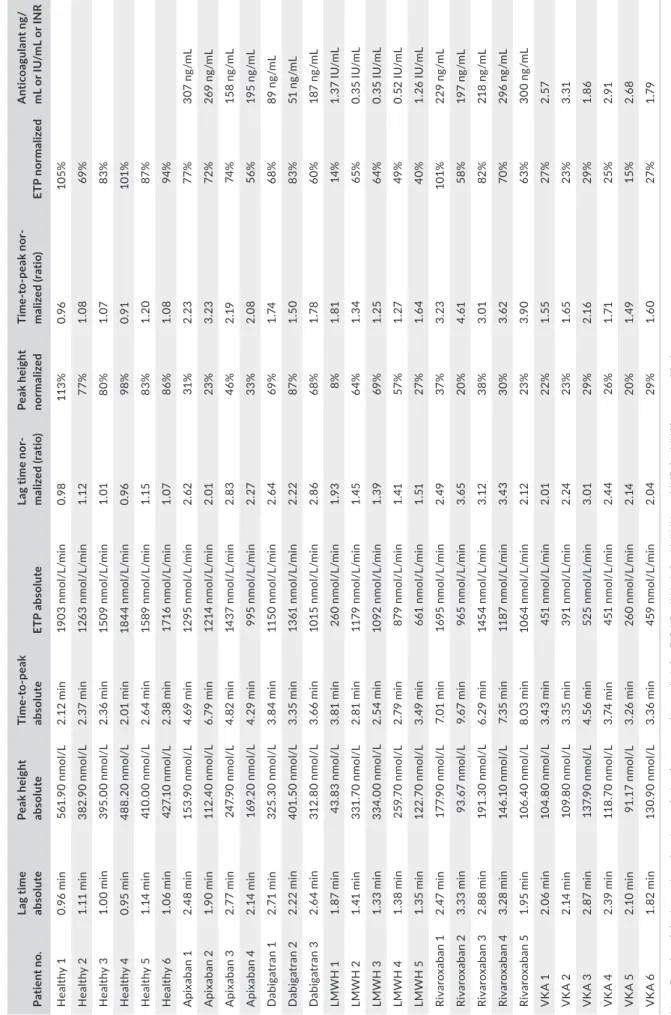
The reference values obtained in the healthy population re- vealed thrombin generation values close to the value of the ref-erence plasma (Table 4). Screening coagulation testing, namely the PT and aPTT, were normal in all healthy individuals (PT: mean = 13.7 ± 0.7 seconds; min-max range = 11.9-15.10 sec-onds; and aPTT: mean = 31.5 ± 2.5 secsec-onds; min-max range = 27.1-36.7 seconds). For apixaban, measured drug plasma levels through anti-Xa method were between 158 and 370 ng/ mL, the normalized thrombin generation parameters were all af-fected by the treatment (Table 5). No clear correlation could be drawn from this small population (n = 4) between thrombin gen-eration parameters and the plasma level. For dabigatran, peak plasma levels were between 51 and 187 ng/mL, the normalized lag time and time to peak were affected in all subjects, whereas the ETP and the peak height were not different from the healthy subjects at the lowest concentration observed (i.e., 51 ng/mL) (Table 5). For LMWH, the peak anti-Xa effect were between 0.35 IU/mL and 1.37 IU/mL. All thrombin generation parameters were affected. In the patient with the highest exposure (i.e., 1.37 IU/mL), the peak height and the ETP were highly affected (8% and 14% the value of the reference plasma, respectively) (Table 5). For rivaroxaban, the peak plasma concentrations were between 197 and 300 ng/mL. The most affected throm-bin generation parameters were the peak height and the time to peak (Table 5). In patient 1, the rivaroxaban concentration was 229 ng/mL, the peak height dropped to 37% with significant pro-longation of the time to peak but the ETP was not affected (i.e., 101% the value of the reference plasma). In patients treated with VKA, the INR varied between 1.86 and 3.31. The peak and the ETP were the most influenced thrombin generation parameters while lag time and time to peak were less influenced (Table 5).
T A B LE 1 C oe ff ic ie nt o f v ar ia tio n of th e di ff er en t q ua lit y co nt ro ls ov er 2 b at ch es o f S TG ® -D ru gSc ree n ki t ST G ‐Q ua liT es t N or m D S ST G ‐Q ua liT es t L ow D S ST G ‐R ef Pl as m a D S Mea n c oe f‐ fic ie nt o f va ria tio n Mea n v alue SD C V Mea n v alue SD C V Mea n v alue SD C V La g tim e (m in – a bs ol ut e/ ra tio – n or m al ize d) A bs ol ut e A ll (n = 9 7) 0. 87 min 0. 06 min 6. 53% 1. 05 min 0. 12 min 11 .0 3% 0. 95 min 0. 05 min 5. 11 % 7. 56 % B at ch 2 01 79 7 (n = 3 7) 0. 93 min 0. 04 min 4. 03% 1. 19 min 0. 05 min 3.9 7% 0. 98 min 0. 05 min 5. 25 % 4. 42 % B at ch 2 02 02 8 (n = 6 0) 0. 84 min 0. 04 min 4. 36 % 0. 96 min 0. 03 min 3. 14 % 0. 93 min 0. 03 min 3. 38% 3. 63 % Di ff er enc e, % 11 24 5 N or mal iz ed A ll (n = 9 7) 0.9 2 0.0 4 4. 71 % 1.1 0 0.0 9 8. 47 % 6. 59 % B at ch 2 01 79 7 (n = 3 7) 0.9 5 0.0 4 3. 83% 1. 21 0.0 5 4. 22% 4. 03% B at ch 2 02 02 8 (n = 6 0) 0.9 1 0.0 4 4. 42 % 1. 04 0.0 4 3. 69 % 4. 06 % Di ff er enc e, % 4 16 Ti m e-to -p ea k (m in – a bs ol ut e/ ra tio– n or m al ize d) A bs ol ut e A ll (n = 9 7) 1. 91 min 0. 08 min 4. 07 % 2. 14 min 0. 17 min 7. 85 % 2. 13 min 0. 07 min 3. 26 % 5. 06 % B at ch 2 01 79 7 (n = 3 7) 1. 97 min 0. 07 min 3.6 0% 2. 33 min 0. 10 min 4. 25% 2. 17 min 0. 08 min 3. 61 % 3. 82 % B at ch 2 02 02 8 (n = 6 0) 1. 86 min 0. 05 min 2.6 0% 2. 02 min 0. 05 min 2. 28 % 2. 11 min 0. 05 min 2. 50 % 2. 46 % Di ff er enc e, % 6 15 3 N or mal iz ed A ll (n = 9 7) 0. 90 0.0 2 2.7 0% 1. 00 0.0 6 6. 19 % 4. 45% B at ch 2 01 79 7 (n = 3 7) 0.9 1 0.0 2 2. 09% 1. 08 0.0 3 2. 55 % 2. 69 % B at ch 2 02 02 8 (n = 6 0) 0. 89 0.0 2 2. 58% 0.9 6 0.0 3 2. 56 % 2. 57 % Di ff er enc e, % 2 13 Pe ak h ei gh t ( nm ol /L – a bs ol ut e/ % – n or m al ize d) A bs ol ut e A ll (n = 9 7) 48 0. 1 nm ol /L 22 .6 n m ol /L 4. 71 % 21 5. 9 nm ol /L 13 .3 n m ol /L 6. 17 % 472 .5 n m ol /L 18 .6 n m ol /L 3.9 5% 4.9 4% B at ch 2 01 79 7 (n = 3 7) 50 1. 8 nm ol /L 16 .5 n m ol /L 3. 30 % 20 6. 2 nm ol /L 10 .1 n m ol /L 4. 89 % 48 5. 8 nm ol /L 17 .0 n m ol /L 3. 50 % 3.9 0% B at ch 2 02 02 8 (n = 6 0) 46 6. 7 nm ol /L 13 .7 n m ol /L 2.9 3% 22 1. 9 nm ol /L 11 .5 n m ol /L 5.1 6% 46 4. 3 nm ol /L 14 .5 n m ol /L 3.1 2% 3. 74 % Di ff er enc e, % 8 7 5 N or mal iz ed A ll (n = 9 7) 10 1. 6% 2.9 % 2. 81% 45 .7 % 3. 2% 6.9 4% 4. 88% B at ch 2 01 79 7 (n = 3 7) 10 3. 2% 2. 2% 2. 08% 42 .4 % 1. 4% 3. 30 % 2. 69 % (Co nt in ue s)
ST G ‐Q ua liT es t N or m D S ST G ‐Q ua liT es t L ow D S ST G ‐R ef Pl as m a D S Mea n c oe f‐ fic ie nt o f va ria tio n Mea n v alue SD C V Mea n v alue SD C V Mea n v alue SD C V B at ch 2 02 02 8 (n = 6 0) 10 0. 5% 2. 8% 2. 75 % 47. 8% 2.0 % 4.1 5% 3. 45% Di ff er enc e, % 3 11 En do ge no us th ro m bi n po te nt ia l ( ET P) (n m ol /L /m in – a bs ol ut e/ % – n or m al ize d) A bs ol ut e A ll (n = 9 7) 15 31 n m ol /L / min 96 n m ol /L / min 6. 26% 52 3 nm ol /L / min 22 n m ol /L / min 4. 27 % 172 2 nm ol /L /m in 72 n m ol /L /m in 4. 19 % 4.9 1% B at ch 2 01 79 7 (n = 3 7) 16 07 n m ol /L / min 65 n m ol /L / min 4. 07 % 52 4 nm ol /L / min 19 n m ol /L / min 3. 53% 17 36 n m ol /L /m in 64 n m ol /L /m in 3. 67 % 3. 76 % B at ch 2 02 02 8 (n = 6 0) 14 83 n m ol /L / min 80 n m ol /L / min 5.4 0% 52 2 nm ol /L / min 25 n m ol /L / min 4. 69 % 17 14 n m ol /L /m in 76 n m ol /L /m in 4. 45% 4. 85% Di ff er enc e, % 8 0 1 N or mal iz ed A ll (n = 9 7) 88 .9 % 4.9 % 5. 56% 30 .4 % 1. 3% 4.1 8% 4. 87 % B at ch 2 01 79 7 (n = 3 7) 92 .6 % 3.7 % 3.9 5% 30 .2% 1.1 % 3. 47 % 3. 71 % B at ch 2 02 02 8 (n = 6 0) 86 .6 % 4. 2% 4. 85% 30 .5% 1. 4% 4. 55 % 4.7 0% Di ff er enc e, % 7 1 N ote : R es ul ts a re p re se nt ed a s C V e xp re ss ed in p er ce nt ag e. F or th e 2 le ve ls o f c on tr ol s, re su lts a re p re se nt ed a s ab so lu te o r n or m al ize d (a ga in st S TG -R ef PL as m a D S) . T he u se o f a re fe re nc e pl as m a tit ra te d by a m an uf ac tu re r r ed uc es th e in te rb at ch v ar ia tio n. D iff er en ce in % re pr es en ts th e re la tiv e di ff er en ce b et w ee n th e tw o ba tc he s of re ag en ts a nd c on tr ol s fo r e ac h TG T pa ra m et er . C V, c oe ff ic ie nt o f v ar ia tio n; S D , s ta nd ar d de vi at io n; T G T, th ro m bi n ge ne ra tio n te st . T A B LE 1 (Co nti nue s)
4 | DISCUSSION
This is the first study evaluating the performances of the ST Genesia, a benchtop analyzer for thrombin generation in the routine setting. This instrument aims at introducing thrombin generation testing in the routine laboratory. Indeed, to date, the CAT system is probably one of the most used thrombin generation technique in research lab-oratories but the use of a microtiter plate, the manual placing of the sample and the reagents into the wells, added to the lack of stand-ardized procedure and reagents have prevented its introduction into TA B L E 2 Impact of freezing on thrombin generation parameters Fresh (D0) vs frozen(D1) Passed normality testing?
Mean difference (D1‐D0)
Wilcoxon matched‐pairs signed rank test or
paired t test (P value) Significant?
All results (n = 29)
Lag timea Yesa −0.08 min 0.7179a No
Peak height No 3.29 nmol/L 0.096 No
Time-to-peak No −0.15 min 0.020 Yes
ETPa Yesa 1 nmol/L/min 0.9702a No
Apixaban (n = 4)
Lag time N too small −0.09 min 0.375 No
Peak height 19.38 nmol/L 0.250 No
Time-to-peak −0.24 min 0.250 No
ETP −4 nmol/L/min 0.875 No
Dabigatran (n = 3)
Lag time N too small −0.25 min 0.250 No
Peak height 7.53 nmol/L 0.500 No
Time-to-peak −0.23 min 0.500 No
ETP 27 nmol/L/min 0.250 No
Healthy (n = 6)
Lag time N too small −0.02 min >0.999 No
Peak height −20.17 nmol/L 0.688 No
Time-to-peak −0.03 min >0.999 No
ETP −116 nmol/L/min 0.438 No
LMWH (n = 5)
Lag time N too small −0.00 min >0.999 No
Peak height 2.78 nmol/L 0.625 No
Time-to-peak −0.09 min 0.474 No
ETP 28 nmol/L/min 0.313 No
Rivaroxaban (n = 5)
Lag time N too small −0.21 min 0.063 No
Peak height 14.77 nmol/L 0.125 No
Time-to-peak −0.53 min 0.063 No
ETP 79 nmol/L/min 0.188 No
Vitamin K antagonists (n = 6)
Lag time N too small −0.02 min 0.750 No
Peak height 4.79 nmol/L 0.313 No Time-to-peak −0.04 min 0.313 No ETP 22 nmol/L/min 0.219 No Note: Wilcoxon matched pairs signed-rank test have been performed to compare the impact on freezing (i.e., at D0 on fresh and at D + 1 once the samples have been frozen). When considering all results (n = 29), freezing has an effect on time to peak. Results are also stratified by treatment but the number of samples is too small to drive any conclusion. Abbreviations: CI, confidence interval; ETP, endogenous thrombin potential; LMWH, low-molecular-weight heparin; RL, rejection limit; SE, standard error; VKA, vitamin K antagonist. aFor these analyses, a paired t test was used as the data passed the normality testing using the Shapiro-Wilk test.
T A B LE 3 St ab ili ty o f p la sm a sa m pl es o nc e fr oz en a t − 80 °C Pa ra m et er Lin ea r re gre ss io n Sl op e SE 95 % C I Slop e s ig ni fic an tly no nz er o? In ter cep t SE 95 % C I A dj us te d R L ( % ) Ti m e a t w hi ch R L is re ac he d a La g tim e A ll 0. 41 4 0. 898 −1 .3 58 to 2 .1 85 No 0.0 05 5. 21 9 10. 290 to 1 0. 30 0 −9 9. 99 5 to 1 00 .0 05 11 m o A pix aba n −3 .2 10 3. 24 3 −9 .9 03 to 3 .4 83 No 20 .1 80 19 .2 50 −1 9. 54 0 to 5 9. 91 0 −7 9. 82 0 to 1 20 .1 8 10 m o Da bi ga tr an −1 .4 12 1. 85 3 −5 .3 40 to 2 .5 16 No 6. 07 7 11 .1 50 −1 7. 56 0 to 2 9. 72 0 −9 3. 92 3 to 1 06 .0 8 10 m o H ea lthy 2.1 65 1. 316 −0 .5 04 to 4 .8 34 No −1 7. 28 0 8. 207 −3 3. 92 0 to − 0. 63 2 −1 17 .2 80 to 8 2. 72 11 m o LMW H −0. 38 3 2. 02 8 −4 .5 20 to 3 .7 53 No −9 .5 64 11 .8 10 −3 3. 83 0 to 1 4. 32 0 −1 09 .5 64 to 9 0. 43 6 10 m o Riv ar ox aba n 1. 45 3 2. 485 −3 .6 03 to 6 .5 09 No −0 .7 21 13 .1 90 −2 7. 56 0 to 2 6. 12 0 −1 00 .72 1 to 9 9. 27 9 10 m o VK A 2. 216 2. 069 −1 .9 94 to 6 .4 26 No 9. 86 8 11 .5 90 −1 3. 71 0 to 3 3. 45 0 −9 0. 13 2 to 1 09 .8 7 10 m o Ti m e to p ea k A ll −1 .5 96 0. 76 9 −3 .1 13 to − 0. 078 Ye s −3 .7 35 4. 47 1 −1 2. 56 0 to 5 .0 86 −1 03 .7 35 to 9 6. 26 5 11 m o A pix aba n −0.0 31 2. 089 −4 .3 34 to 4 .2 71 No 2. 476 12 .1 90 −2 2. 64 0 to 2 7. 59 0 −9 7. 52 4 to 1 02 .7 46 10 m o Da bi ga tr an −3 .2 04 3. 01 2 −9 .5 89 to 3 .1 81 No −2 1. 72 0 18 .1 3 −6 0. 14 0 to 1 6. 71 0 −1 21 .72 0 to 78 .2 80 10 m o H ea lthy −1 .4 65 1. 19 7 −3 .8 92 to 0 .9 61 8 No −1 7. 37 0 7. 46 3 −3 2. 51 0 to 2 .2 38 −1 17 .3 7 to 8 2. 63 0 11 m o LMW H −3 .52 7 1. 87 0 −7 .3 42 to 0 .2 87 0 No −3 .7 26 10. 890 −2 5. 93 0 to 1 8. 48 0 −1 03 .72 6 to 9 6. 27 4 10 m o Riv ar ox aba n −0 .9 15 5 1. 585 −4 .1 40 to 2 .3 09 No 0. 69 1 8. 41 2 −1 6. 42 0 to 1 7. 81 0 −9 9. 30 9 to 1 00 .6 91 10 m o VK A −0.0 55 1.7 37 −3 .5 92 to 3 .4 83 No 7. 92 0 9. 87 0 −1 2. 18 0 to 2 8. 02 0 −9 2. 08 0 to 1 07 .9 20 10 m o ETP A ll 2. 45 3 0. 794 0. 88 6 t o 4 .0 19 Ye s −4 .1 23 4. 61 5 −1 3. 23 0 to 4 .9 80 −1 04 .1 23 to 9 5. 87 7 11 m o A pix aba n 2. 87 3 1.9 89 −1 .1 91 to 6 .9 37 No −4 .3 48 11 .6 90 −2 8. 47 0 to 1 9. 77 0 −1 04 .3 48 to 9 5. 65 2 10 m o Da bi ga tr an −1 .8 50 2. 72 1 −7 .6 18 to 3 .9 18 No 17. 65 0 16. 38 0 −1 7. 06 0 to 5 2. 36 0 −8 2. 35 0 to 1 17 .6 5 10 m o H ea lthy 3. 01 5 1. 097 0. 79 03 t o 5 .2 40 Ye s −6 .2 15 6. 842 −2 0. 09 0 to 7 .6 61 −1 06 .2 15 to 9 3. 78 5 11 m o LMW H 5. 05 3 2. 58 6 −0 .2 21 to 1 0. 33 0 No −1 2. 63 0 15 .05 0 −4 3. 33 0 to 1 8. 06 0 −1 12 .6 30 to 8 7. 37 10 m o Riv ar ox aba n 3. 28 0 2. 32 1 −1 .4 41 to 8 .0 02 No −9 .1 06 12 .32 0 −3 4. 17 0 to 1 5. 95 0 −1 09 .1 06 to 9 0. 89 4 10 m o VK A 1. 69 7 7. 42 9 −2 .5 15 to 2 .8 82 No 1. 69 7 7. 42 9 −1 3. 42 0 to 1 6. 81 0 −9 8. 30 3 to 1 01 .7 10 m o Pe ak h ei gh t A ll 3. 74 9 1. 051 −1 .6 75 to 5 .8 22 Ye s −10 .3 10 6.1 08 −2 2. 36 0 to 1 .7 45 −1 10 .3 10 to 8 9. 69 11 m o A pix aba n −0.0 64 2. 20 4 −4 .6 12 to 4 .4 84 No −2 0.8 60 13 .080 −4 7. 86 0 to 6 .1 36 −1 20 .8 60 to 7 9. 14 10 m o Da bi ga tr an 0. 952 2. 24 4 −3 .8 05 to 5 .7 08 No 11 .4 70 13 .5 00 −1 7. 15 0 to 4 0. 10 0 −8 8. 53 0 to 1 11 .4 7 10 m o H ea lthy 3. 252 0. 682 1. 87 0 t o 4 .6 34 Ye s 7. 12 6 4. 25 0 −1 .4 94 to 1 5. 75 0 −9 2. 87 4 to 1 07 .1 3 11 m o LMW H 10 .9 50 4. 141 2. 50 6 t o 1 9. 40 0 Ye s −1 6. 53 0 24 .1 00 −6 5. 69 0 to 3 2. 63 0 −1 16 .5 30 to 8 3. 47 6 m o (Co nt in ue s)
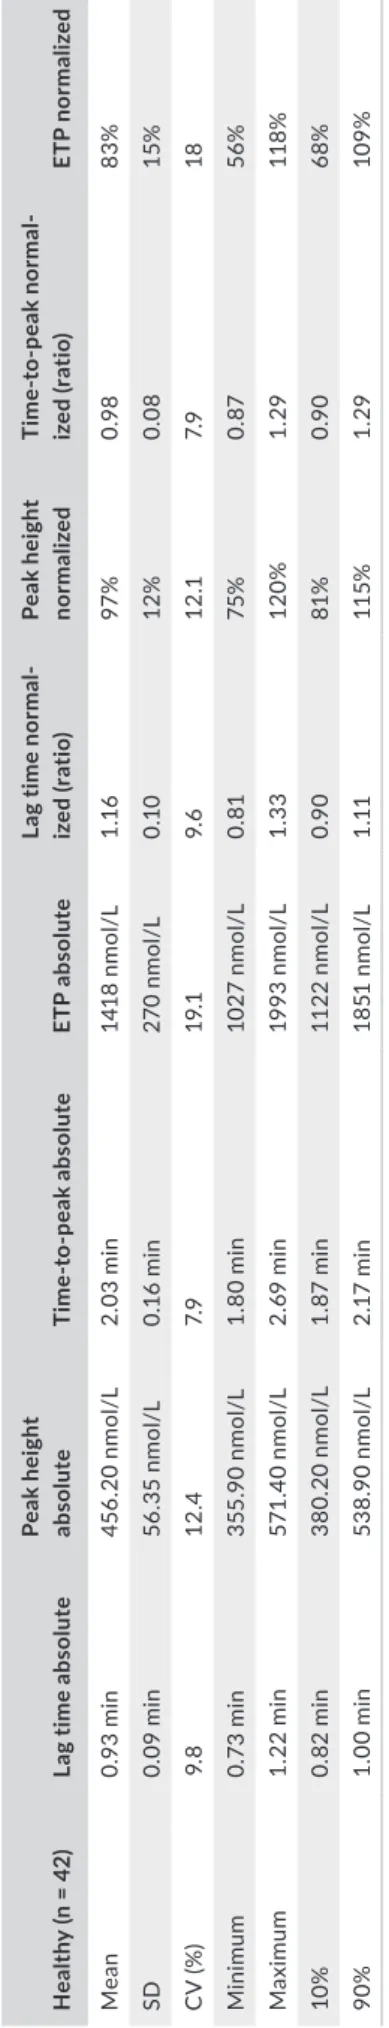
T A B LE 4 N or m al ra ng e de fin iti on o f t he S TG -D ru gS cr ee n ap pl ic at io n on th e ST G en es ia s ys te m u si ng p la sm a sa m pl e fr om 4 2 he al th y in di vi du al s H ea lthy ( n = 42 ) La g t im e a bs ol ut e Pe ak h ei gh t ab solu te Ti m e‐ to ‐p ea k a bs olu te ET P a bs ol ut e La g t ime no rm al ‐ iz ed ( ra tio ) Pe ak h ei gh t nor mal iz ed Ti m e‐ to ‐p ea k n or mal ‐ iz ed ( ra tio ) ET P n or m al iz ed M ea n 0. 93 min 45 6. 20 n m ol /L 2. 03 min 14 18 n m ol /L 1.1 6 97 % 0.9 8 83% SD 0. 09 min 56 .3 5 nm ol /L 0. 16 min 27 0 nm ol /L 0.1 0 12 % 0.0 8 15% C V (% ) 9. 8 12 .4 7. 9 19 .1 9. 6 12 .1 7. 9 18 M ini m um 0. 73 min 35 5. 90 n m ol /L 1. 80 min 10 27 n m ol /L 0. 81 75 % 0. 87 56% Ma xi mum 1. 22 min 57 1. 40 n m ol /L 2. 69 min 19 93 n m ol /L 1. 33 12 0% 1. 29 11 8% 10 % 0. 82 min 38 0. 20 n m ol /L 1. 87 min 11 22 n m ol /L 0. 90 81% 0. 90 68% 90 % 1. 00 min 53 8. 90 n m ol /L 2. 17 min 18 51 n m ol /L 1. 11 11 5% 1. 29 10 9% N ote : A ll sa m pl es w er e te st ed o n th e sa m e da y, e xp la in in g th e fe w d iff er en ce s in te rm o f v ar ia bi lit y be tw ee n ab so lu te a nd n or m al ize d re su lts . A bb re vi at io ns : C V, c oe ff ic ie nt o f v ar ia tio n; E TP , e nd og en ou s th ro m bi n po te nt ia l; SD , s ta nd ar d de vi at io n. Pa ra m et er Lin ea r re gre ss io n Sl op e SE 95 % C I Slop e s ig ni fic an tly no nz er o? In ter cep t SE 95 % C I A dj us te d R L ( % ) Ti m e a t w hi ch R L is re ac he d a Riv ar ox aba n 1. 657 2. 24 5 −2 .9 11 to 6 .2 24 No −2 2. 67 0 11 .9 20 −4 6. 91 0 to 1 .5 73 −1 22 .6 70 to 7 7. 33 10 m o VK A 2.9 04 1. 59 1 −0 .3 34 to 6 .1 41 No −1 0. 46 0 8.9 12 −2 8. 59 0 to 7 .6 73 −1 10 .4 60 to 8 9. 54 10 m o A bb re vi at io ns : E TP , e nd og en ou s th ro m bi n po te nt ia l; LM W H , l ow -m ol ec ul ar -w ei gh t h ep ar in ; V K A , v ita m in K a nt ag on is ts . aW he n th e re gr es si on s lo pe is n ot s ta tis tic al ly s ig ni fic an t ( P > 0. 05 ) f ro m ze ro , t hi s in di ca te s pa ra m et er is n ot c ha ng in g as a fu nc tio n of ti m e an d th e m ax im um s to ra ge ti m e is e qu al to TM A X (l as t p oi nt o f th e lin ea r r eg re ss io n. W he n th e re gr es si on s lo pe is s ta tis tic al ly s ig ni fic an t ( P ≤ 0. 05 ) f ro m ze ro , a nd th e on e-si de d 95 % c on fid en ce li m it of th e re gr es si on li ne in te rs ec ts th e ad ju st ed re je ct io n lim it be fo re re ac hi ng TM A X , t he m ax im um s to ra ge ti m e is d et er m in ed a s th is in te rs ec tio n. T A B LE 3 (Co nti nue s)
T A B LE 5 Th ro m bi n ge ne ra tio n re su lts a t T 0 of a ll pa tie nt s an d he al th y do no rs in cl ud ed in th e st ab ili ty s tu dy Pa tie nt n o. La g t im e ab solu te Pe ak h ei gh t ab solu te Ti m e‐ to ‐p ea k ab solu te ET P a bs ol ut e La g t ime no r‐ m al iz ed ( ra tio ) Pe ak h ei gh t nor mal iz ed Ti me ‐t o‐ pe ak no r‐ m al iz ed ( ra tio ) ET P nor mal iz ed A nti co ag ul an t n g/ m L o r I U /m L o r I N R H ea lth y 1 0. 96 min 56 1. 90 n m ol /L 2. 12 min 19 03 n m ol /L /m in 0.9 8 11 3% 0.9 6 10 5% H ea lth y 2 1. 11 min 38 2. 90 n m ol /L 2. 37 min 12 63 n m ol /L /m in 1.1 2 77% 1. 08 69 % H ea lth y 3 1. 00 min 39 5. 00 n m ol /L 2. 36 min 15 09 n m ol /L /m in 1. 01 80% 1. 07 83% H ea lth y 4 0. 95 min 48 8. 20 n m ol /L 2. 01 min 18 44 n m ol /L /m in 0.9 6 98 % 0.9 1 10 1% H ea lth y 5 1. 14 min 41 0. 00 n m ol /L 2. 64 min 15 89 n m ol /L /m in 1.1 5 83% 1. 20 87 % H ea lth y 6 1. 06 min 42 7. 10 n m ol /L 2. 38 min 17 16 n m ol /L /m in 1. 07 86% 1. 08 94 % A pix aba n 1 2. 48 min 15 3. 90 n m ol /L 4. 69 min 12 95 n m ol /L /m in 2. 62 31% 2. 23 77% 30 7 ng /m L A pix aba n 2 1. 90 min 11 2. 40 n m ol /L 6. 79 min 12 14 n m ol /L /m in 2. 01 23 % 3. 23 72 % 26 9 ng /m L A pix aba n 3 2. 77 min 24 7. 90 n m ol /L 4. 82 min 14 37 n m ol /L /m in 2. 83 46% 2. 19 74 % 15 8 ng /m L A pix aba n 4 2. 14 min 16 9. 20 n m ol /L 4. 29 min 99 5 nm ol /L /m in 2. 27 33% 2.0 8 56% 19 5 ng /m L D ab ig at ra n 1 2. 71 min 32 5. 30 n m ol /L 3. 84 min 11 50 n m ol /L /m in 2.6 4 69 % 1. 74 68% 89 n g/ m L D ab ig at ra n 2 2. 22 min 40 1. 50 n m ol /L 3. 35 min 13 61 n m ol /L /m in 2. 22 87 % 1. 50 83% 51 n g/ m L D ab ig at ra n 3 2. 64 min 31 2. 80 n m ol /L 3. 66 min 10 15 n m ol /L /m in 2. 86 68% 1.7 8 60% 18 7 ng /m L LMW H 1 1. 87 min 43 .8 3 nm ol /L 3. 81 min 26 0 nm ol /L /m in 1.9 3 8% 1. 81 14 % 1. 37 IU /m L LMW H 2 1. 41 min 33 1. 70 n m ol /L 2. 81 min 11 79 n m ol /L /m in 1. 45 64 % 1. 34 65% 0. 35 IU /m L LMW H 3 1. 33 min 33 4. 00 n m ol /L 2. 54 min 10 92 n m ol /L /m in 1. 39 69 % 1. 25 64 % 0. 35 IU /m L LMW H 4 1. 38 min 25 9. 70 n m ol /L 2. 79 min 87 9 nm ol /L /m in 1. 41 57 % 1. 27 49 % 0. 52 IU /m L LMW H 5 1. 35 min 12 2. 70 n m ol /L 3. 49 min 66 1 nm ol /L /m in 1. 51 27 % 1. 64 40% 1. 26 IU /m L Riv ar ox aba n 1 2. 47 min 17 7. 90 n m ol /L 7. 01 min 16 95 n m ol /L /m in 2. 49 37 % 3. 23 10 1% 22 9 ng /m L Riv ar ox aba n 2 3. 33 min 93 .6 7 nm ol /L 9. 67 min 96 5 nm ol /L /m in 3. 65 20 % 4. 61 58% 19 7 ng /m L Riv ar ox aba n 3 2. 88 min 19 1. 30 n m ol /L 6. 29 min 14 54 n m ol /L /m in 3.1 2 38% 3. 01 82 % 21 8 ng /m L Riv ar ox aba n 4 3. 28 min 14 6. 10 n m ol /L 7. 35 min 11 87 n m ol /L /m in 3.4 3 30% 3. 62 70 % 29 6 ng /m L Riv ar ox aba n 5 1. 95 min 10 6. 40 n m ol /L 8. 03 min 10 64 n m ol /L /m in 2.1 2 23 % 3.9 0 63% 30 0 ng /m L V K A 1 2. 06 min 10 4. 80 n m ol /L 3. 43 min 45 1 nm ol /L /m in 2. 01 22% 1. 55 27 % 2. 57 V K A 2 2. 14 min 10 9. 80 n m ol /L 3. 35 min 39 1 nm ol /L /m in 2. 24 23 % 1. 65 23 % 3. 31 V K A 3 2. 87 min 13 7. 90 n m ol /L 4. 56 min 52 5 nm ol /L /m in 3. 01 29 % 2.1 6 29 % 1. 86 V K A 4 2. 39 min 11 8. 70 n m ol /L 3. 74 min 45 1 nm ol /L /m in 2.4 4 26% 1. 71 25% 2.9 1 V K A 5 2. 10 min 91 .1 7 nm ol /L 3. 26 min 26 0 nm ol /L /m in 2. 14 20 % 1. 49 15% 2.6 8 V K A 6 1. 82 min 13 0. 90 n m ol /L 3. 36 min 45 9 nm ol /L /m in 2.0 4 29 % 1. 60 27 % 1.7 9 N ote : R es ul ts o f t he in te ns ity o f a nt ic oa gu la tio n (e xp re ss ed a s ng /m L fo r D O A C s, IU /m L fo r L M W H , a nd IN R fo r V K A ) a re p ro vi de d. A bb re vi at io ns : D O A C s, d ire ct o ra l a nt ic oa gu la nt s (i. e. , a pi xa ba n, d ab ig at ra n, ri va ro xa ba n) ; I N R , i nt er na tio na l n or m al ize d ra tio ; L M W H , l ow -m ol ec ul ar -w ei gh t h ep ar in ; V K A , v ita m in K a nt ag on is t.
the routine practice.2 By providing a complete kit of reagent and
controls, the STG-DrugScreen application of the ST Genesia simpli-fies the evaluation of the thrombin generation in patients treated with anticoagulants in the routine laboratory. This is made possible by the standardized and validated methodology of the ST Genesia. The ST Genesia is derived from the CAT principle, but is not strictly equivalent. Yet, as already shown by others,20 there is a direct corre- lation between the two systems under comparable triggering condi-tions. This study is not intended to provide the clinical performance of the STG-DrugScreen application to predict any clinical events, but to provide the analytical performance of the system in the routine setting and to evaluate the stability of the samples once conserved at −70°C or below. The precision of the ST Genesia has been evaluated using the data from the daily calibration and the value of the two levels of control and reference plasma (i.e., the STG-QualiTest Low DS and STG-QualiTest Norm DS and STG-RefPlasma DS, respectively) over a 15-month period. Two batches of reagents were provided by the manufacturer during the course of this study. Main results revealed that the coefficient of variation of the different param-eters were always <10% and for the majority of these results the
CV was even <5% (Table 1). As previously reported,10 this study
also demonstrates that the use of a reference plasma reduced the interexperiment variability. Regarding the stability of the sam-ples, our results demonstrate that freezing has no impact on most thrombin generation parameters except the time to peak, especially in samples containing apixaban, dabigatran, or rivaroxaban. Our data suggest that the plasma, once frozen, is stable during at least 11 months, except for LMWH samples, for which the maximal dura-tion storage is 6 months.
As mentioned, this study has limitations. First, this is a mono-centric study and, thus, the interlaboratory performance of the ST Genesia has not been assessed. Second, results of external quality assurance program have not been included in this validation because the current thrombin generation EQA program is not designed for thrombin generation assessment of anticoagulant treatment21 and thus the high tissue factor activity of the STG-DrugScreen trigger may not be comparable to that of the other reagents and method-ologies. Finally, the study was not powered to drive any conclusions regarding the effect of anticoagulants on thrombin generation be-cause only peak plasma samples were collected for this part of the study. Only trends can be drawn on the overall effect of the dif-ferent anticoagulant agents; further work is necessary to define the minimal concentration of anticoagulants that would yield results outside the reference range.
4.1 | Reference plasma
Many previous publications recommended the use of a reference
plasma to reduce the interlaboratory variability.6,7,9,10 The choice
of providing a reference plasma within the STG-DrugScreen kit agrees with the literature because it has been reported that the use of local plasma (i.e., a reference plasma performed at the laboratory
facilities) were generally unable to improve the interlaboratory
variability or the CV is even worsen after normalization.6,8,10 The choice of a commercially available and certificated plasma is there-fore more appropriate than using local plasma. On the other hand, it has been reported a certain heterogeneity between the different reference plasma which may impede the benefit of the use of such reference plasma.6 Therefore, the best approach would be to use a reference plasma specifically dedicated for the application. This strategy improves the between-batch variation. In this study, we report relative differences between batches from 0% to 24% when results are not normalized (Table 1; see results of the controls). Once results are normalized most of the parameters show better inter-batch CVs (except for the peak height with the STG-QualiTest Low DS), demonstrating the efficiency of this approach. The choice of a freeze-dried plasma can be challenged because it has been re- ported that these plasmas have higher thrombin generation capac-ity than frozen plasma from multiple preanalytical reasons.6,22 In any case, the conditions in which these reference plasmas are pro-duced are probably far from the best recommendations of blood sample collection for thrombin generation testing because these reference plasmas have to be produced on a large scale. Thus, one solution may be to assess the response of the commercial refer- ence plasma to a smaller pool of plasma from healthy donors col-lected in ideal conditions and then to apply a correction factor to the commercial plasma to compensate for these differences. In the package insert of the STG-DrugScreen kit, an assay value of the reference plasma is provided by the manufacturer to correct the reference plasma activity. The results of this study demonstrate that this approach is efficient since our healthy subjects, collected in ideal conditions for this application, were close to 100% or a ratio of 1 depending on the parameter (Table 5). In addition, the difference between the two batches of the STG-RefPlasma DS was ≤5% for all thrombin generation parameters demonstrating that the use of a correction factor specific to each batch of reagent and reference plasma is useful to reduce the batch-to-batch variation (Table 1).
4.2 | Quality controls
It has been reported that internal quality control is essential to
produce consistent results for thrombin generation23 however,
in the era of thrombin generation, the confusion between internal quality control and a reference is often made. Namely, most stud-ies have proposed to normalize the results according to a reference plasma,6,7,9,10,23 which is not the same as true control plasma. To com-ply with local legislation, regulations, guidelines, or standards issued by relevant bodies, at least two levels of controls are recommended. Thus, this is of upmost importance for thrombin generation to pro-pose such different level of controls to allow the implementation of thrombin generation into routine testing. This will ensure the tech-nique is under control for both normal and abnormal sample analysis. Over our series of 97 measurements of the reference plasma and the quality controls, we demonstrate that the CVs of the normalized
results were always below 10% and for the majority of the param-eters were even below 5%. These interassay precision results are in line with the intra- and interassay reproducibility data provided by the manufacturer in the insert-sheet of the STG-DrugScreen kit (Table S2). All of these data demonstrate that the STG-DrugScreen performed on the ST Genesia is a precise thrombin generation ap-plication, which will allow thrombin generation to be performed routinely to assess patients treated with anticoagulants. All the re-quirements are now met to implement this technique in the routine laboratory.
4.3 | Impact of freezing and stability of the samples
A previous study evaluating the effect of preanalytical parameters on the measurement of circulating microparticles with thrombingeneration revealed that plasmas are stable for 1 year at −80°C.24
Apart from this information, few studies been done to assess the stability of plasma samples for thrombin generation testing. In this previous study of Lacroix et al., the authors assessed the stabil-ity of thrombin generation using the CAT system for the meas-urement of the procoagulant activity of circulating microparticles with the MP-reagent from Thrombinoscope bv, a reagent that does not contain tissue factor to trigger the coagulation. There is a different setting than the one assessed in this study because the STG-DrugScreen reagent contains tissue factor at concentration higher than 5 pM. This higher tissue factor concentration provides robustness to the analytical procedure. Indeed, in another study of Loeffen et al., thrombin generation triggered with tissue factor at a concentration of 5 pM has not demonstrated to be affected by the two centrifugation protocols tested nor by the temperature at which the plasma is stored until analysis (4°C, room temperature or 37°C).8 Freezing has no effect on the majority of the thrombin gener-ation parameters using the STG-DrugScreen application, except for time to peak (Table 2). Once frozen, plasma samples are stable during at least 11 months, except for LMWH samples for which an impact is seen after 6 months (Table 3, Figure 2). A previous re-port also demonstrates that LMWH samples are not stable beyond 6 months.25 This may be explained by the release of PF-4 from resid- ual platelets. Namely, according to the CLSI document H21-A5, hep-arin neutralization may occur in sample not collected on CTAD tubes from the release of PF4 from platelets.26 It is possible that residual platelets released PF4 during storage and thus neutralize heparin. This is consistent with the increase of the peak observed. For the other subgroups, all parameters were stable which is in correlation with the findings of Woodhams et al.,27 who demonstrated that all plasma coagulation proteins were stable for at least 18 months once stored at −74°C. If all the coagulation proteins are stable at −74°C, it can be expected that a global test such as thrombin generation, which relies on these coagulation proteins, can also be stable for a such long period. Our results confirm this assumption for a period of 11 months for healthy subjects and 10 months for anticoagulated patients.
4.4 | Normal range definition
In this study, 42 samples from healthy donors were tested to pro-vide grounds for the definition of a normal for the STG-DrugScreen application on the ST-Genesia. All these samples were normal ac-cording to PT and aPTT screening. The small correction between absolute and normal value is certainly because all 42 samples were tested on the same day with the first batch of reagents (i.e., batch 201797). For all the parameters, the interindividual variation was always below 20% and was below 10% for the lag time and the time-to-peak. When comparing with the results obtained in pa-tients treated with an anticoagulant, the 10th-90th percentile range (Table 4) could serve as a basis for the classification of nor-mal and abnormal plasma. It could be proposed that samples below the 10th percentile (for peak height and ETP) and above the 90th percentile (for lag time and time to peak) may represent samples in which anticoagulant therapy is suspected. However, further stud-ies in larger cohorts of patients taking anticoagulants are needed before adopting this assumption.
4.5 | Usefulness of thrombin generation to assess
anticoagulated patients
Tailoring drug dosages to fit the needs of individual patients could
be helpful to make old and new drugs more effective and safer.2
Preliminary observations showed that thrombin generation testing is affected by all anticoagulant drugs and therefore it could be the
candidate assay.18,19,28‒31
The test has been found to be very sensi-tive to all kind of anticoagulants 13‒16,18,32,33 and may best represent
the interindividual response than just exploring plasma drug concen-trations.28 In addition to considering the interindividual response
to an antithrombotic drug, thrombin generation testing is also able to explore in more detail the effect of anticoagulants on the co-agulation process. Namely, depending the type of drug, our results confirmed that the fingerprint of the thrombin generation differs,
revealing their different pharmacodynamics (Table 5).17,18,32,34 This is of particular importance because bleeding or thrombosis have been reported within the “on-therapy” range, demonstrating that the drug level alone may not be sufficient to identify those who are more at risk.35 However, further investigation on patients who bleed or who have recurrent thrombosis while on a fixed dose of anticoagulants is needed to show the benefit of thrombin generation and provide cutoffs for bleeding and thrombotic complications. Thrombin gen-eration has also been reported as an informative tool to document
on antidote administration in polytrauma models with direct impli-cation for patient care.36 This is particularly important because it
may help in adjusting the dose of prothrombin complex concentrate to administer.37 The ST Genesia will provide a step forward to this aim in allowing thrombin generation to be done routinely with re-duced interexperiments and interlaboratory variations. In this way, it will be easier to recruit patients, design multicenter studies, and provide data for the establishment of reliable and evidence-based thresholds.
5 | CONCLUSIONS
This is the first study presenting performance data of the ST Genesia, a new benchtop analyzer for thrombin generation test-ing. The study aimed at evaluating the performances of the STG-DrugScreen application, a kit of reagents designed for the quantitative determination of thrombin generation in plasma from patients treated with an anticoagulant. Results revealed an excellent interexperiment precision thanks to the standardized methodology, the excellent reproducibility of the analyzer and the use of the reference plasma included in the kit. Stability study re-vealed that plasma samples are stable for at least 11 months after freezing and storage at −70°C or lower, except for those contain-ing LMWH, which have to be tested within 6 months. Freezfreezing and storage at −70°C or lower, except for those contain-ing has no impact of the majority of thrombin generation parameters except on time-to-peak. Thus, our results support the hypothesis that the ST Genesia may facilitate the implementation of thrombin generation in the routine laboratory; this way, it may offer a seri- ous input in the individual screening of patients requiring antico-agulants. However, multicentric studies are required to assess the interlaboratory reproducibility of the ST Genesia and confirm its usefulness for standardizing thrombin generation testing. In addi-tion, the STG-DrugScreen application of the ST Genesia should be part of the propositions of external quality assurance programs. CONFLIC TS OF INTERESTS
The study was financed by Diagnostica Stago group. Among the authors, J. Douxfils is chief executive officer and founder of QUALIblood s.a. and reports personal fees from Diagnostica Stago, Roche, Roche Diagnostics, and Daiichi-Sankyo, outside the sub-mitted work. F. Mullier reports institutional fees from Diagnostica Stago, Werfen, Nodia, Sysmex, and Bayer. He also reports speaker fees from Boehringer Ingelheim, Bayer Healthcare, and Bristol- Myers Squibb-Pfizer, all outside the submitted work. The other au-thors have no conflicts of interest to disclose. AUTHOR CONTRIBUTIONS Among the authors, J. Douxfils and F. Mullier designed the study. C. Devroye, M. Guldenpfennig, and J. Baudar performed the analyses. J-M. Dogné, C. Devroye, M. Guldenpfennig, and J. Baudar collected data. J. Dogné, L. Morimont, and C. Bouvy analyzed and interpreted data. J. Douxfils, L. Morimont, and C. Bouvy performed statisti-cal analysis. J. Dogné, L. Morimont, C. Bouvy, M. de Saint-Hubert, B. Devalet, A-S. Dincq, J-M. Dogné, A-S. Larock, S. Lessire, and F. Mullier wrote the manuscript.
ORCID
Jonathan Douxfils https://orcid.org/0000-0002-7644-5298
Laure Morimont https://orcid.org/0000-0001-9195-304X
REFERENCES 1. Macfarlane RG, Biggs R. A thrombin generation test; the application in haemophilia and thrombocytopenia. J Clin Pathol. 1953;6:3–8. 2. Tripodi A. Thrombin generation assay and its application in the clin-ical laboratory. Clin Chem. 2016;62:699–707. 3. Hemker HC, Willems GM, Beguin S. A computer assisted method to obtain the prothrombin activation velocity in whole plasma independent of thrombin decay processes. Thromb Haemost. 1986;56:9–17.
4. Hemker HC, Giesen P, Al Dieri R, Regnault V, de Smedt E, Wagenvoord R, et al. Calibrated automated thrombin generation measurement in clotting plasma. Pathophysiol Haemost Thromb. 2003;33:4–15.
5. Kintigh J, Monagle P, Ignjatovic V. A review of commercially avail-able thrombin generation assays. Res Pract Thromb Haemost. 2018;2:42–8. 6. Dargaud Y, Luddington R, Gray E, Lecompte T, Siegemund T, Baglin T, et al. Standardisation of thrombin generation test–which refer-ence plasma for TGT? An international multicentre study. Thromb Res. 2010;125:353–6. 7. Dargaud Y, Luddington R, Gray E, Negrier C, Lecompte T, Petros S, et al. Effect of standardization and normalization on imprecision of calibrated automated thrombography: an international multicentre study. Br J Haematol. 2007;139:303–9.
8. Loeffen R, Kleinegris MC, Loubele ST, Pluijmen PH, Fens D, van Oerle R, et al. Preanalytic variables of thrombin generation: to-wards a standard procedure and validation of the method. J Thromb Haemost. 2012;10:2544–54.
9. Dargaud Y, Wolberg AS, Luddington R, Regnault V, Spronk H, Baglin T, et al. Evaluation of a standardized protocol for throm-bin generation measurement using the calibrated automated thrombogram: an international multicentre study. Thromb Res. 2012;130:929–34. 10. Perrin J, Depasse F, Lecompte T; French-speaking CAT group and under the aegis of GEHT; French-speaking CATgroup (all in France unless otherwise stated); French-speaking CAT group all in France unless otherwise stated. Large external quality assessment survey on thrombin generation with CAT: further evidence for the useful-ness of normalisation with an external reference plasma. Thromb Res. 2015;136:125–30.
11. Spronk HM, Dielis AW, De Smedt E, van Oerle R, Fens D, Prins MH, et al. Assessment of thrombin generation II: validation of the Calibrated Automated Thrombogram in platelet-poor plasma in a clinical laboratory. Thromb Haemost. 2008;100:362–4.
12. Gerotziafas GT, Elalamy I, Depasse F, Perzborn E, Samama MM. In vitro inhibition of thrombin generation, after tissue factor path-way activation, by the oral, direct factor Xa inhibitor rivaroxaban. J Thromb Haemost. 2007;5:886–8. 13. Douxfils J, Chatelain B, Chatelain C, Dogne JM, Mullier F. Edoxaban: impact on routine and specific coagulation assays. A practical labo-ratory guide. Thromb Haemost. 2016;115:368–81. 14. Douxfils J, Chatelain C, Chatelain B, Dogne JM, Mullier F. Impact of apixaban on routine and specific coagulation assays: a practical laboratory guide. Thromb Haemost. 2013;110:283–94. 15. Douxfils J, Mullier F, Loosen C, Chatelain C, Chatelain B, Dogne JM. Assessment of the impact of rivaroxaban on coagulation assays: laboratory recommendations for the monitoring of rivaroxaban and review of the literature. Thromb Res. 2012;130:956–66. 16. Douxfils J, Mullier F, Robert S, Chatelain C, Chatelain B, Dogne JM. Impact of dabigatran on a large panel of routine or specific coagula- tion assays. Laboratory recommendations for monitoring of dabig-atran etexilate. Thromb Haemost. 2012;107:985–97. 17. Bloemen S, Zwaveling S, Douxfils J, Roest M, Kremers R, Mullier F. The anticoagulant effect of dabigatran is reflected in the lag time
and time-to-peak, but not in the endogenous thrombin potential or peak, of thrombin generation. Thromb Res. 2018;171:160–6. 18. Dale B, Eikelboom JW, Weitz JI, Young E, Paikin JS, Coppens M,
et al. Dabigatran attenuates thrombin generation to a lesser ex-tent than warfarin: could this explain their differential effects on intracranial hemorrhage and myocardial infarction? J Thromb Thrombolysis. 2013;35:295–301.
19. Hacquard M, Perrin J, Lelievre N, Vigneron C, Lecompte T. Inter-in- dividual variability of effect of 7 low molecular weight antithrom-bin-dependent anticoagulants studied in vitro with calibrated automated thrombography. Thromb Res. 2011;127:29–34. 20. Siguret V, Foulon G, Abdoul J, Carlo A, Lecompte T, Gouin-Thibault
I. PB584/Thrombin generation analysis with a new automated sys-tem (ST-Genesia): inter-series performances during DRIVING study and comparison with CAT system. Res Pract Thromb Haemost. 2018;2:285.
21. Kluft C, Meijer P. External quality assessment for thrombin genera-tion tests: an exploration. Semin Thromb Hemost. 2010;36:791–6. 22. Rodgers SE, Wong A, Gopal RD, Dale BJ, Duncan EM, McRae SJ.
Evaluation of pre-analytical variables in a commercial thrombin generation assay. Thromb Res. 2014;134:160–4. 23. Bagot CN, Leishman E. Establishing a reference range for throm-bin generation using a standard plasma significantly improves assay precision. Thromb Res. 2015;136:139–43. 24. Lacroix R, Judicone C, Poncelet P, Robert S, Arnaud L, Sampol J, et al. Impact of pre-analytical parameters on the measurement of circulating microparticles: towards standardization of protocol. J Thromb Haemost. 2012;10:437–46.
25. Rojnuckarin P, Akkawat B, Juntiang J. Stability of plasma anti-Xa activity in low-molecular-weight heparin monitoring. Clin Appl Thromb Hemost. 2010;16:313–7.
26. Adcock Funk DM, Hoefner D, Kottke-Marchant K, Marlar RA, Szamosi DI, Warunek DJ. H21-A5: Collection, Transport, and Processing of Blood Specimens for Testing Plasma-Based Coagulation Assays and Molecular Hemostasis Assays; Approved Guideline — Fifth Edition. Wayne, PA: Clinical and Laboratory Standards Institute, 2008.
27. Woodhams B, Girardot O, Blanco MJ, Colesse G, Gourmelin Y. Stability of coagulation proteins in frozen plasma. Blood Coagul Fibrinolysis. 2001;12:229–36.
28. Rigano J, Ng C, Nandurkar H, Ho P. Thrombin generation estimates the anticoagulation effect of direct oral anticoagulants with signifi-cant interindividual variability observed. Blood Coagul Fibrinolysis. 2018;29:148–54.
29. Chowdary P, Adamidou D, Riddell A, Aghighi S, Griffioen A, Priest P, et al. Thrombin generation assay identifies individual
variability in responses to low molecular weight heparin in preg-nancy: implications for anticoagulant monitoring. Br J Haematol. 2015;168:719–27. 30. Radulovic V, Hyllner M, Ternstrom L, Karlsson M, Bylock A, Hansson KM, et al. Sustained heparin effect contributes to reduced plasma thrombin generation capacity early after cardiac surgery. Thromb Res. 2012;130:769–74. 31. al Dieri R, Alban S, Beguin S, Hemker HC. Thrombin generation for the control of heparin treatment, comparison with the activated partial thromboplastin time. J Thromb Haemost. 2004;2:1395–401. 32. Robert S, Ghiotto J, Pirotte B, David JL, Masereel B, Pochet L,
et al. Is thrombin generation the new rapid, reliable and relevant pharmacological tool for the development of anticoagulant drugs? Pharmacol Res. 2009;59:160–6.
33. Siriez R, Evrard J, Dogne JM, Pochet L, Gheldof D, Chatelain B, et al. Betrixaban: impact on routine and specific coagulation assays-a practical laboratory guide. Thromb Haemost. 2018;118:1203–14. 34. Bloemen S, Hemker HC, Al Dieri R. Large inter-individual variation of the pharmacodynamic effect of anticoagulant drugs on thrombin generation. Haematologica. 2013;98:549–54. 35. Sennesael AL, Larock AS, Douxfils J, Elens L, Stillemans G, Wiesen M, et al. Rivaroxaban plasma levels in patients admitted for bleeding events: insights from a prospective study. Thromb J. 2018;16:28. 36. Honickel M, Braunschweig T, Rossaint R, Stoppe C, Ten Cate H,
Grottke O. Reversing dabigatran anticoagulation with prothrom-bin complex concentrate versus idarucizumab as part of multi-modal hemostatic intervention in an animal model of polytrauma. Anesthesiology. 2017;127:852–61.
37. Neal MD, Levy JH. Precision correction of coagulopathy or pro-thrombin complex concentrates?: reversal options for dabigatran following trauma. Anesthesiology. 2017;127:744–6.
SUPPORTING INFORMATION
Additional supporting information may be found online in the Supporting Information section at the end of the article.
How to cite this article: Douxfils J, Morimont L, Bouvy C, et al.
Assessment of the analytical performances and sample stability on ST Genesia system using the STG-DrugScreen
application. J Thromb Haemost. 2019;17:1273–1287. https ://