HAL Id: tel-01559651
https://tel.archives-ouvertes.fr/tel-01559651
Submitted on 10 Jul 2017HAL is a multi-disciplinary open access archive for the deposit and dissemination of sci-entific research documents, whether they are pub-lished or not. The documents may come from teaching and research institutions in France or abroad, or from public or private research centers.
L’archive ouverte pluridisciplinaire HAL, est destinée au dépôt et à la diffusion de documents scientifiques de niveau recherche, publiés ou non, émanant des établissements d’enseignement et de recherche français ou étrangers, des laboratoires publics ou privés.
Numerical and experimental optimization of peak power
reduction control strategies
Nikolaos Stathopoulos
To cite this version:
Nikolaos Stathopoulos. Numerical and experimental optimization of peak power reduction control strategies. Thermics [physics.class-ph]. École Nationale des Travaux Publics de l’État [ENTPE], 2015. English. �NNT : 2015ENTP0001�. �tel-01559651�
N° d’ordre 2015-ENTP-0001 Année 2015
T
HÈSE
pour l’obtention du grade de
Docteur de l’Ecole Nationale des Travaux Publics de l’Etat
Université de LyonEcole doctorale : MEGA (Mécanique, Energétique, Génie Civil, Acoustique) Spécialité : Génie Civil
Préparée au Laboratoire Génie Civil et Bâtiment (LTDS/UMR 5513)
Présentée et soutenue publiquement par
Nikolaos STATHOPOULOS
Optimisation numérique et expérimentale
de stratégies d’effacement énergétique
Soutenue le 27/02/2015 devant le jury composé de :
M. EL MANKIBI HDR Directeur de thèse
H. EL QARNIA Professeur Examinateur
G. FRAISSE Professeur Rapporteur
C. GHIAUS Professeur Examinateur
F. HAGHIGHAT Professeur Rapporteur
3
Abstract
Numerical and experimental optimization of peak power reduction control strategies
Nikolaos Stathopoulos, 2015
Keywords:
Building, Energy, Peak power reduction, Control strategies, Phase Change Materials, Thermal Storage, Heat exchanger, Thermal Simulation, Thermal Comfort, Indoor Air Quality
Considering the current French energy context, two major challenges are emerging. In the short term, significant peak power consumption has been observed in the past few years during the winter season. These peaks are strongly linked to electrical space heating and have important economic, environmental and social implications. In the long term, ambitious environmental goals have been set at national and European levels, requiring thermal storage technology and efficient management of the built environment. As part of the solution, Phase Change Materials (PCM) and heat exchanger applications offer promising results through thermal storage and load shifting techniques.
Within this framework, the objective of this thesis is to develop load shifting solutions which also take into account the thermal comfort of the occupants and the indoor air quality. To achieve this, two tools were necessary: an experimental heat exchanger unit (prototype) and a numerical model that accurately simulates its behavior.
The exchanger contains macroencapsumated PCM (paraffin) and is conceived in a way that facilitates its integration in a ventilation system. It is aimed to shift space heating electrical consumption from peak to off-peak period. The unit was experimentally characterized, using an important amount of sensors through full thermal cycles (charging and discharging) and was coupled to an experimental test cell, which led to the testing of preliminary control strategies.
The numerical model is based on the heat balance approach and the apparent heat capacity method, using finite differences for differential equation solution under Matlab/Simulink environment. After validation with experimental data, the model was used to optimize the performance of the exchanger. Several parameters were investigated, including heat exchanger dimensions, PCM quantity and properties, seeking the configuration with the optimal compromise between stored heat and the time needed for the charging / discharging process.
The numerical model was coupled to a building simulation model and an 80m2 dwelling was conceived for control strategies implementation and evaluation, by investigating different scenarios over a one- month winter period. The scenarios vary with increasing complexity, first considering load shifting and thermal comfort, then adding the final price of electricity consumption and finally taking into account the indoor air quality with the presence of a four-person family.
This study has been conducted within the framework of a project funded by the French National Research Agency (Stock-Air: ANR-Stock-E) and was also financially supported by the French Ministry of Sustainable Development.
5
Résumé
Optimisation numérique et expérimentale de stratégies d’effacement énergétique
Nikolaos Stathopoulos, 2015
Mots clés:
Bâtiment, Energie, Effacement énergétique, Stratégies de contrôle, Matériaux à changement de phase, Stockage thermique, Échangeur Thermique, Simulation thermique, Confort thermique, Qualité de l’air intérieur
Dans le contexte énergétique français actuel, deux principaux enjeux émergent. À court terme, des pointes de consommation électrique croissantes sont observées les dernières années pendant la période hivernale. Ces pointes sont fortement liées au chauffage électrique et ont des conséquences économiques, environnementales et sociales importantes. Dans un long terme, des objectifs environnementaux ambitieux ont été fixés au niveau national et européen, nécessitant la technologie de stockage thermique et une gestion efficace de l'environnement bâti. Les Matériaux à Changement de Phase (MCP) ainsi que les dispositifs de type échangeurs thermiques offrent des résultats promettant grâce au stockage thermique et le déplacement des consommations.
Dans ce cadre, l’objectif de cette thèse est de développer des solutions de déplacement des consommations énergétiques qui prennent en compte le confort thermique des occupants et la qualité de l’air intérieur. Pour ce faire, deux outils sont nécessaires: un échangeur thermique expérimental (prototype) et un modèle numérique capable de simuler son comportement.
L'échangeur contient du MCP macroencapsulé (paraffine) et est conçu de manière à faciliter son intégration dans un système de ventilation. Il a comme but de décaler la consommation due au chauffage électrique vers la période hors pointe. Le dispositif a été caractérisé expérimentalement lors des cycles thermiques complets (charge et décharge) en utilisant une quantité importante de capteurs. Il a ensuite été couplé à une cellule expérimentale, afin de tester des stratégies de contrôle préliminaires. Le modèle numérique est basé sur la discrétisation spatiale et l’établissement du bilan de chaleur des couches considérées, la méthode de la capacité thermique apparente, ainsi que l’utilisation des différences finies. Après validation à l’aide des données expérimentales, le modèle a été utilisé pour optimiser la performance de l'échangeur. Plusieurs paramètres ont été étudiés, y compris les dimensions de l'échangeur, la quantité et les propriétés du MCP, en cherchant la configuration avec le compromis optimal entre la chaleur emmagasinée et le temps nécessaire pour la charge et la décharge.
Le modèle numérique a été couplé à un modèle de simulation du bâtiment et un logement de 80m2 a été conçu pour la mise en œuvre et l'évaluation des stratégies de contrôle, en investiguant différents scénarios sur une période hivernal d’un mois. Les scénarios varient avec une complexité croissante, d'abord en considérant l’effacement énergétique et le confort thermique, ensuite en ajoutant le prix final de la consommation électrique et enfin en prenant compte la qualité de l'air intérieur avec la présence d'une famille de quatre personnes.
6 Cette étude a été menée dans le cadre d'un projet financé par l'Agence National de la Recherche (Stock-Air: ANR-Stock-E) et a également été soutenu par le ministère de l'Ecologie, du Développement durable et de l'Energie.
7
Acknowledgments
First, I would like to thank M. El Mankibi for his patient and constant guidance during the last three years and for providing a healthy environment for the accomplishment of this PhD dissertation. I would also like to thank M. Michel for the same reasons. Special thanks to Riccardo Issoglio for his great help and advice on all aspects of the experimental part of the study. I acknowledge the financial support from the French National Research Agency (ANR) and the fruitful collaboration with the members of the research project Stock Air.
I am also grateful to Professors Haghighat and Fraisse for accepting to examine this work and participate in the defense jury. My sincere gratitude also goes to Professors El Qarnia and Ghiaus for their willingness to participate in the jury.
Special credits to Henri Odin for his numerous corrections and advice on the proper English writing of this manuscript.
Thanks are also due to all members of the LGCB laboratory for their support and all the joyous moments I spent around them.
My heartfelt gratitude goes to my father, mother and sister for providing me with excellent education conditions and supporting my choices throughout my life. Without them I would not have come so far. Lastly, I would like to thank my friends in Athens, Lyon and wherever they may now be living for always being there for me, for their constant positive influence and advice and making the world go round.
9
Contents
General introduction ... 24
Context ... 24
Objectives and approach ... 24
Chapter contents ... 25
Chapter 1 : Energy context and built environment ... 28
1.1 Introduction ... 28
1.2 At the international and EU levels ... 28
Built environment: a big energy consumer ... 28
1.3 At the French level ... 29
1.3.1 Energy context and policies ... 29
1.3.2 Built environment and energy consumption ... 29
1.3.3 Electrical heating ... 32
1.3.4 Peak power demand and thermo-sensitivity of French electrical consumption ... 34
1.3.5 Peak power demand implications ... 36
1.3.6 Applied electricity load-shifting methods ... 39
1.4 Conclusion ... 39
Chapter 2 : Energy storage, PCM and HVAC integrated applications ... 41
2.1 Introduction ... 41
2.2 Energy storage: necessity and methods ... 41
2.2.1 Thermal energy storage ... 42
2.2.2 Electrical energy storage ... 47
2.3 Phase Change Materials ... 47
2.3.1 Classification ... 49
2.3.2 Phase change phenomena and properties ... 50
2.3.3 Containment ... 51
2.3.4 PCM application in buildings ... 53
2.3.5 PCM enhancement techniques ... 55
10
2.4 HVAC integrated PCM applications ... 56
2.4.1 Demonstration examples ... 56
2.4.2 Comparative table of existing studies ... 72
2.5 Design and operation of active LHS ventilation systems ... 73
2.5.1 Main elements of an active latent heat storage system ... 73
2.5.2 Operation principles ... 73
2.5.3 Design philosophy of a LHS system ... 74
2.5.4 Design Methods... 75
2.6 Conclusion ... 75
Chapter 3 : Development of an experimental PCM-Air heat exchanger ... 78
3.1 Introduction ... 78
3.2 Experimental set up description ... 78
3.2.1 Thermal energy storage as a solution ... 78
3.2.2 Elaboration of a PCM-Air heat exchanger ... 79
3.2.3 Experimental platform ... 84
3.2.4 Instrumentation, data acquisition and control-command interface ... 85
3.2.5 Operation principle and associated physical phenomena ... 90
3.2.6 Main components of the developed experimental system ... 91
3.2.7 Coupling with an experimental test cell ... 91
3.3 Characterization study ... 92
3.3.1 PCM temperature evolution curves ... 92
3.3.4 Characterization results ... 94
3.3.2 PCM leakage ... 96
3.3.3 Ameliorated plates ... 96
3.3.3 Verification tests... 98
3.3.4 Characterization results ... 100
3.4 Coupling with an experimental room and discussion ... 103
3.5 Conclusion ... 104
Chapter 4 : Numerical model development ... 106
4.1 Introduction ... 106
4.2 State of the art of existing models ... 106
11
4.3.1 Matlab/Simulink and S-function choice ... 107
4.3.2 Heat balance approach... 108
4.3.3 Apparent heat capacity method... 109
4.3.4 Nodal discretization and application of the heat balance approach ... 109
4.3.5 Energy balance equation leading to matrix formulation ... 110
4.3.6 Model assumptions ... 123
4.4 Numerical model calibration, specific heat capacity importance ... 123
4.4.1 DSC Method ... 123
4.4.2 Creation of adequate heat capacity values ... 127
4.4.3 First approach: isosceles triangle ... 127
4.4.4. Second approach: two peaks curve for the discharge phase ... 129
4.4.5. Third approach: 2 separate triangles for the discharge phase ... 131
4.4.6 Final approach: heat capacity values for different positions along the PCM layer... 133
4.5 Numerical model validation ... 134
4.6 Coupling with existing building model ... 138
4.6.1 Building’s model: Hybcell 1.2 ... 138
4.6.2 Definition of the experimental test cell ... 138
4.6.3 Reproduction of an experimentally tested scenario and comparison ... 140
4.7 Conclusion ... 143
Chapter 5 : Heat exchanger optimization and control strategies implementation ... 145
5.1 Introduction ... 145
5.2 Conception of a low energy house ... 145
5.2.1 Materials and properties of the house ... 145
5.2.2 Climate definition ... 146
5.2.3 Heating needs of the house ... 147
5.3 Testing of the initial exchanger ... 149
5.4 Optimization first approach ... 153
5.4.1 Definition of the optimization parameters ... 153
5.4.2 Testing protocol ... 154
5.4.3 Selection of three configurations ... 154
5.4.5 First scenario: simple load shifting ... 156
12
5.4.7 Third scenario: occupancy and indoor air quality ... 163
5.4.8 Conclusions of the first approach ... 169
5.5 Optimization second approach ... 169
5.5.1 Introduction ... 169
5.5.2 Definition of the modified parameters ... 170
5.5.3 Testing of the modified parameters ... 171
5.5.4 Results of the second optimization approach ... 174
5.5.3 Simple scenario, second approach ... 175
5.5.4 Night charging scenario ... 180
5.5.5 Occupancy scenario ... 184
5.6 Conclusions of the second approach... 189
Conclusive summary and future work ... 191
Synopsis ... 191
Perspectives ... 192
Texte de synthèse (français) ... 195
References ... 220
13
List of figures
Figure A.1: The methodology followed along this thesis ... 26
Figure 1.1: Evolution of energy consumption per sector ... 30
Figure 1.2: Evolution of CO2 emission per sector ... 30
Figure 1.3: Final consumption of the residential/tertiary sector ... 31
Figure 1.4: Evolution of final electricity consumption per sector ... 31
Figure 1.5: Energy distribution within the residential sector ... 32
Figure 1.6: Percentage of electrical heating in newly built housing ... 33
Figure 1.7: Peak power demand around 19:00, before and during the cold wave of February 2012 ... 35
Figure 1.8: Electrical consumption and equivalent thermo-sensitivity part, first half of February 2012 ... 36
Figure 1.9: Demand coverage during the cold wave of February 8th 2012 ... 37
Figure 1.10: Implications of peak power demand ... 38
Figure 2.1: Internal and external solicitations in a building, possible heat sources ... 42
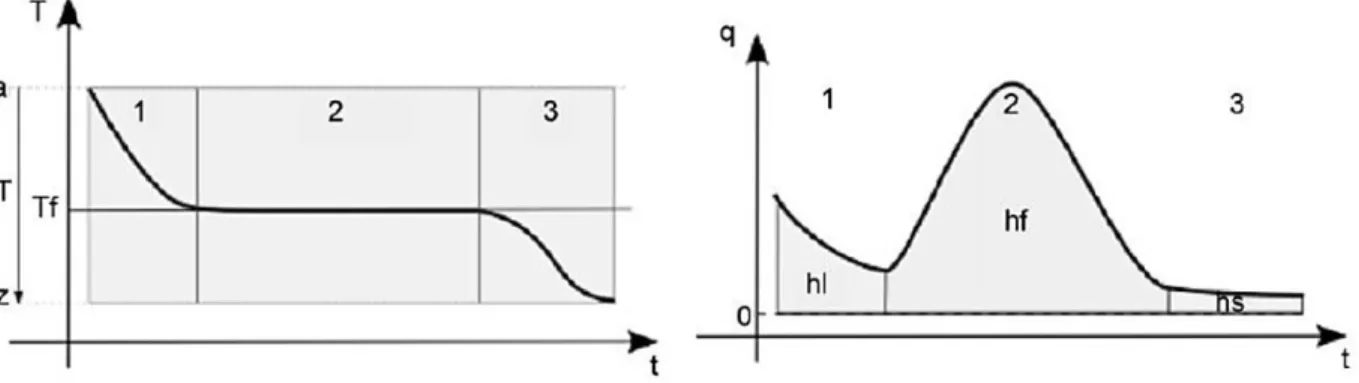
Figure 2.2: Temperature profile variation with stored heat evolution ... 45
Figure 2.3: Classification and applications of EES (Fernandes et al. 2012) ... 47
Figure 2.4: PCM temperature and heat flux evolution during solidification, 1: liquid phase 2: melting phase 3: solid phase (Baetens et al., 2010) ... 48
Figure 2.5: Classification of PCMs (IEA, Annex 23, 2013) ... 49
Figure 2.6: Classification of PCMs according to their meting temperature range and enthalpy (IEA, Annex 17, 2005) ... 49
Figure 2.7: Subcooling effect during solidification (Cabeza et al. 2008) ... 50
Figure 2.8: Macroencapsulation solutions, from left to right: aluminum profiles with fins, coated aluminum plate, capsule stripes (Cabeza et al., 2008)) ... 52
Figure 2.9: PCM construction panels: microencapsulated PCM (left), shape stabilized plate (right) (IEA. Annex 23) ... 53
Figure 2.10: Borderon et al. heat exchanger unit ... 57
Figure 2.11: Outlet air temperature experimental and simulation results (Borderon et al.) ... 58
Figure 2.12: Zalba’s et al. experimental set up (left) and heat exchanger unit (right) ... 59
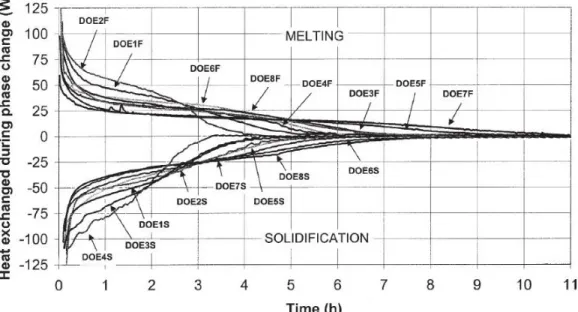
Figure 2.13: Zalba’s et al. unit’s heat transfer during phase change for different configurations ... 59
Figure 2.14: Zalba’s et al. unit’s heat exchange during phase change for different configurations ... 60
Figure 2.15: Heat exchanger developed by Arkar et al. ... 61
Figure 2.16: Experimental and simulation confrontation for the outlet air temperature of Arkar’s et al. unit during the melting stage (left) and the solidification stage (right) ... 61
Figure 2.17: Nagano et al. experimental unit ... 62
Figure 2.18: Temperature variation for different experimental configurations, Nagano’s et al. unit ... 63
Figure 2.19: Lazaro et. al LHS system and first encapsulation method: aluminum pouches ... 64
Figure 2.20: Lazaro et. al LHS second encapsulation method (aluminum panels)... 65
Figure 2.21: Cooling rate evolution with constant rise of inlet air temperature (left) and constant heating power for Lazato’s et al. prototype 2 ... 65
14
Figure 2.22: Dolado et al. modifications in Lazaro et al. system ... 66
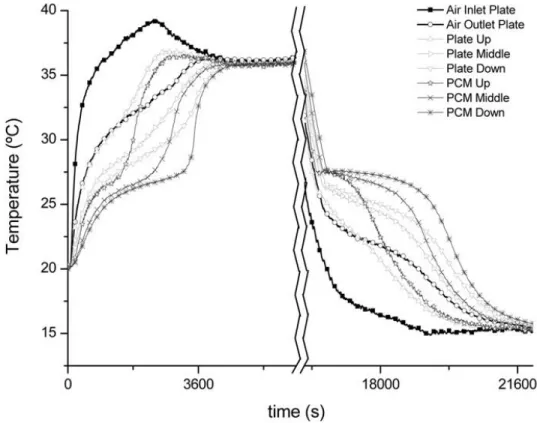
Figure 2.23: Inlet and outlet air temperature, ambient air, and surface temperature distribution for a full cycle of Dolado et al. proposed unit ... 66
Figure 2.24: Air, plate and PCM temperatures of a single plate for a full cycle, Dolado et al. proposed unit ... 67
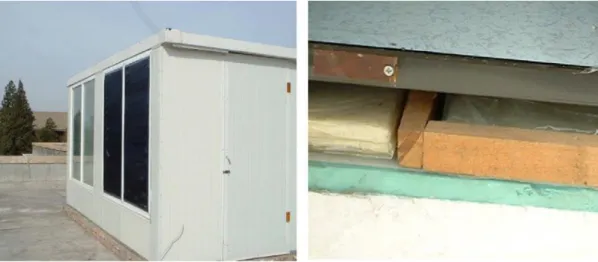
Figure 2.25: Lin et al. experimental house and enhanced floor heating system. ... 68
Figure 2.26: Lin et al. experimental vs simulation results for different configurations (a) indoor temperature without air supply, (b) indoor temperature with air supply, (c) PCM surface temperature without air supply and (d) PCM surface temperature with air supply ... 69
Figure 2.27: Turnpenny et al. LHS unit, overall view (left) and heat exchange pipes (right) ... 70
Figure 2.28: Air, PCM and external temperature for 1 and 2 kW heat input, Turnpenny et al. LHS unit ... 71
Figure 2.29: Upstream-downstream and upstream-PCM temperature difference for 1 and 2 kW heat input, Turnpenny et al. LHS unit ... 71
Figure 3.1: Microtek 37D in solid form ... 79
Figure 3.2: Aluminum plates used for PCM containment ... 80
Figure 3.3: Aluminum fin ... 81
Figure 3.4: Fins between the PCM plates ... 82
Figure 3.5: The heat exchanger during construction phase ... 82
Figure 3.6: The heat exchanger through the assembly process... 83
Figure 3.7: Electrical duct heater (left) and air diffuser (right) ... 84
Figure 3.8: Experimental platform ... 85
Figure 3.9: PT100 temperature sensor ... 85
Figure 3.10: Nozzle Pitot Flow Sensor ... 86
Figure 3.11: Insertion of temperature sensors inside the PCM ... 87
Figure 3.12: Air and PCM properties monitoring interface ... 88
Figure 3.13: PCM and surface temperature monitoring interface ... 89
Figure 3.14: Data acquisition and command implementation interface ... 89
Figure 3.15: PCM during liquefaction ... 90
Figure 3.16: The experimental test cell Hybcell ... 92
Figure 3.17: Downstream PCM temperature evolution ... 93
Figure 3.18: Downstream surface temperature evolution ... 93
Figure 3.19: Inlet and outlet air temperature evolution ... 94
Figure 3.20: Characterization results: outlet air temperature for varying airflow rates, charging phase .. 95
Figure 3.21: Characterization results: outlet air temperature for varying airflow rates, discharging phase ... 95
Figure 3.22: PCM leakage ... 96
Figure 3.23: The improved aluminum plates used as PCM containers ... 97
Figure 3.24: The improved aluminum plates used as PCM containers, sketch... 97
Figure 3.25: Deformation on containers linked to the extrusion process ... 99
Figure 3.26: Average, maximum and minimum outlet surface temperatures for 14 plates (airflow rate of 300 m3/h) ... 99
15 Figure 3.27: Characterization results without fins: outlet air temperature for varying airflow rates,
charging phase ... 100 Figure 3.28: Characterization results without fins: outlet air temperature for varying airflow, discharging phase ... 101 Figure 3.29: Characterization results with fins: outlet air temperature for varying airflow, charging phase ... 101 Figure 3.30: Characterization results with fins: outlet air temperature for varying airflow, discharging phase ... 102 Figure 3.31: Integration of AIR-PCM exchanger and HVAC system of Hybcell ... 103 Figure 4.1: S-function block under Simulink environment (left) and parameters definition block (right) 108 Figure 4.2: Schematic representation of the considered layers for temperature evolution calculation . 109 Figure 4.3: Upper view of the nodal representation of the layers: air (a), aluminum (p) and PCM (m)... 111 Figure 4.4 Centralized matrix equation ... 122 Figure 4.5: Representation of the DSC method (Borderon, 2012) ... 124 Figure 4.6: DSC obtained heat capacity curves for three different heating/cooling rates ... 124 Figure 4.7: Simulation results for inlet and outlet air temperature using DSC obtained heat capacity curves and comparison with experimental data ... 126 Figure 4.8:Simulation results for PCM temperature at node 5 using DSC obtained heat capacity curves and comparison with experimental data ... 126 Figure 4.9: Fictive Heat capacity values, first approach ... 127 Figure 4.10: Simulation results for inlet and outlet air temperature using first approach’s heat capacity curves and comparison with experimental data ... 128 Figure 4.11: Simulation results for PCM temperature at node 5 using first approach’s heat capacity curves and comparison with experimental data ... 128 Figure 4.12: Fictive Heat capacity values, second approach ... 129 Figure 4.13: Simulation results for inlet and outlet air temperature using second approach’s heat capacity curves and comparison with experimental data ... 130 Figure 4.14: Simulation results for PCM temperature at node 5 using second approach’s heat capacity curves and comparison with experimental data ... 130 Figure 4.15: Fictive Heat capacity values, third approach ... 131 Figure 4.16: Simulation results for inlet and outlet air temperature using third approach’s heat capacity curves and comparison with experimental data ... 132 Figure 4.17: Simulation results for PCM temperature at node 5 using third approach’s heat capacity curves and comparison with experimental data ... 132 Figure 4.18: Surface temperature difference per minute at different parts of the plate ... 133 Figure 4.19: Calibrated cp values created for the numerical model ... 134 Figure 4.20: Numerical and experimental results for inlet air temperature, for 100, 300 and 500 m3/h 135 Figure 4.21: Numerical and experimental results for outlet air temperature, for 100, 300 and 500 m3/h ... 135 Figure 4.22: Numerical and experimental results for surface temperature at node 1, for 100, 300 and 500 m3/h ... 136
16 Figure 4.23: Numerical and experimental results for surface temperature at node 5, for 100, 300 and 500
m3/h ... 136
Figure 4.24: Numerical and experimental results for surface temperature at node 10, for 100, 300 and 500 m3/h ... 136
Figure 4.25: Numerical and experimental results for PCM temperature at node 1, for 100, 300 and 500 m3/h ... 137
Figure 4.26: Numerical and experimental results for PCM temperature at node 5, for 100, 300 and 500 m3/h ... 137
Figure 4.27: Numerical and experimental results for PCM temperature at node 10, for 100, 300 and 500 m3/h ... 137
Figure 4.28: Hybcell 1.2 model for building simulation ... 138
Figure 4.29: Visual representation of the modeled experimental cell... 139
Figure 4.30: Composition and properties of Hybcell’s north-east wall ... 139
Figure 4.31: North-east wall definition, including openings ... 140
Figure 4.32: Coupling of the heat exchanger’s model with the building’s model Hybcell 1.2 under Simulink environment ... 141
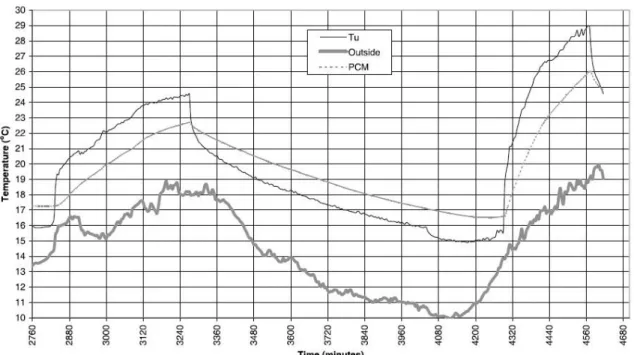
Figure 4.33: Numerical and experimental results for the heat exchanger unit and the Hybcell room coupling during a 4 days test ... 142
Figure 4.34: Numerical and experimental results for the heat exchanger unit and the Hybcell room coupling during a 4 days test ... 142
Figure 5.1: The conceived mono zone house, as presented in Hybcell 1.2 model ... 146
Figure 5.2: Outdoor temperature for the tested month (January 2013) ... 147
Figure 5.3: Indoor air temperature using conventional heating, setpoint of 20°C ... 148
Figure 5.4: Heating needs during 18:00-20:00 for the conceived house ... 148
Figure 5.5: Performance of the initial exchanger, destocking 18:00-20:00, inlet exchanger temperature 38°C ... 150
Figure 5.6: Indoor temperature for different inlet exchanger air temperatures ... 151
Figure 5.7: Indoor temperature for different load shifting periods, initial exchanger ... 151
Figure 5.8: Representation of the modified parameters (PCM and air layers, height of the unit) ... 153
Figure 5.9: Indoor air temperature, 3,5 days testing, optimized exchanger 1... 155
Figure 5.10: Indoor air temperature, 3,5 days testing, optimized exchanger 2 ... 155
Figure 5.11: Indoor air temperature, 3,5 days testing, optimized exchanger 3 ... 156
Figure 5.12: Performance of the heat exchanger, days 3-8, configuration 1, simple load shifting scenario, first optimization approach ... 157
Figure 5.13 Performance of the heat exchanger, days 3-8, configuration 2, simple load shifting scenario, first optimization approach ... 158
Figure 5.14: Performance of the heat exchanger, days 3-8, configuration3, simple load shifting scenario, first optimization approach ... 158
Figure 5.15: Heating needs from 11 to 13 January ... 159
Figure 5.16: Performance of the heat exchanger, days 3-8, configuration 1, inlet exchanger air temperature=38°C, night charging scenario, first optimization approach ... 161
17 Figure 5.17: Performance of the heat exchanger, days 3-8, configuration 1, inlet exchanger air
temperature=44°C, night charging scenario, first optimization approach ... 161 Figure 5.18: Performance of the heat exchanger, days 3-8, configuration 2, inlet exchanger air
temperature=44°C, night charging scenario, first optimization approach ... 162 Figure 5.19: Performance of the heat exchanger, days 3-8, configuration 1, inlet exchanger air
temperature=38°C, night charging scenario, first optimization approach ... 162 Figure 5.20: Weakly occupancy program ... 164 Figure 5.21: Incoming air temperature for an indoor temperature of 18 and 20 °C ... 165 Figure 5.22: Performance of the heat exchanger, days 3-8, configuration 3, inlet exchanger air
temperature=38°C, occupancy scenario, first optimization approach ... 166 Figure 5.23: Performance of the heat exchanger, days 3-8, configuration3, inlet exchanger air
temperature=44°C, occupancy scenario, first optimization approach ... 167 Figure 5.24: Performance of the heat exchanger, days 3-8, configuration 1, inlet exchanger air
temperature=44°C, occupancy scenario, first optimization approach ... 167 Figure 5.25: Performance of the heat exchanger, days 3-8, configuration 2, inlet exchanger air
temperature=44°C, occupancy scenario, first optimization approach ... 168 Figure 5.26: Performance of the heat exchanger, days 3-8, case 1, inlet exchanger air temperature=44°C, simple load shifting scenario, second optimization approach ... 177 Figure 5.27: Performance of the heat exchanger, days 3-8, case 28, inlet exchanger air
temperature=44°C, simple load shifting scenario, second optimization approach ... 177 Figure 5.28: Performance of the heat exchanger, days 3-8, case 38, inlet exchanger air
temperature=38°C, simple load shifting scenario, second optimization approach ... 178 Figure 5.29: Performance of the heat exchanger, days 3-8, case 38, inlet exchanger air
temperature=44°C, inlet house air temperature= outlet exchanger –4°C, simple load shifting scenario, second optimization approach ... 179 Figure 5.30: Performance of the heat exchanger, days 3-8, case 64, inlet exchanger air
temperature=38°C, inlet house air temperature= outlet exchanger –4°C, simple load shifting scenario, second optimization approach ... 179 Figure 5.31: Performance of the heat exchanger, days 3-8, case 64, inlet exchanger air
temperature=38°C, inlet house air temperature= outlet exchanger –4°C, simple load shifting scenario, second optimization approach ... 182 Figure 5.32: Performance of the heat exchanger, days 3-8, case 38, inlet exchanger air
temperature=44°C, ameliorated insulation, night charging scenario, second optimization approach .... 182 Figure 5.33: Performance of the heat exchanger, days 3-8, case 64, inlet exchanger air
temperature=38°C, initial insulation, night charging scenario, second optimization approach ... 183 Figure 5.34: Performance of the heat exchanger, days 3-8, case 64, inlet exchanger air
temperature=38°C, ameliorated insulation, night charging scenario, second optimization approach .... 183 Figure 5.35: Performance of the heat exchanger, days 3-8, case 38, inlet exchanger air
temperature=44°C, initial insulation, occupancy scenario, second optimization approach ... 185 Figure 5.36:Performance of the heat exchanger, days 3-8, case 38, inlet exchanger air temperature=44°C, ameliorated insulation, occupancy scenario, second optimization approach ... 186
18 Figure 5.37: Performance of the heat exchanger, days 3-8, case 64, inlet exchanger air
temperature=38°C, initial insulation, occupancy scenario, second optimization approach ... 187 Figure 5.38: Performance of the heat exchanger, days 3-8, case 64, inlet exchanger air
temperature=38°C, ameliorated insulation, occupancy scenario, second optimization approach ... 187 Figure 5.39: Performance of the heat exchanger, days 3-8, case 64, inlet exchanger air
temperature=40°C, initial insulation, occupancy scenario, second optimization approach ... 188 Figure 5.40: Performance of the heat exchanger, days 3-8, case 64, inlet exchanger air
19
List of tables
Table 1.1: List of annual electrical consumption peaks (RTE, 2012, a) ... 35
Table 2.1: Comparison between sensible and latent heat storage (Farid et al., 2004) ... 44
Table 2.2: Comparison of different types of TES based on various performance parameters, (Abedin et al., 2011) ... 46
Table 2.3: Main desirable characteristics of PCMs (Hale et al., 1971) ... 48
Table 2.4: Comparative table of the different LHS units ... 72
Table 3.1: Properties of the Microtek 37D paraffin ... 79
Table 3.2: PCM mass calculation ... 81
Table 3.3: Description of the instrumentation ... 87
Table 3.4: PCM mass calculation for the new heat exchanger ... 98
Table 4.1: Enthalpy change during heating/cooling of the PCM based on DSC results ... 125
Table 4.2: Enthalpy change for the three part discretization heat capacity curves (heating and cooling) ... 134
Table 5.1: Properties of the materials used for the definition of the building ... 145
Table 5.2: Composition of the building's surfaces ... 146
Table 5.3: French electricity price rates during the day and during the night ... 152
Table 5.4: Monthly energy consumption and cost for different inlet air temperature values and load shifting periods for the initial exchanger ... 152
Table 5.5: Characteristics of the three selected configurations ... 154
Table 5.6: Simple load shifting operation description, first optimization approach ... 157
Table 5.7: Monthly performance of the three tested configurations, simple load shifting scenario, first optimization approach ... 159
Table 5.8: Night charging scenario operation description, first optimization approach ... 160
Table 5.9: Monthly performance of the three tested configurations, night charging scenario, first optimization approach ... 163
Table 5.10: Occupancy scenario operation description, first optimization approach ... 166
Table 5.11: Monthly performance of the three tested configurations, occupancy scenario, first optimization approach ... 169
Table 5.12: Modified parameters for the second optimization approach ... 171
Table 5.13: Classification of the obtained results for the charging of the unit according to faster charging time, airflow rate of 300m3/h ... 174
Table 5.14: Comparison between initial and optimized version of the heat exchanger ... 175
Table 5.15: Simple load shifting operation description, second optimization approach ... 176
Table 5.16: Monthly performance of the tested configurations, simple load shifting scenario, second optimization approach ... 180
Table 5.17: Night charging operation description, second optimization approach ... 181
Table 5.18: Monthly performance of the tested configurations, night charging scenario, second optimization approach ... 184
20 Table 5.20: Monthly performance of the tested configurations, occupancy scenario, second optimization approach ... 189
21
List of symbols
Upper case
Cp Specific heat capacity [J/(kg·K)]
E Energy [J]
H Enthalpy [J/kg]
R Thermal resistance [(m2K)/W] L Latent heat of fusion (J/kg)
P Power [W]
Patm Standard atmospheric pressure [Pa] Psat Saturation pressure [Pa]
Q Heat [J] S Surface [m2] T Temperature [°C, K] T̅ Average temperature [°C, K] V Volume [m3] Lower case dx Length of node [m] dy Thickness of node [m] dz Height of node [m] h Convection coefficient [W/m2·K] m Mass [kg] ṁ Airflow rate [kg/s, m3.h-1] ps Static pressure pt Stagnation pressure t Time [s]
w Mixture ratio of water vapor mass and dry air mass
Greek symbols ε Efficiency [%] λ Thermal conductivity [W/(m·K)] ρ Density [kg/m3] φ Relative humidity [%] Subscripts
Air, a Related to air / position in the air stream Inlet/in Heat exchanger inlet point
22 Outlet/out Heat exchanger outlet point
app Refers to apparent exp Refers to experimental i Node position lengthwise j Node position crosswise l Referring to liquid PCM m Referring to PCM layer
n Total number of nodes lengthwise p Referring to aluminum layer
q Total number of PCM nodes crosswise s Referring to solid PCM
sim Refers to simulation
Acronyms
ADEME French Environment and Energy Management Agency ANR French National Research Agency
CHS Chemical heat storage COP Coefficient of performance DSC Differential Scanning Calorimetry EDF Electricity of France
EES Electrical energy storage
ES Energy storage
EU European Union
GHG Greenhouse gas
HVAC Heating, ventilation and air conditioning IEA International Energy Agency
INSEE French National Institute of Statistics and Economic Studies LHS Latent heat storage
MEDDE French Ministry of Sustainable Development PCM Phase change material
PEB Positive energy building RT Thermal regulation Act
RTE French Electricity Transport Network SHS Sensible heat storage
TES Thermal energy storage
23
General introduction
24
General introduction
Context
Human-induced global warming, fossil resources rarefaction, oil price shocks, increase in world and urban population constitute an alarming list of issues which require serious debates, rigorous decision making and innovative solutions. Several agreements and policies have already been put into practice at the international and national levels and further initiatives are being prepared for the future, reflecting the rising world concern and the need for action.
Regarding these considerations, the building sector plays a key role, as it is one of the major contributors worldwide concerning energy consumption and greenhouse gas emissions. In view of these facts, European and French policies are considering imposing zero or even positive energy buildings regulations in the near future. Two main problems have to be dealt with regarding those goals: renewable energy intermittence and daily or seasonal variations of energy consumption. A significant amount of research has been performed concerning Energy Storage, proving that this field can provide pertinent applications as an answer to these drawbacks.
In general, France faces the above stated challenges but it also presents a specific particularity: high peak power demands. These peaks are mostly encountered during the late afternoon winter period and are closely related to electrical heating. A project was formulated under the aegis and founding of the French National Research Agency aiming at developing and controlling an active PCM-Air heat exchanger coupled to a heat pump, as a technical solution to the augmented electricity demand during the 18:00-20:00 time slot. The project partners include four research units (LGCB, CETHIL, ARMINES – CEP and EDF R&D) and an industrial one (RIBO).
Objectives and approach
It is within this context that the here presented PhD thesis seeks to investigate the potential of a PCM-Air heat exchanger and proposes control strategies that will perform the needed shift in electrical consumption without degrading thermal comfort and indoor air quality.
The general idea is to develop a heat exchanger unit integrated in a ventilation system, in which a sufficient amount of heat will be stored in order to substitute the use of electrical heating during the peak power demand period. Three major objectives were identified:
The development of experimental and numerical tools that will enable the elaboration, testing and evaluation of the control strategies;
The optimization of the heat exchanger’s performance;
The elaboration of load shifting control strategies for different scenarios.
The approach that was followed in order to achieve these goals is a retroactive process based on two tools: an experimental and a numerical one (figure A.1). A PCM-Air heat exchanger was designed, constructed, instrumented, characterized and coupled to an experimental test cell. In parallel, a numerical model was developed using the apparent heat capacity approach and the finite difference method. After calibration and validation with the use of experimental data were conducted, the model
25 was coupled to a building model. An optimization study was performed focusing on the geometry of the exchanger and the PCM properties in order to obtain faster charging/discharging periods with minimum effect on the stored energy. Finally, the optimized version of the exchanger was used for the elaboration of control strategies.
Chapter contents
The thesis is divided into 5 chapters, presenting the various elements that had to be linked together in order to achieve the established goals.
The first chapter briefly presents the energy and built environment context in an International, European Union and French level. Special focus is given on the French peak power demand issue and its strong association with electrical heating. The implications of the peak power demand are discussed, along with existing load shifting management methods and technologies.
The first part of the second chapter deals with energy storage, presenting different methods through which it can be achieved. It focuses on thermal energy storage processes and targets phase change materials by demonstrating existing applications in buildings, enhancement techniques as well as limitations and barriers to their use. The second part of the chapter describes the main elements, operation principles and design philosophy and methods of active latent heat storage units. Finally, existing applications and studies are discussed.
The third chapter presents the experimental part of the study. The assembly procedure of the experimental platform is demonstrated and all the important choices concerning design are explained including PCM, geometry, instrumentation and data acquisition. In a second phase, characterization results are presented, as well as the coupling with an officelike experimental cell and a preliminary control strategy.
The fourth chapter presents the elaborated numerical model that is used to simulate the heat exchanger’s behavior. Experimental results are used for the model’s calibration and validation; following that, the model is coupled to an existing building simulation model.
Chapter five presents the optimization study of the heat exchanger, performed through the numerical model. Several parameters are investigated (geometry, PCM properties) in order to obtain an ameliorated performance of the heat exchanger in terms of minimum charging time and augmented power. The optimized versions of the exchanger are then used in realistic scenarios in order to achieve load shifting while maintaining acceptable indoor thermal comfort and air quality conditions.
Finally, the last section of this thesis presents the conclusions of the study and discusses the perspectives that can be tackled in the future.
26 Figure1: The folowed methodology for the development of load shifting control strategies
Methodology
Validation
Experimental
Heat exchanger elaboration
Characterization
Coupling with Hybcell
Numerical
Apparent heat capacity approach
Finite difference method
Coupling with building model
Tools
Heat exchanger optimization
Geometry, PCM parameters
Charging/discharging time
Load shifting
Augmented energy storage
Load shifting strategies
Substitute electrical heating
Thermal comfort
Indoor air quality
Peak power demand
(linked to electrical heating)
Thermal storage
Load shifting strategies
27
Chapter 1
28
Chapter 1 : Energy context and built environment
1.1 Introduction
For almost half a century energy-related issues have gained increasing concern within societies all over the world due to their significant economic and environmental importance. Starting from the oil price shocks in the 70s and until the current awareness about global warming, energy production and management is now a prominent subject in international, national and local debates and policies. This chapter starts by presenting important international, EU and French policies that reflect the global climate change awareness and sets a significant number of goals for the near and far future. Special focus is then given to the French context and more specifically to the influence of the built environment in energy consumption and greenhouse gas emissions. The considerable share of electrical heating in augmented peak power demand is demonstrated using statistics and figures. Finally, the implications of elevated electricity demand are debated and existing load shifting methods are mentioned as an introduction to energy storage.
Overall, this chapter aims to pass from global energy concerns to the French energy context and the electrical heating-related peak power demand in order to clearly state the problem in question and underline the necessity for efficient solutions.
1.2 At the international and EU levels
Several agreements have been signed between countries worldwide, aiming to reduce energy consumption and greenhouse gases (GHG) emissions. The cornerstone of these efforts was the Kyoto Protocol (United Nations, 1998), an international agreement under the United Nations Framework Convention on Climate Change which sets emissions reduction targets to its participating parties.
Concerning the European Union, the ‘Climate and Energy Package’ (European Commission, 2008) was adopted in December 2008, focusing on emissions cuts, renewable energy production increase and energy efficiency. The Package sets three key objectives (known as the ‘20-20-20’ targets) for 2020: 20% reductions of GHG emissions comparing to 1990 levels, 20% energy consumption from renewable resources and a 20% improvement in energy efficiency. Before that, the Energy Performance of Buildings Directive (European Commission, 2002) implemented enhanced building regulations and introduced energy certification schemes for buildings in all EU countries. Furthermore, the Communication ‘Energy Roadmap 2050’ (European Commission, 2011) was adopted in 2011, showing the EU’s commitment to reducing GHG emissions to 80-95% below 1990 levels by 2050.
The above agreements and legislations demonstrate the increasing concern for environment friendly policies as well as the demand for more efficient ways of energy utilization.
Built environment: a big energy consumer
One of the most influencing factors when it comes to the energy domain is the built environment: according to the International Energy Agency buildings represent about 40% of primary energy consumption among its 29 member countries. Furthermore, it is estimated (UNEP SBCI, 2009) that
29 buildings contribute up to 33% of the global GHG emissions, mostly due to fossil fuels utilization during the operational phase. These numbers clearly demonstrate the significant environmental impact of buildings and the key role they can play in reducing energy consumption and GHG emissions.
1.3 At the French level
1.3.1 Energy context and policies
Until 1973, oil constituted the main means of energy production in France, in order to support the industrial development and the declining use of coal. Between that year and the late ‘80s, the oil price chocks led to a better control of energy consumption and oriented its production to other sources. First the nuclear sector became the dominant producer –it is still so nowadays. An increase of renewable sources production could be observed after the ‘90s, mostly from hydraulic energy but also from photovoltaic and wind energy (INSEE, 2012). The annual global electricity consumption has tended to stabilize since the ‘00s, presenting, however, increasing peak power demands, mainly during the winter period. A significant dependence on temperature variation is also observed during winter, mainly due to electrical heating (RTE, 2012a, 2013).
The Kyoto Protocol was implemented through the ‘Climate Plan 2004-2012’ (MEDDE, 2006) aiming at a 10% reduction of CO2 emission as well as aiming to raise awareness within society and among public and private actors etc. It was reinforced by the commitments established by the First and Second Grenelle Acts (MEDDE, 2009, 2012) following the ‘Grenelle de l'environnement’ debate, a multi-party debate launched in 2007. The main commitments include the generalization of standards of low consumption in new housing and public buildings, the renovation of housing and building heating, transportation measures favoring low polluting means, the development of renewable energy, as well as other actions in the health, agricultural and biodiversity domains.
As far as the building sector is concerned, several Thermal Regulations acts have been voted (1974, 1988, 2000, 2005, and 2012), with an increasing interest observed in the last 15 years. They aim to set upper limits on the energy consumption of new buildings for heating, ventilation and air conditioning (HVAC), lighting and hot water consumption and to promulgate the renovation of existing residential and tertiary buildings, with a 38% reduction goal in the consumption of the existing park.
It is worth noting that the new Thermal Regulation Act (RT 2020, currently under discussion) will introduce the concept of positive energy buildings (PEB). It will aim to divide energy consumptions by four and oblige all new buildings to achieve PEB standards.
1.3.2 Built environment and energy consumption
The built environment and energy consumption in France is not an exception compared to the European and international situation, as this sector represents a significant part of energy utilization and GHG emissions (ADEME, 2013, a, b). More specifically, the housing and tertiary sector is to account for 44% of the final energy consumption (figure 1.1), 20% of GHG and 22% of CO2 emissions (figure 1.2).
30 Figure 1.1: Evolution of energy consumption per sector
Figure 1.2: Evolution of CO2 emission per sector
Energ y co n su m p tio n Year Agriculture / forestry Industry Energy transformation Transport Residential – tertiary Net absorption of biomass
CO2
em
is
sio
31 Electricity is the main energy source of French buildings representing 37% of final consumption, followed by gas (32%), oil (16%), renewable/waste (15%) and coal (0,4%) (figure 1.3). It presents a 15% increase since 1973 and along with renewable sources and gas it has contributed to the decrease of coal and oil consumption.
Figure 1.3: Final consumption of the residential/tertiary sector
Furthermore, final electricity consumption in buildings has been increasing with an annual rate of 8% over the past 30 years (figure 1.4, MEDDTL, 2010). This can be explained by the population growth and the subsequent increase of the building stock (+41% of houses in 30 years), the increase of the mean housing surface, the augmented comfort expectations and the apparition of new needs linked to technology advancements. These factors have contributed to a significant increase of electricity consumption for HVAC, household/office appliances, lighting, etc.
Figure 1.4: Evolution of final electricity consumption per sector In 2012 :
In 1973 :
Electricity Renewable and waste Gas Oil Coal Year Residential – tertiary Industry
Steel and iron
Transport Agriculture Ele ctricity co n su m p tio n Source SOeS TWh
32 Apart from the performance of the building itself, one also has to consider the related energy and environmental impact on the construction sector (concrete, wood, steel and other components) and on management policies (access to energy sources and networks, transport connection, etc).
1.3.3 Electrical heating
1.3.3.1 Residential sector
In 2012, the residential sector has risen to 33,4 million houses, out of which 27,8 million are main residences. Since 1973, the average unitary consumption (including wood) has shown a significant reduction of 58%, which can be attributed to renovation, new thermal policies and a more energy efficient behavior among occupants (ADEME, 2013, a). Electricity and gas are the two main energy sources of the residential sector. Figure 1.5 illustrates the energy distribution in this sector: almost 2/3 of energy consumption is employed for heating needs, followed by specific usage (PC, drying, TV and other appliances) (19,5%), hot water (12,1%) and cooking (7%).
Figure 1.5: Energy distribution within the residential sector
Ye
ar
Heating Hot water Cooking Specific usage Unitary consumption KWh / housing Apartment buildings Individual housing33 Electrical heating is used in 9,5 million households nationwide, a number that represents 35% of main residences; 44% use gas and 14% fuel (RTE, 2012, b).
Even though the mean unitary housing heating needs have decreased by 44% since 1973, the overall electricity consumption in main residences has increased by 130% in the same period. This can be explained by the strong penetration of specific usage and by the augmenting usage of electrical heating. During the 00’s electrical heating was largely preferred in the newly built buildings, mostly because of its advantageous installation and maintenance cost and its moderate price evolution, when compared to other heating means. The percentage of electrical heating use in newly built housing reaches almost 75% of cases in 2008 (figure 1.6). The last Thermal Regulation (RT 2012) resulted in an important decrease of this percentage, as it focuses on primary energy consumption and not on the final one (as was the case with the former regulation RT 2005).
Nevertheless, according to some estimations (NégaWatt 2009), electrical heating reaches an annual consumption of 60 TWh, a number that represents 27% of total electricity consumption of the residential sector and 12,3% of the total annual electricity consumption in France.
Figure 1.6: Percentage of electrical heating in newly built housing Year P erc entag e o f elec trical h eatin g ( n ew ly bu ilt)
%
34 These figures depend on various factors, one of the most important ones being the weather conditions and the rigorousness of the winter period. For example, throughout the particularly cold winter of 2008/2009 the electrical heating consumption rose to 70 TWh, which corresponds to the total energy consumption of a country like Switzerland. Furthermore, the French electrical Distribution Network (RTE) estimated that during the cold wave of January 7th 2009 electrical heating represented 53% of total residential consumption.
1.3.3.2 Tertiary sector
In 2011, the heating area of the tertiary sector accounts for 931 149 000 m2 (ADEME, 2013, a). As for the residential sector, gas is the main energy heating source (46%), electricity coming second (25,9%) and fuel last (18,1%). Although the tertiary sector ranks low in the French energy balance, it appears as the most dynamic in terms of energy consumption increase, with an annual growth of 2% for electricity and 0,7% for all energies combined. This fact shows that it can have an increasing impact in the future hence constituting a considerable aspect of energy management policies.
1.3.4 Peak power demand and thermo-sensitivity of French electrical consumption
For the past 15 years electrical consumption in France has shown increasing peaks in electrical consumption (table 1). For the first time, the symbolic threshold of 100.000 MW was surpassed during the cold wave of February 2012. Furthermore, according to RTE (RTE, 2012, a), the increase of these peaks is faster and more dynamic than the increase of the annual electrical consumption. The maximal values are mostly observed during the late afternoon hours of the winter period (19:00) (figure 1.7). They are the result of a decreasing level of tertiary activities, increased public transportation needs and the starting of evening household activities.
Annual electrical consumption peaks Thursday 17/01/2013 92 600 MW Wednesday 08/02/2012 102 100 MW Tuesday 04/01/2011 91 820 MW Wednesday 15/12/2010 96 710 MW Wednesday 07/01/2009 92 400 MW Monday 15/12/2008 84 420 MW Monday 17/12/2007 88 960 MW Friday 27/01/2006 86 280 MW Monday 28/02/2005 86 020 MW Wednesday 22/12/2004 81 400 MW
35 Thursday 09/01/2003 83 540 MW
Tuesday 10/12/2002 79 730 MW Monday 17/12/2001 79590 MW
Table 1.1: List of annual electrical consumption peaks (RTE, 2012, a)
One of the most influential factors of this phenomenon is electrical heating, as justified by the figures presented in the previous sections. RTE underlines the strong dependence of electrical consumption on outdoor temperature values, particularly during winter. Figure 1.7 also illustrates the increase in power consumption during the cold wave of February 2012.
Figure 1.7: Peak power demand around 19:00, before and during the cold wave of February 2012 The term thermo-sensitivity is applied to describe this phenomenon, with a calculated 2300 MW increase in consumption per Celsius degree temperature increase during the 2012 winter. This value presents a growth of 35% when compared to the 2001/2002 one. This phenomenon is much more visible in France than in other European countries as it represents almost half of the total thermo-sensitivity observed in Europe. During periods of great cold, thermo-sensitivity is the predominant factor in electrical consumption. For instance, if we consider the cold wave observed in February 2012, the
Time MW P o we r co n su m p ti o n
36 thermo-sensitivity part represented on average 40% of the consumption. Figure 1.8 illustrates the electrical consumption and the equivalent thermo-sensitivity part for the first half of February 2012.
Figure 1.8: Electrical consumption and equivalent thermo-sensitivity part, first half of February 2012 Contrary to the increase in peak power demand over the last 15 year, the annual minimum consumption observed in the summer remains stable during the same period. This results in increasing differences between winter peak demands and summer minimal levels of consumption.
1.3.5 Peak power demand implications
The magnitude of the peak power demand has important economic, environmental and social consequences.
The French energy management system faces increasing difficulties in responding to such events, as it relies in great part on nuclear power plants, presenting mostly constant production rates of 63.130 MW, that cover 77% of total energy consumption (RTE, 2014). As a result, France has to call upon other means of energy production and/or address neighboring countries for importations (figure 1.9). In both cases fossil fuel utilization is usually involved, leading to an increase of CO2 emission.
Date Consumption Thermo-sensitivity part MW Elect rical c o n sumpti o n
37 Figure 1.9: Demand coverage during the cold wave of February 8th 2012
According to RTE, CO2 emissions have been three times higher in winter than in summer over the past six years. Estimations report that a change of electrical heating consumption would result in a change of CO2 emission by 500-600 g CO2/kWh (ADEME & RTE, 2007). Furthermore, RTE notes that France has been importing electricity from Germany over the past few years, even though Germany has announced its exit from the nuclear power and closed down seven nuclear sites in 2011.
At the same time, peak power demands lead to the starting of thermal power plants, the reduction of energy exports and the increase of energy importations. In all cases, the energy provider is forced to pay the KWh obtained at price market values, for example two or three times more than the equivalent gas produced energy. The augmented price range is bound to be transferred to the consumer’s electrical bill. In addition, the peak power consumption period represents a relatively small percentage of the total annual consumption. Nevertheless, significant oversizing investments have to be made that are practically not used for the greater part of the year. These costs are also likely to be passed on to the consumers and more specifically to the fixed part of their bill that corresponds to infrastructure development. This outcome penalizes above all small individual consumers, that is to say precarious or energy efficient households.
Increasing bills can contribute to energy precariousness of low income households that cannot afford a well-insulated dwelling or a higher energy budget. Energy precariousness is defined as the difficulty in obtaining the necessary energy supply for the satisfaction of basic needs. This difficulty may occur in conditions of the occupants’ insufficient resources or inadequate habitat conditions. According to the French National Institute of Statistics and Economic Studies (INSEE, 2011), 3.8 million households spend more than 10% of their income on energy supply, whereas 3.5 million declare that they suffer from cold in their homes. 621.000 households suffer from both forms of precariousness.
Imports Hydraulic
Thermal (fossil fuel) Other renewable Wind
Nuclear Demand coverage (08/02/2012)
38 Moreover, according to some assumptions (NégaWatt, 2009), the augmented seasonal demand leads to an increasing concentration of the nuclear units stop in summer in order to obtain maximum power plants operation during the mid-season and winter. Additionally, the French Electricity Company (EDF) performs load-following strategies in some of these plants, resulting in lower production factors. These two management choices differentiate from the original designed operation of the nuclear power plants and may result in a more complicated exploitation, additional costs and degradation of the parc.
Finally, in extreme cases peak electricity demand can lead to partial or total failure in the distribution system (blackout), with severe economic (production deficiency, material damage, etc) and social consequences (transports, discontent among the electricity-depending population, etc).
Figure 1.10: Implications of peak power demand
Resort to other means of energy
production (non-nuclear)
Import energy from neighboring
countries
Oversizing investments of
energy production sites
Differentiation from original
operation of nuclear energy
production sites
Eventual partial or total failure in
the energy distribution system
Environnemental
implications
Economic
implications
Social
implications
39 1.3.6 Applied electricity load-shifting methods
Load-shifting management methods and technologies constitute efficient solutions to the increasing electricity peak demands, by storing energy and moving power loads to off-peak times in order to maintain the supply-demand balance and ensure a good operation of the network. Energy storage can be achieved through various processes: electrochemical (batteries, fuel cell), electrical (capacitor, superconducting magnetic field), thermal (sensible, latent, chemical form) and mechanical (hydraulic, flywheel) ones. Some of them provide only short term energy storage and others can achieve very long term storage.
Concerning France, two main peak load shifting categories can be noted:
- The industrial one, that consists in reducing or even stopping the consumption of one or more industrial sites.
- The scattered one that includes the sum of several load shifting application among individuals or professionals.
In both cases, RTE signs contracts with the consumers in question and solicits them in case of important electrical demand, providing advantageous measures in exchange of lower consumption. According to RTE (RTE, 2013), the total load shifting capacity (all features combined) was nearly 900Mw during some days of November 2013. Globally, for the year 2013, the annual activated load shifting volume rose to 20 GWh.
1.4 Conclusion
Throughout this chapter we discussed the increasing concern for energy related subjects, focusing on the French context and the increasing peak power demands. We explained the influence of electrical heating on higher energy needs along with the serious economic, environmental and social problems that may be provoked by this issue. We briefly discussed existing solutions as a transition to the second chapter where energy storage and latent heat storage systems are presented as efficient ways to deal with peak electricity demand.
40
Chapter 2
41
Chapter 2 : Energy storage, PCM and HVAC integrated applications
2.1 Introduction
In the previous chapter the international and French energy context was presented, emphasizing on the peak power problem linked to electrical heating. This chapter discusses the benefits of energy storage technology in terms of consumption shifting and more efficient management of the built environment. At first, the field of application of such technology is presented, along with its different forms, focusing on thermal energy storage. Furthermore, phase change materials are discussed as one of the most frequent ways to achieve thermal storage (classification, properties, containment, applications, enhancement techniques and limitations).
Then several existing studies using PCM integrated in HVAC systems are compared, in order to acquire useful information regarding their development and utilization in the building. Finally, an attempt to summarize the operation principles and design methods is performed, as a guide for the fabrication of a PCM-Air heat exchanger.
2.2 Energy storage: necessity and methods
As discussed earlier, the built environment is one of the major contributors in what concerns energy consumption and GHG emissions. Furthermore, scientific communities have been alerting regarding human-induced climate change and its impact on average earth temperature elevation. At the same time, the world population is increasing and is expected to rise up to 9.6 billion by 2050 (UN, 2013). A growing percentage of the population will be living in cities, indicating that high density urban landscapes will also increase in the future. One of the consequences of this fact will be the intensification of the Urban Heat and Pollution Island effect that can negatively influence mortality rates and heat-related diseases (Haja et al., 2002). Indeed, the 2003 summer heat wave was directly linked to 70.000 deaths in European countries (15.000 deaths in France only) (Robine et al., 2008).
In view of these facts, the need for more efficient energy buildings seems essential, the replacement of conventional energy sources with renewable and waste ones being a highly promising perspective. Nevertheless, implementing renewable sources in the building presents some drawbacks, the main difficulty being the variability and intermittence of their availability (especially concerning wind and solar energy).
In addition, as presented in the previous chapter, daily and seasonal variations in energy consumption lead to peak power usage and tend to become an important issue for energy companies, France being one of the most affected countries in Europe.
42 In light of these elements, Energy Storage (ES) can play a key role in energy efficient buildings by providing a number of solutions for intermittent resources and mismatching demand, while maintaining comfortable indoor environment. Furthermore, it can contribute to energy supply security, advanced control strategies elaboration (associated with smart grids) and thermal inertia increase.
ES can be performed through various processes, including mechanical, electromagnetic, chemical, biological and thermal ones. Some of them provide only short term energy storage and others can provide very long term storage. This chapter will mainly deal with thermal energy storage, presenting the main methods through which it can be achieved and focusing on phase change materials technology. 2.2.1 Thermal energy storage
Thermal energy storage (TES) allows the stocking of thermal energy in order to reduce indoor air temperature fluctuation or to reinstitute it to the system (building, district, and town) at a later period with an hourly, daily or even seasonal time lag. Excess storable energy can be the result of intermittent power sources (mostly renewable ones) or waste heat from domestic appliances (cooking, ventilation, etc.) (figure 2.1).
Figure 2.1: Internal and external solicitations in a building, possible heat sources Depending on the application, the following elements are usually used in TES systems:
A storage medium where heat or cold is stored.
A containment component that is used as a reservoir for the storage medium. A circuit that allows the flow of the heat/cold transferring fluid (air or water). A heat/cold source that is used to heat/cool the circulating fluid.