HAL Id: halshs-00118973
https://halshs.archives-ouvertes.fr/halshs-00118973
Submitted on 7 Dec 2006HAL is a multi-disciplinary open access archive for the deposit and dissemination of sci-entific research documents, whether they are pub-lished or not. The documents may come from teaching and research institutions in France or abroad, or from public or private research centers.
L’archive ouverte pluridisciplinaire HAL, est destinée au dépôt et à la diffusion de documents scientifiques de niveau recherche, publiés ou non, émanant des établissements d’enseignement et de recherche français ou étrangers, des laboratoires publics ou privés.
Group and individual risk preferences: a lottery-choice
experiment
David Masclet, Youenn Loheac, Laurent Denant-Boèmont, Nathalie Colombier
To cite this version:
David Masclet, Youenn Loheac, Laurent Denant-Boèmont, Nathalie Colombier. Group and individual risk preferences: a lottery-choice experiment. 2006. �halshs-00118973�
Centre d’Economie de la Sorbonne
UMR 8174
Group and Individual Risk Preferences : A Lottery-Choice Experiment
David MASCLET
Youenn LOHEAC
Laurent DENANT-BOEMONT
Nathalie COLOMBIER
Group and Individual Risk Preferences:
A Lottery-Choice Experiment
David Masclet
a, Youenn Loheac
bLaurent Denant-Boemont
cand Nathalie Colombier
d,
First version : October 2004 This version : September 2006
aD. Masclet: corresponding author CNRS/CREM, Department of Economics, University of Rennes 1 (France) and CIRANO, Montréal (Canada). Tel : +33 (0)2.23.23.33.18. Fax : +33 (0)2.23.23.35.09. E-mail: David.Masclet@univ-rennes1.fr
b Y. Loheac: Graduate School of Management of Brittany and CES-TEAM, University of Paris1 (France). Email:
youenn.loheac@esc-bretagne-brest.com
c L. Denant-Boemont: CREM, Department of Economics, University of Rennes 1 (France). Email:
Laurent.Denant-Boemont@univ-rennes1.fr
Abstract
This paper focuses on decision making under risk, comparing group and individual risk preferences in a lottery-choice experiment inspired by Holt and Laury (2002). The experiment presents subjects with a menu of unordered lottery choices which allows us to measure risk aversion. In the individual treatment, subjects make lottery choices individually; in the group treatment, each subject was placed in an anonymous group of three, where unanimous lottery choice decisions were made via voting. Finally, in a third treatment, called the choice treatment, subjects could choose whether to be on their own or in a group. Our main findings are that groups are more likely than individuals to choose safe lotteries for decisions with low winning percentages. Moreover, groups converge toward less risky decisions because subjects who were relatively less risk averse were more likely to change their vote in order to conform to the group average decision; more risk-averse individuals were less likely to change their preferences. Finally our results reveal a positive relationship between preference for risk and willingness to decide alone.
JEL Codes : C91, C92, D81, D70, M10
Keywords : Experiment, Decision rule, Individual Decision, Group Decision Résumé
Ce papier s’intéresse à la prise de décision dans le risque, en comparant les préférences vis-à-vis du risque de groupes et d’individus à travers une expérience de choix de loteries inspirée de Holt et Laury (2002). L’expérience met les sujets face une série de choix non-ordonnés entre loteries permettant de mesurer leur aversion au risque. Dans le traitement individu, les sujets font leurs choix de loterie seuls ; dans le traitement groupe, chaque sujet est intégré dans un groupe de trois personnes anonymes, où les choix de loterie sont pris à l’unanimité à travers un processus de vote. Enfin, dans un troisième traitement, appelé traitement choix, les sujets peuvent choisir entre prendre leur décision seul ou en groupe. Nous principales observations sont que les groupes sont plus prompts que les individus à choisir des loteries sûres lorsque les décisions portent sur de faibles pourcentages de gain. De plus, les groupes convergent vers des décisions peu risquées car les individus que sont relativement peu averses au risque modifient plus probablement leur vote en faveur de la décision moyenne du groupe ; les individus plus averses au risque changent moins probablement leurs préférences. Enfin, nos résultats soulignent une relation positive entre le goût du risque et la disposition à décider seul.
1. Introduction
In many real life situations, important decisions are made by (small) groups rather than by a single individual (such as production units, boards of directors, committees). This then raises the question of how the preferences of different group members are combined to produce the group decision. In spite of the fact that many important decisions are made collectively, economics has devoted little empirical attention to group decision-making. In this paper, we contribute to this literature by comparing group and individual decision-making. More precisely, we focus on decision-making under risk and compare group and individual risk preferences in a lottery-choice experiment inspired by Holt and Laury (2002). In this seminal paper, Holt and Laury used the results of a simple lottery choice experiment to determine the degree of risk aversion. Subjects were successively confronted with the following treatments: a real lottery with low payments (less than four Euros in both outcomes), a hypothetical lottery with high payments (the low payment outcomes multiplied by 20, 50 or 90), a real lottery with the same high payments, followed by the same real lottery with low payments as at the start of the sequence. Holt and Laury’s most important results are that subjects exhibit risk aversion even for low payments and that risk aversion increases sharply as the scale of payoff increases (for real payoffs only).
In our experiment, the risk preferences of groups and individuals are compared by implementing three treatments over six independent sessions. In the individual treatment (IND), subjects were asked to choose between playing two lotteries, one “safe” and one “risky”, with varying probabilities of obtaining the higher monetary payoff. In the group treatment (GP), each individual was placed in an anonymous group of three and voted over which lottery was chosen. If no unanimous decision was reached in the vote, players were informed of other group members’ choices in the current vote, and then voted again. The voting rounds continued until
agreement was reached or until five rounds were completed. If five rounds were completed without agreement, then the lottery option was randomly chosen by the computer. Finally, in a third treatment, called the choice treatment (CHOICE), subjects were asked to state a maximum willingness to pay for making their decisions alone instead of choosing in the group of three people (and thus express their preference over the first two treatments).
The main findings of our study are, consistent with previous work, that groups exhibit more risk aversion than individuals for high-risk lotteries. In addition, our results indicate a further explanation for group decision-making, by showing that relative risk-loving subjects (those who are less risk-averse than the other two group members) are more willing to change their vote to conform to the group average risk decision than were relatively risk-averse players.
The remainder of this paper is organized as follows. Section 2 summarizes the relevant previous research comparing groups and individuals. Our experimental design is presented in more detail in section 3, and Section 4 presents and interprets the results of the experiment. Finally section 5 summarizes and concludes.
2. Previous literature
A number of empirical results based on natural data concerning team versus individual decisions can be found in the existing literature (financial decisions in Prather and Middleton, 2002; productivity in Hamilton et al., 2003; and betting in Adams and Ferreira, 2005), but the majority of results have come from experimental economics. A recent growing experimental literature has explored differences between individuals and teams (or between teams of different size) with respect to many different kinds of decisions: beauty-contest games (Kocher and Sutter, 2005; Kocher et al., 2006; Sutter, 2005); centipede games (Bornstein et al., 2004); ultimatum games
(Bornstein and Yaniv, 1998); dictator games (Cason and Mui, 1997); signaling games (Cooper and Kagel, 2005); policy decisions (Blinder and Morgan, 2005); location and pricing (Barreda et al., 2002); and auctions (Cox and Hayne, 2006; Sutter et al., 2005). Experimental results on the type of choice which interests us here, risky decisions, can be found in Bone (1998), Bone et al. (1999), Shupp and Williams (2003), Bone et al. (2004), Baker et al. (2004), Bateman and Munro (2005), Rockenbach et al. (forthcoming), and Harrison et al. (2005). The main issues considered in this literature are whether teams make better decisions, and whether they are more rational than individuals. No consensus has been reached regarding either question, with results depending on the kind of game under consideration. This conclusion is similar to that reached in social psychology regarding differences in group and individual decisions. In their meta-analysis of replies to Choice Dilemma Questionnaires, Kerr et al. (1996) underline that group discussion can “attenuate, amplify, or reproduce the judgments biases of individuals depending on the group decision making process”.
With respect to the results, Bornstein and Yaniv (1998) find no significant differences between individual and group rejection rates as responders in an Ultimatum Bargaining game, but do show that groups offer lower amounts when they are proposers. In the Dictator game, Cason and Mui (1997) find that teams demonstrate a greater degree of altruism than do the individuals who make up the group, i.e. team choices are dominated by the preferences of the members who are more other-regarding. In Bornstein et al. (2004), groups terminate the Centipede Game at an earlier stage than do individuals, and group behavior is more rational than individual behavior. Using the Beauty Context experiment, teams outperform individuals in both Kocher and Sutter (2005) and Kocher et al. (2006). Sutter (2005) finds that four-member teams outperform two-member teams and single individuals, although there is no difference between the latter two. The results in Cox and Hayne (2006) are not clear-cut between teams and individuals, but in Sutter et al. (2005)
teams stayed on average longer in an auction than individuals and paid significantly higher prices. Blinder and Morgan (2005) find that groups are no slower than individuals in reaching decisions, but that the decisions are better. In Cooper and Kagel (2005), teams consistently played more strategically than individuals, and their superiority increased with the difficulty of the games. Last, Barreda et al. (2002) find that teams exhibited behaviors predicted from an assumption of strong risk-aversion, in experiments on individual versus group decisions over risk preferences. Rockenbach et al. (forthcoming) carried out an experiment where individuals and groups (not consisting of the same subjects) make lottery choices and evaluations. The common effects observed in the literature regarding expected utility theory (the common ratio and preference reversal effects) are found for both individuals and groups (as in Bone et al., 1999). However, teams accumulated significantly more expected value than did individuals, and at significantly lower total risk. In an experiment comparing the risk preferences of two real spouses, both separately and together, Bateman and Munro (2005) replicated the result of equal rationality in group and individual decisions mentioned above, but found that joint choices are more risk averse than those made by individuals. Shupp and Williams (2003) evaluate risk aversion via certainty equivalent ratios (certainty equivalent/expected value) elicited using a maximum willingness to pay mechanism for lotteries. They find that groups exhibit lower risk aversion than individuals for lotteries with high winning probabilities, but are increasingly risk-averse as winning probabilities fall. Comparing the decisions of the same subjects both alone and in groups, Shupp and Williams (2003) underline that group discussion led to greater risk-aversion for lotteries with low winning probabilities. Using Holt and Laury’s (2002) method (with payoffs raised by a factor of 10), Baker et al. (2004) observe the same phenomena as Shupp and Williams (2003). Last, in a paper on preferences over social risk, Harrison et al. (2005) also appeal to the same method (with payoffs raised by a factor of 25) and conclude that there are no differences in risk aversion
between individuals and groups (consisting of the same subjects). The general conclusion of this literature on risky decisions is that groups tend to be more cautious than individuals.
Many of the above experiments consider the individual and group treatments independently, i.e. the same individual participates in only one of the two treatments. As such, we cannot examine the behavior of the same individual in two different decision environments. However, if the same subject participates in both treatments, a new problem arises: the order of the treatments. Both Shupp and Williams (2003) and Harrison et al. (2005) include the same subjects in two treatments but do not control for order effects. Baker et al. (2004) use an individual-group-individual sequence of decisions, and find that subjects were more risk-averse (for high-risk lotteries) in groups than in the first individual treatment, and that the group treatment significantly affected the decision in the second individual treatment: individuals exhibited greater risk-aversion than in first individual treatment. Cason and Mui (1997) introduce two orders in a dictator game: individual-team and team-individual. Subjects were more other-regarding in the individual treatment when it followed the team treatment. Last, their results were more consistent with social comparison theory than with persuasive argument theory (the latter induces discussion between members rather than social influence).
A second point is that the great majority of group decisions in this experimental literature are based on informal discussion (cheap talk), and so that the decision-making process within the group cannot be analyzed. It would be very interesting to open the “black-box” to discriminate between the many hypotheses regarding how groups make decisions. The data in Rockenbach et al. (forthcoming) are consistent with an excess-risk vetoing rule. In a signaling game experiment, Cooper and Kagel (2005) introduced discussion between the two (anonymous) team members via an instant messaging system which recorded discussions. Their analysis of the dialogue between team members leads them to conclude that teams exhibit strong positive cross-game learning,
whereas individuals show negative cross-game learning, which is consistent with adaptive learning models with a growing number of sophisticated learners.
Last, before individual or group decisions, Kocher et al. (2006) asked individuals to choose between the two decision procedures and to explain their choice. In their experimental beauty-contest game, about 60% of subjects preferred to act in teams (and teams won significantly more often than did individuals). Their analysis of the causes and consequences of self-selection showed that both individuals and team members were satisfied with their chosen role, but for different reasons. Kocher et al. (2006) appears to be the first contribution considering the taste for autonomy in decision-making.
Compared to the existing literature, we analyze differences in risk aversion between individual and group (three-member) treatments, composed of the same subjects. We take the order effect between these two treatments into account, and look into the “black-box” of the group to analyze the decision process leading to unanimous choices. Last, we propose a new approach to the analysis of the taste for autonomy.
3. The experimental design
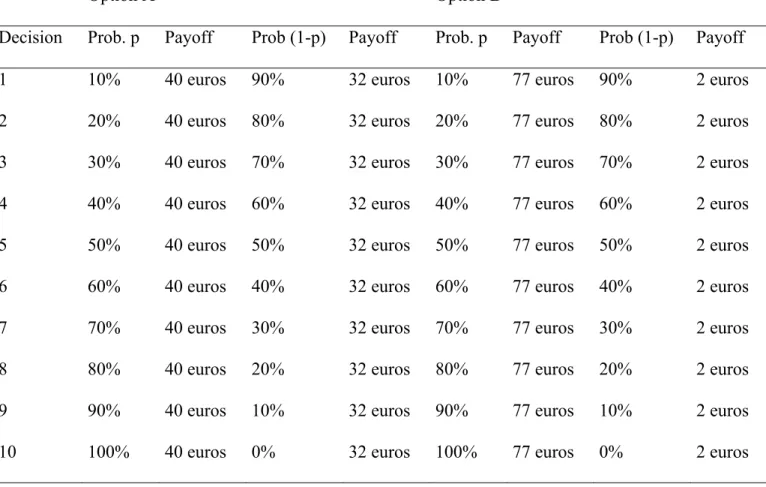
The experimental procedure is based on that of Holt and Laury (2002). The experiment was computerized and the scripts were programmed using the z-tree platform (Fischbacher, 1999). We recruited 108 subjects from September 2004 to May 2006. Our overall design consists of 6 sessions (with 18 subjects each) of a lottery choice experiment with three treatments. Our first treatment, called the “individual treatment”, is based on ten sequential choices between two lotteries, one “risky” (with payoffs of €77 and €2) and one “safe” (with payoffs of €40 and €32), with probabilities ranging from 10% to 100% (see Table 1a). As noted by Holt and Laury, the
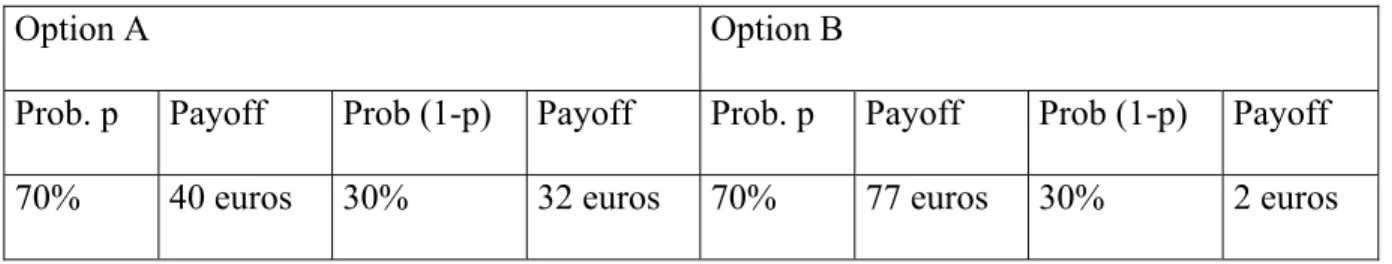
payoffs for the safe lottery (Option A) are less variable than those fore the risky lottery (Option B). In both options the probabilities for the first of the ten sequential decisions are 10% for the high payoff and 90% for the low payoff. The difference in the expected payoffs between the two lotteries is such that only an extreme risk-seeker would choose Option B. As the probability of the high payoff outcome increases B becomes more attractive relative to A, and at some point subjects will switch their preference. Towards the end of the decision sequence even the most risk averse subjects should switch over to option B. Contrary to Holt and Laury, the ten decisions were not presented simultaneously, as in Table 1a, but shown sequentially and randomly, as in Table 1b. The individual treatment consists of 10 successive periods, with a different decision each period. This procedure allows us to measure the differences between group and individual decision-making for each of the ten individual decisions.
[insert Table 1a and Table 1b : about here]
In the “group treatment”, subjects were placed in anonymous groups of three and presented with the same ten decisions as in the individual treatment. After each period, the groups were randomly reshuffled. Group members voted over lotteries to try to reach a unanimous decision. If a unanimous decision was not reached, players continued to a further vote, after being informed of the votes of the other group members. Voting continued until unanimous agreement was reached, or until five voting rounds were completed. If no agreement was reached after five votes, the option was randomly chosen by the computer.
The choice treatment consists of two stages within each period. In the first stage, each individual is endowed with 10 units (with 2 units corresponding to 1 euro) and is asked how much she
would be prepared to pay make their lottery choice alone, with the proviso that only the three individuals with the highest bids (among the 18 players of the session) will be allowed to play the individual treatment, while the others play the group treatment. The price paid by each winner corresponded to the third highest bid. In the second stage, subjects were asked to choose between options A and B, alone or by group, depending on the outcome of the previous stage.
In sessions 1-4, subjects initially undertook the individual treatment, followed by the group treatment and the Choice Treatment. To account for potential order effects, as noted by Harrison et al. (2005), we ran two additional sessions (sessions 5 and 6) with a different sample of subjects which began with the group treatment followed by the individual treatment. At the end of the experiment, the outcome of each treatment was determined by the random selection of a single decision for each treatment. To control for wealth effects, subjects were informed that only one of the two treatment payoffs would be chosen for the payment at the end of the experiment. On average, a session lasted for about an hour and 20 minutes, including the initial instructions and payment of subjects. Each participant earned €40 on average.
4. The experimental results
4.1. Individual and group decisions
In sessions 1-4, the average number of “safe” choices (option A) for the individual treatment is 6.6; in the group treatment, the average number of safe choices is 6.5. In both cases, the number of safe choices increases when decisions are by groups. The analogous figures for the group treatment are 7.11 and 7.03 respectively. Finally, the average number of safe choices is 7.2 in the Choice treatment1. A Mann-Whitney test on the total number of “safe” lottery choices over the
first ten periods rejects the null hypothesis of equal means between the individual and group treatments 1.892; p=0.058). A similar test over periods 11-20 produces similar results (z=-1.864; p=0.0623). However, a Wilcoxon matched-pairs signed-rank test for differences between the number of safe choices in the group and choice treatments finds no significant difference (z = -1.628). Finally, a Wilcoxon rank-sum test cannot reject the null hypothesis of equal distributions between the two individual treatments (z=0.120) as well as between the two group treatments (z = 0.363).
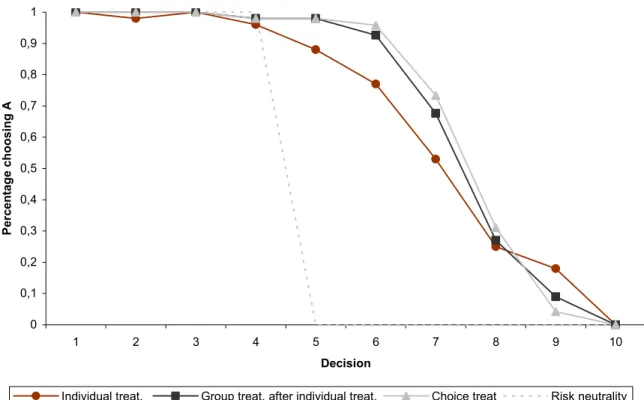
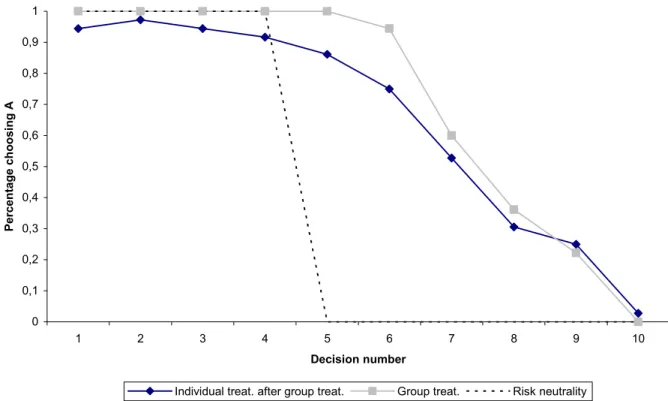
Figure 1a shows the proportion of A choices in sessions 1-4, for each of the ten decisions listed in Table 1a; Figure 1b displays the corresponding data for sessions 5-6. The horizontal axis represents the decision number, which corresponds to the probability of the higher payoff. The dashed line shows predicted behavior under risk neutrality: A is chosen for the first four decisions, and subsequently B.
[insert Figure 1a and Figure 1b : about here]
In Figures 1a and 1b the percentage choosing the safe option A falls as the probability of the higher payoff increases. Further, groups tend to report higher levels of risk aversion for most of the decisions, except for lotteries with high probability of the larger payoff where groups are actually less likely to choose the safe lottery A. This is consistent with the result of Baker et al. (2004).
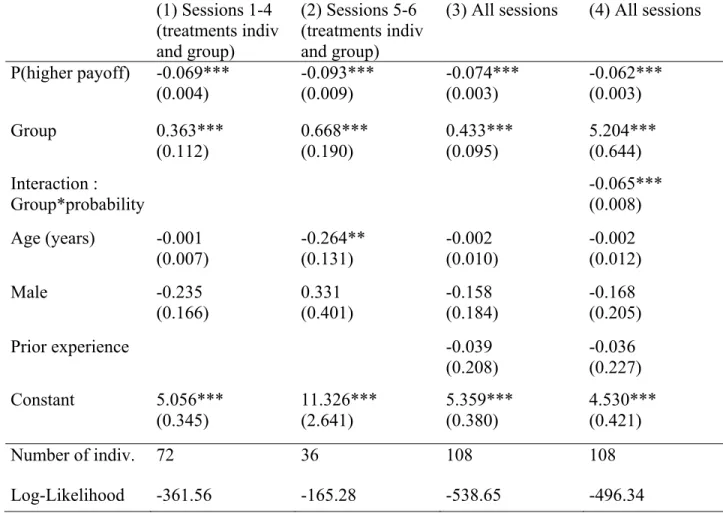
We formalize these results via a random effect probit model, using “safe choice” (lottery A) as the dependent variable. The right-hand side variables include the probability of winning the larger amount (0.1 to 1.0), and dummy variables for group treatment and prior experience. We
also included an interaction between the group variable and the winning probability. Finally, the estimations include standard demographics variables such as gender and age. The results are shown in Table 2.
[insert Table 2. About here]
Columns (1) to (3) reveal that the probability of safe choice falls as the probability of the higher payoff increases, and increases when decisions are collective, suggesting the importance of made in a group, underlining the importance of context. The “prior experience” variable is not significant. Finally the estimated coefficient on the interaction variable shows that groups become progressively more risk-averse as the probability of the higher payoff falls. This is consistent with both Baker et al. (2005) and Shupp and Williams (2003). However, this result is inconsistent with Harrison et al., (2005) who found no group effect. Last, the demographic variables are mostly insignificant.
4.2. Voting decisions and the determinants of collective choice
We now focus on voting decisions in the group treatment. The vote procedure consists of five rounds of voting. If no unanimous decision was reached during a vote, players went on to the next round of voting, after being informed of choices of the other group members in the previous vote. The rounds continued until agreement was reached or until five rounds had been completed. If five votes were completed without agreement, then an option was randomly chosen by the computer. We first consider the evolution of disagreements within groups. Disagreement occurs when the group makes decisions unanimously and when some group member deviates from the
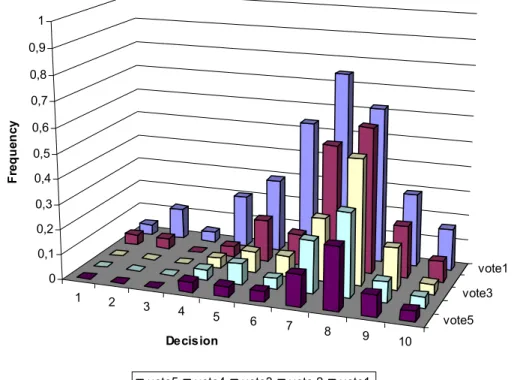
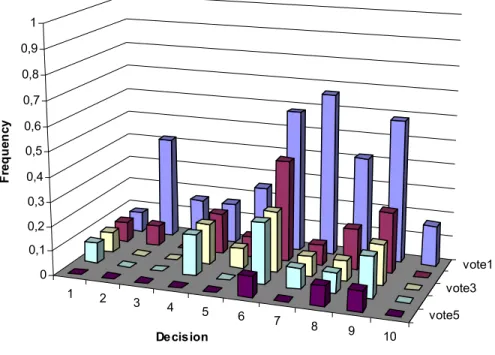
average decision. A number of configurations are possible. First, the subject who disagrees is more risk-loving than the other group members and chooses lottery B while the other two group members choose lottery A. Second, the subject is more risk-averse if he chooses lottery A and the other two subjects choose lottery B. There are also two intermediate situations: the subject is weakly more risk averse if he chooses lottery A (or weakly more risk-loving if he chooses lottery B) and one of the two other group members chooses lottery B (lottery A). We then analyze the determinants of collective choice. Figures 2a and 2b display the evolution of disagreements within groups in each round of voting and for each of the ten decisions listed in Table 1a, for sessions 1-4 and 5-6.
[insert Figure 2a. and figure 2b. About here]
As expected, unanimous group decisions were more difficult for the intermediate probabilities (decisions 5 to 8). The figures also show that the probability of disagreement decreases with the number of voting rounds. For example, the probability of disagreement is 75% in vote 1 of decision 7 in sessions 1-4, and decreases to 12% in vote 5. Groups therefore required several rounds of voting to reach unanimous decisions. Most unanimous decisions involved the safe lottery (A) and the average number of A lotteries chosen increases with the number of votes. For example, the probability of choosing lottery A increases from 66% in vote 1 in sessions 1-4 (63% in sessions 5-6) to 70% (71%) in vote 5. This result is of interest because it suggests that decision-making under the unanimity rule produces safer choices.
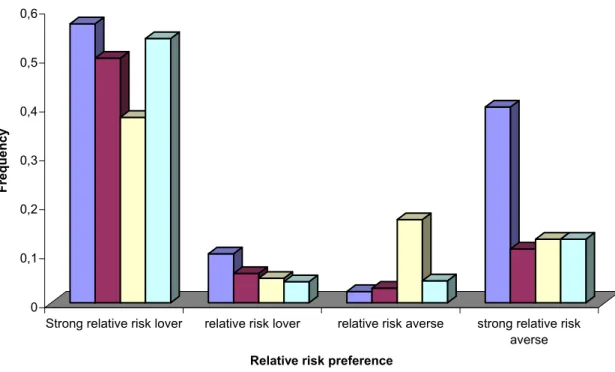
Why groups are more risk averse? We consider the relationship between the probability of changing vote between two rounds of voting and the individuals’ risk attitude relative to the
group’s average risk attitude. The groups defined on the horizontal axis are determined as described above.
[insert Figure 3. here]
Figure 3 shows that the probability of changing decision between two rounds of voting depends on the relative risk attitude compared to the rest of the group. The probability of changing decision is greater when the two other group members have voted for the same lottery. Figure 3 also shows that relative risk lovers are more likely to move towards a less risky choice than are the relatively risk-averse to move towards a more risky choice.
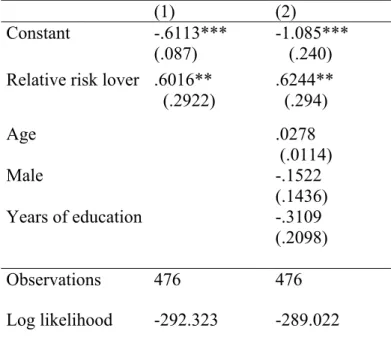
Table 3 provides a formal test of this result, via a random effects probit on the probability of changing decision between two votes. The key independent variable is “relative risk lover”, which equals one if the subject chose the risky option while at least one of the other group members chose the safer lottery. The coefficient on this variable is interpreted in relation with the omitted variable “relative risk averse”. The second specification includes additional variables to control for demographics.
[insert Table 3. here]
The results in Table 3 confirm the previous results. The estimated coefficient on “relative risk lover” is positive and significant at the 5% level, so that the probability of switching is higher if the subject is more risk loving than other group members. Relative risk lovers change their votes towards safer options more often than the relatively risk averse change their vote to riskier options.
4.3. Willingness to Pay and Risk Aversion
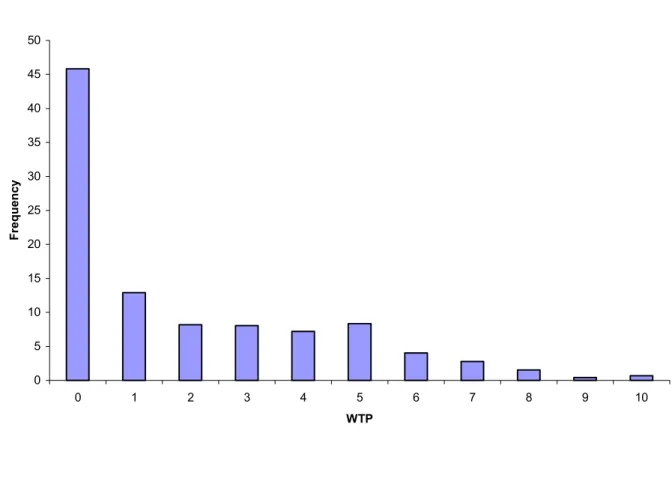
We now consider the relationship between willingness to pay and risk aversion. Figure 4 presents the frequency of bids in the first stage of the choice treatment.
[insert Figure 4. here]
In 45% of cases subjects chose the minimum bid of 0 units, and less than 1% chose the maximum bid of 10 units. The average bid is 1.9 units over all participants, with figures of 5.71 units for those who decided individually and 1.14 units for those who decided in groups.
Table 4 provides a formal analysis of the determinants of WTP, using a Tobit model to control for censoring. The right-hand side variables include the individual’s lagged bid, and a variable measuring risk aversion (the number of safe choices under the individual treatment). Finally we include a variable controlling for previous conflicts within groups, by considering whether the lottery was randomly chosen by the computer in the previous period in the case of disagreement.
[insert Table 4. here]
Table 4 shows, unsurprisingly, that past bid predicts current bid. In addition risk aversion is negatively and significantly related to current bids. Finally, subjects who experienced a disagreement in the previous period are more likely than others to propose a higher bid. Both of these results indicate that less risk averse individuals are more willing to escape from the tyranny
of group decision-making, especially since they tend to compromise more frequently in the group treatment.
5. Conclusion and discussion
The main findings of our study are, consistent with previous research, that groups are more likely to choose safe lotteries than are individuals. We then provide new insights on group decision-making, by showing that relative risk-lovers (subjects who are less risk averse than the other two group members) were more likely to change their vote than were relatively risk averse players, who were reluctant to change their position.
They are number of possible explanations of the group decision making. We have presented our results in terms of willingness to conform to the group. Alternatively, group decision-making may derive from strategic or non strategic motives (altruism, fairness). While it is difficult to distinguish cleanly between theories, we note that our experimental design rules out strategic reasons since all participants were rematched after each period. Also social preferences cannot explain why voting rounds differ from one another in probability of disagreement.
Another alternative explanation of our experimental results is that background risk of choosing randomly an option if no agreement is obtained after vote 5 might interact with individual risk aversion2. However, if this were the case, one should observe a higher level of disagreement in the last voting round compared to the previous other rounds. On the contrary, our results indicate that the probability of disagreement decreases over time with the number of voting rounds, which is more consistent with our conjecture of a dynamic conformity to the group.
Our findings are of interest in the context of previous research. As discussed in the paper, previous results on the effect of collective decision-making on risky choice are mixed. Harrison
et al., (2005) find no group effect, while Baker et al. (2005) indicate that groups are on average more likely than individuals to choose safe lotteries for low winning probabilities. A possible explanation for these differences is that the rule by which decisions are reached is different. In both our work and that of Baker et al, subjects were asked to make unanimous decisions, inducing less risk-averse subjects to converge toward less risky decisions. On the contrary, in Harrison et al. (2005), each group voted for the lottery he preferred under a majority voting rule. There are grounds to expect that choices will be different under the unanimity rule than under the majority rule. Indeed it seems reasonable to assume that the unanimity rule induces more pressure toward uniformity in groups than the majority rule. Moreover, the alternatives over which the group decides may also be influenced not only by the decision rule but also by the amount of information individuals have about one another's preferences. These are likely fruitful areas for additional research on group decision-making.
Footnote
1 The average number of safe choices under the choice treatment is 6.9 for individuals who
2 Most of the time background risk is treated as exogenous (Gollier and Pratt, 1996; Quiggin,
2003). Several studies have investigated the importance of background risk. (Harrison et al., forthcoming; Lusk and Coble, 2006). Lusk and Cobble (2006), find mixed evidence concerning the influence of background risk on risk taking behavior whereas Harrison, List and Towe (forthcoming) observe that background risk increases risk aversion.
Acknowledgments
We are grateful to Andrew Clark, Glen Harrison, Claude Montmarquette, the participants at the 2005 ESA North American Meeting (Tucson), the participants at the Risk Attitude Workshop, the participants at the 2004 french Meeting of Experimental Economics Rennes and the Universities of Rennes1 and Paris1 for helpful comments. We are also grateful to E. Priour for programming the experiment presented in this paper and to the ANR (Agence Nationale de la Recherche) for a grant to support this research.
References
Adams, R.B., & Ferreira, D. (2005). “The Moderating Effect of Group Decision Making.” Working Paper, Stockholm School of Economics.
Baker, R.J., Laury, S.K., & Williams, A.W. (2004). “Comparing Group and Individual Behavior in Lottery-Choice Experiments.” Working paper, Indiana University.
Barreda, I., Gallego, A.G., Georgantzis, N., Andaluz, J., & Gil, A. (2002). “Individual vs. Group Behaviour in Discrete Location-and-Pricing Experiments.” LINEEX Working Paper 37/02.
Bateman, I. & Munro, A. (2005). “An Experiment on Risky Choice amongst Households.” Economic Journal, 115, C176--C189.
Blinder, A. & Morgan, J. (2005). “Are Two Heads Better than One? An Experimental Analysis of Group versus Individual Decision Making.” Journal of Money, Credit and Banking. 37, 789— 812.
Bone, J. (1998). “Risk-Sharing CARA Individuals are Collectively EU.” Economic Letters, 58, 311--317.
Bone, J., Hey, J., & Suckling, J. (1999). “Are Groups More (or Less) Consistent Than Individuals?” Journal of Risk and Uncertainty, 8, 63--81.
Bone, J., Hey, J., & Suckling, J. (2004). “A Simple Risk-Sharing Experiment.” Journal of Risk and Uncertainty, 28, 23--38.
Bornstein, G., Kugler, T., & Ziegelmeyer, A. (2004). “Individual and Group Behavior in the Centipede Game: Are Groups (Again) More Rational Players?” Journal of Experimental Social Psychology, 40, 599--605.
Bornstein, G. & Yaniv, I. (1998). “Individual and Group Behavior in the Ultimatum Game: Are Groups More “Rational” Players?” Experimental Economics, 1, 101--108.
Cason, T.N., & Mui, V.-L. (1997). “A Laboratory Study of Group Polarisation in the Team Dictator Game.” Economic Journal, 107, 1465--1483.
Cooper, D.J., & Kagel, J.H. (2005). “Are Two Heads Better than One? Team versus Individual Play in Signaling Games.” American Economic Review, 95, 477--509.
Cox, J.C., & Hayne, S.C. (2006). “Barking up the Right Tree: Are Small Groups Rational Agents?” Experimental Economics, 9, 209--222.
Fischbacher, U. (1999). “z-Tree: A toolbox for readymade economic experiments.” Working Paper No. 21, University of Zurich.
Hamilton, B.H., Nickerson, J.A., & Owan, H. (2003). “Team Incentives and Worker Heterogeneity: An Empirical Analysis of the Impact of Teams on Productivity and Participation.” Journal of Political Economy, 111, 465--497.
Harrison, G.W., Lau, M.I., Rutström, E.E., & Tarazona-Gomez, M. (2005). “Preferences over Social Risk.” Working Paper 05-06, Department of Economics, College of Business Administration.
Harrison, G.W., List, J.A., & Towe, C. (forthcoming). “Naturally Occurring Preferences and Exogenous Laboratory Experiments.” Econometrica, in press.
Holt, C.A., & Laury, S.K. (2002). “Risk Aversion and Incentive Effects.” American Economic Review, 92, 1644--1655.
Kerr, L.N., MacCoun, R.J., & Kramer, G.P. (1996). “Bias in Judgment: Comparing Individuals and Groups.” Psychological Review, 103, 687--719.
Kocher, M.G., & Sutter, M. (2005). “The Decision Maker Matters: Individuals versus Group Behaviour in Experimental Beauty-Contest Games.” Economic Journal, 115, 200--223.
Kocher, M.G., Strauβ, S., & Sutter, M. (2006). “Individual or Team Decision-Making – Causes and Consequences of Self-Selection.” Games and Economic Behavior, 56, 259--270.
Lusk, J.L., & Coble, K.H. (2005). “Risk Perceptions, Risk Preference, and Acceptance of Risky Food.” American Journal of Agricultural Economics, 87, 393--405.
Prather, L.J., & Middleton, K.L. (2002). “Are N+1 Heads Better Than One? The Case of Mutual Fund Managers.” Journal of Economic Behavior & Organization, 47, 103--120.
Rockenbach, B., Sadrieh, A., & Mathauschek, B. (forthcoming). “Teams Take the Better Risks.” Journal of Economic Behavior & Organization, in press.
Shupp, R.S., & Williams, A.W. (2003). “Risk Preference Differentials of Small Groups and Individuals.” Working paper, Indiana University.
Sutter, M. (2005). “Are Four Heads Better than Two? An Experimental Beauty-Contest Game with Teams of Different Size.” Economics Letters, 88, 41--46.
Sutter, M., Kocher, M., & Straub, S. (2005). “Individuals and teams in UMTS-license auctions.” Working Paper, University of Innsbruck.
Table 1a. Standard Payoff Matrix
Option A Option B
Decision Prob. p Payoff Prob (1-p) Payoff Prob. p Payoff Prob (1-p) Payoff 1 10% 40 euros 90% 32 euros 10% 77 euros 90% 2 euros 2 20% 40 euros 80% 32 euros 20% 77 euros 80% 2 euros 3 30% 40 euros 70% 32 euros 30% 77 euros 70% 2 euros 4 40% 40 euros 60% 32 euros 40% 77 euros 60% 2 euros 5 50% 40 euros 50% 32 euros 50% 77 euros 50% 2 euros 6 60% 40 euros 40% 32 euros 60% 77 euros 40% 2 euros 7 70% 40 euros 30% 32 euros 70% 77 euros 30% 2 euros 8 80% 40 euros 20% 32 euros 80% 77 euros 20% 2 euros 9 90% 40 euros 10% 32 euros 90% 77 euros 10% 2 euros 10 100% 40 euros 0% 32 euros 100% 77 euros 0% 2 euros
Table 1b. Sequential payoff decision
Option A Option B
Prob. p Payoff Prob (1-p) Payoff Prob. p Payoff Prob (1-p) Payoff 70% 40 euros 30% 32 euros 70% 77 euros 30% 2 euros
Table 2. The Probability of Safe Choice: Random Effects Probit
Standard errors in parentheses. * significant at 10%; ** significant at 5%; *** significant at 1% (1) Sessions 1-4 (treatments indiv and group) (2) Sessions 5-6 (treatments indiv and group)
(3) All sessions (4) All sessions
P(higher payoff) -0.069*** -0.093*** -0.074*** -0.062*** (0.004) (0.009) (0.003) (0.003) Group 0.363*** 0.668*** 0.433*** 5.204*** (0.112) (0.190) (0.095) (0.644) Interaction : -0.065*** Group*probability (0.008) Age (years) -0.001 -0.264** -0.002 -0.002 (0.007) (0.131) (0.010) (0.012) Male -0.235 0.331 -0.158 -0.168 (0.166) (0.401) (0.184) (0.205) Prior experience -0.039 (0.208) -0.036 (0.227) Constant 5.056*** 11.326*** 5.359*** 4.530*** (0.345) (2.641) (0.380) (0.421) Number of indiv. 72 36 108 108 Log-Likelihood -361.56 -165.28 -538.65 -496.34
Table 3. Changing Lottery Decision Between Two Votes: Random Effects Probit (1) (2) Constant -.6113*** (.087) -1.085*** (.240) Relative risk lover .6016**
(.2922) .6244** (.294) Age .0278 (.0114) Male -.1522 (.1436) Years of education -.3109 (.2098) Observations 476 476 Log likelihood -292.323 -289.022
Standard errors in parentheses. * significant at 10%; ** significant at 5%; *** significant at 1%
(1) (2) Constant -1.11***
(.189)
-.3136 (.543)
i's lagged bid 1.03*** (.054) 1.04*** (.053) Risk aversion -.132* ( .079) Random vote in previous period .894* (.471) Nb. Obs 648 648 Log likelihood Wald chi2 -1024.14 370.43 -1021.14 373.16 Left-censored observations 292 292 Right-censored observations 5 5
Standard errors in parentheses. * significant at 10%; ** significant at 5%; *** significant at 1%
Figure 1a. The Proportion of Safe Choices in Each Decision (sessions 1-4) 0 0,1 0,2 0,3 0,4 0,5 0,6 0,7 0,8 0,9 1 1 2 3 4 5 6 7 8 9 10 Decision Pe rc en ta ge c hoos ing A
Figure 1b. The Proportion of Safe Choices in Each Decision (sessions 5-6) 0 0,1 0,2 0,3 0,4 0,5 0,6 0,7 0,8 0,9 1 1 2 3 4 5 6 7 8 9 10 Decision number Percen tage ch oo si ng A
Figure 2a. Frequency of Disagreements for Each Decision in Treatment 4 (sessions 1-4) 1 2 3 4 5 6 7 8 9 10 vote5 vote3 vote1 0 0,1 0,2 0,3 0,4 0,5 0,6 0,7 0,8 0,9 1 Fr eq ue n cy Decision
Figure 2b. Frequency of Disagreements for Each Decision in Treatment 4 (sessions 5-6) 1 2 3 4 5 6 7 8 9 10 vote5 vote3 vote1 0 0,1 0,2 0,3 0,4 0,5 0,6 0,7 0,8 0,9 1 Fr eq ue n cy Decision
Figure 3. Change of Vote Decision as a Function of Relative Risk Aversion 0 0,1 0,2 0,3 0,4 0,5 0,6 Freque nc y
Strong relative risk lover relative risk lover relative risk averse strong relative risk
averse
Relative risk preference
change of voting between vote 1 and 2 change of voting between vote 2 and 3
Figure 4. Frequency of Bids 0 5 10 15 20 25 30 35 40 45 50 0 1 2 3 4 5 6 7 8 9 10 WTP F re que nc y