HAL Id: halshs-00654523
https://halshs.archives-ouvertes.fr/halshs-00654523
Submitted on 22 Dec 2011
HAL is a multi-disciplinary open access
archive for the deposit and dissemination of sci-entific research documents, whether they are pub-lished or not. The documents may come from
L’archive ouverte pluridisciplinaire HAL, est destinée au dépôt et à la diffusion de documents scientifiques de niveau recherche, publiés ou non, émanant des établissements d’enseignement et de
Mental maps of students - Volume 2
Clarisse Didelon, Sophie de Ruffray, Claude Grasland
To cite this version:
Clarisse Didelon, Sophie de Ruffray, Claude Grasland. Mental maps of students - Volume 2. 2011. �halshs-00654523�
Cross Country Synthesis on Survey (deliverable 2.6)
Volume 2
Introduction
Clarisse DIDELON and Sophie de RUFFRAY (CNRS-UMR IDEES) Claude GRASLAND (CNRS-UMR Géographie-cités)
2
Introduction
The EuroBroadMap survey: Objectives and rules of elabora-tion of the sample
This first part of the report aims to present the general objectives of the survey conducted in WP2 (mental maps of students) and the methods im-plemented to fulfil these objectives. It provides a general presentation of the main hypothesis in tandem with the general questions asked of the students (Part A of the questionnaire). The mains trends observed in the sample are then summarised in order to be serve as a general reference for the analysis in the other parts (Question A 11 and Parts B and D). Indeed, the structure of the sample allows of identifying different experiences and visions of the world, depending on the students’ education levels, gender, spatial mobility, and socio-economic background.
Objectives and implementation of the survey
The objectives of the survey were to focus at the same time on subjective visions (by mental maps) and externalities outlooks (non-Eurocentric ap-proach) of Europe in the world. The original focus of the project was the identification of geographical representations of the world that are currently available both within and beyond Europe. The starting point for the re-search (WP2) was to launch a worldwide survey on the territorial divisions of the world in general, where the limits of Europe would be analysed as a particular case of “region of the world”. The survey was therefore designed in order to avoid “Eurocentrism” which requires two important conditions: col-lecting answers from people located inside and outside the European Union (we consider that “Europe” is not a relevant category); and avoiding speaking of “Europe” too early.
The first condition for non-Eurocentrism was fulfilled by the choice of the project partners (which was decided at the moment when the consortium was elaborated), but also by the choice of places of survey realised by each project partner, including some new countries where we did not yet have any partner but that were necessary to include in order to balance the weights of countries located inside and outside the European Union.
The second condition for non-Eurocentrism was to organise the survey in such a way that questions related to the general vision of the world would be asked before the questions related to the specific vision of a possible piece of the world called Europe. In this case, we could not fully exclude some Eurocentrism as the material conditions of the survey excluded the possibility of delivering the questionnaire in two separate parts. The specific questions on “Europe” were located on the fourth and final page of the questionnaire, but many students were likely to read all the questions before answering and
could therefore be influenced in their general answers on world division by the fact that the final question was focused on “Europe”. It was also difficult to exclude the fact that students were aware that the survey was being made on behalf of the European Union, even if it was realised by researchers from their own country2 .
Criteria used for the selection of students: Representative places, fields of study, and gender
The decision to survey undergraduate students has some advantages from a theoretical point of view. Firstly, young academic people are probably more aware than others of the existence of “the rest of the world” as they live in a highly inter-connected era in terms of information flows and media (television, Internet), and therefore are more likely to have an enhanced consciousness of the rest of the world as compared to previous generations, and not only a knowledge of the rest of the world but also a point of view about it. Secondly, these student cohorts are about to enter the job market and then, taking into account the different fields we have chosen (economics, politics), to have a role in some aspects of their respective countries’ relations with Europe. They are representatives of a generation that will have a decision making role to play in the near future. Moreover, these people are at a stage of their lives where they are mobile, and they often constitute the type of migrants that the European Union would welcome. It is therefore of some importance to have a better knowledge of their point of view on Europe. Important questions however remain as to the sample of students.
The choice of places of survey inside each country was the first issue examined inside each partner country of the EuroBroadMap project. After collective discussions, it was firstly recognised that it was not possible to use the same number of students in small countries such as Malta and giant countries such as China, India, Brazil, or Russia. The appropriate unit of observation was not the country, but the place of survey, which was defined as a “small piece of territory where it is possible to observe undergraduate students in various fields of study”. The simplest way to fulfil this objective was to realise the survey in the biggest cities of each countries (because all fields of studies are present), but that could have introduced a bias in favour of “metropolitan visions” of the world. It was therefore decided that a “place of survey” should not necessarily be a city but could be a collection of teaching places located in various small cities but possessing sufficient unity to be considered as a coherent sample for the analysis. As an example, the survey realised in France used three “places”: Paris (the capital); Lyon (the second city); but the third place was a combination of university students from two cities of Normandie—Rouen and Le Havre—which offered 2Instructions were given to the persons in charge of the survey to avoid saying too
much on the aims of the survey before it had been filled out.
the possibility of analysing students from a region with a lower income than in the first two sites. The same solution was applied in Cameroon, where three samples were designed on the basis of major cities (Douala, Yaoundén, and Buea), but the fourth sample was based on a collection of students located in smaller cities and less developed parts of the country (Ngaoundere, Dschang, and Maroua). The partners were free to adapt their choice to pragmatic considerations, but they tried generally, especially in the largest countries, to propose different places of survey possessing potential differences not only in terms of location but also in terms of economic and social development.
The choice of academic field of the students was the second ma-jor constraint on collection in each place, because we wanted to be able to examine the hypothesis of a “field of study” perception of the world. We as-sume indeed that teaching courses can have an influence on the perception of the world (economic, politic, geographical regionalisation) and of attractive places. Furthermore, the choice of field by a student can be linked to their choice of life-style. After an examination of the differences of classification in each country, we adopted six different academic fields which appear to be relatively clear in an international perspective of benchmarking: arts (ar-chitecture, cinema, music), social sciences (geography, history, sociology), health (medicine, obstetrics), engineering (physics, chemistry, computer sci-ences), political science (diplomacy, administration), and business (economy, management, advertising). It was indeed necessary to build each sample of students in an equivalent way, in order to make possible benchmarking of the perception of the students according to their academic field. Therefore it was decided that a place of survey should collect exactly 240 answers, divided into 40 answers in each of the six domains of studies that had been cho-sen. We were aware that the proportion of each field of study can vary from one country to another, and that the six categories do not cover all profes-sions. But we decided to adopt strict proportion to better enable statistical comparisons in further analysis.
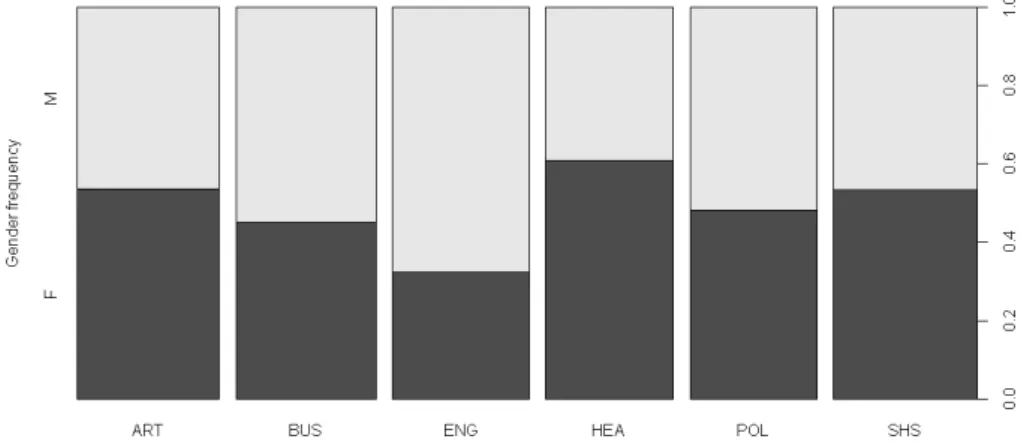
An objective of gender balance was also introduced because we were also interested in the examination of a possible gendered perception of the world. This gender balance was introduced as a “wish-list constraint” because many partners were aware that it would not necessarily be possible to do this for every field of study. And it was sometimes only at the level of places of survey that we could introduce a target of 120 answers by women and 120 answers by men. This gender constraint was fulfilled and the overall repartition of men and women in the whole sample is balanced, even if women are a little under-represented (49.10% of the sample). However, looking at the domain level and at the country level, we observe different trends for the gender repartition. Men are over-represented in Engineering and Business, under-represented in Health. The other domains of studies are quite well balanced .
Figure 2: Gender balance by country and field of study
These differences have been explained by the contexts of the studies in the various countries which are translated into the structure of the global sample. Three countries have an over-representation of females: Sweden, Moldavia, and Tunisia. In Moldavia, the over-representation of women in higher education facilities is mainly due to a specific social dynamic related to the early transition period (a late transition, in this case) in Eastern Europe. The unbalanced gender structure is obvious within each domain sample. In Tunisia, the sample is representative of the present distribution of students among the domains of study in the whole domain of study. The sample is particularly unbalanced in Arts where women are 87% of the students. On the contrary, three other countries have an over-representation of males. This imbalance has been explained by the structures of the samples which do not cover all the domains of study, in particular those of Arts and Health. The characteristic of the Senegalese sample fits the usual profile of Senegalese students: mainly men and relatively old (more or less 30 years old). This fact is due to numerous factors. Students enter late into university programs (more than 20 years old), and the low level of supervision, plus the lack of infrastructures and didactic means, leads to numerous repeating and loss of students (mainly women).
Criteria used for the time and places of survey
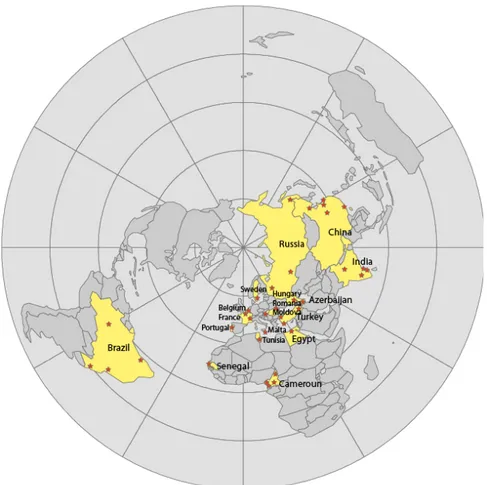
The 12 partners implied in the EuroBroadMap project were in charge of conducting exactly the same survey between July 2009 and February 2010. Initially, only 11 countries could be used as places of survey if we considered it to be necessary to have a project partner in it. But some partners agreed to cover neighbouring countries, and to associate foreign research teams (on a voluntary basis) in order to enlarge the scope of the survey. It was therefore possible to include a full survey in four locations in Russia with the help of V. Kolossov and the financial support of the lead partner. The lead partner launched also surveys in Senegal (Dakar) and Tunisia (Sfax) in order to better cover the southern neighbourhood and was helped by the Maltese partner IRMCo who launched a small survey in Egypt (Alexandria). The Romanian partner TIGRIS realised two surveys in Romania, but also one in Hungary and another one in Moldova, which made it possible to analyse a gradient of changing vision along the successive borders of the EU. Finally, the Turkish partner decided to realise three surveys in Turkey but also one in the neighbouring country of Azerbaijan. As a whole, the survey has been made in 18 countries and 42 cities all over the world (Figure 3) and more than 9300 questionnaires have been gathered in nine different languages.
The countries surveyed initially as partner or added as supplementary places by a partner, have been carefully chosen according to their relative positions in regard to the European Union. Inside the EU, the partners of the project comprise a panel of countries (France, Belgium, Portugal,
Swe-Figure 3: Locations of EuroBroadMap countries and places of survey
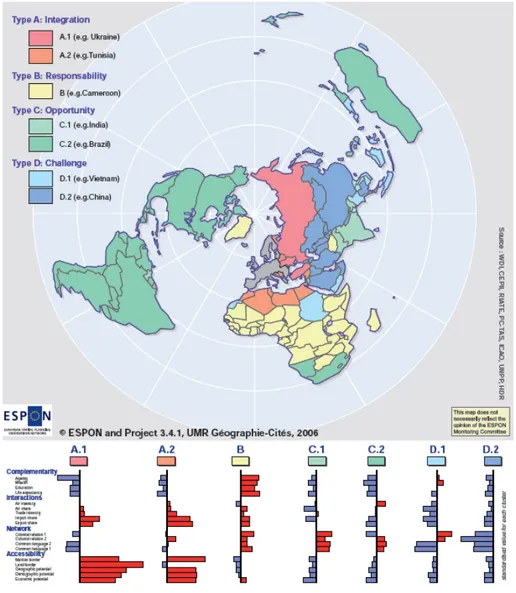
den, Malta, and Romania) located in different geographical parts of Europe, and which became members of the EU at different periods. Outside the EU, the countries have been chosen in accordance with a typology of the external relations of the EU realised in the framework of the study “Europe in the World” of the ESPON program in 2007 (Grasland and Beckouche, 2007[52]) that was made more precise and otherwise improved in an academic publi-cation “Atlas de l’Europe dans le Monde” (Didelon, Grasland, and Richard, 2008[36]). This typology of the European Union’s area of influence was carried out on the basis of a selected list of 18 criteria encompassing the various kinds of relations existing between the EU and all countries of the world: complementarity, interactions, network, and accessibility. The study tried firstly to build a synthetic quantitative index of influence, taking into account the joint effects of all criteria, but the authors noticed that this synthetic index summarised only 34% of the information on the 18 criteria. Many countries were strongly connected to the EU for one set of criteria, but not for the others. That is the reason why the authors elaborated finally a qualitative typology in four types that provides a better summary of the complexity of relations between the EU and the other countries of the world (Figure 4).
The ESPON synthetic typology revealed four basic types of potential external relations between the countries of the world and the EU member states, and these four types have been used as a reference for the choice of the EuroBroadMap partners, in a first step, and for the choice of places of survey, in a second step.
Members of the European Union defines a first sample of places of survey that has been chosen in accordance with the history of EU enlarge-ment from Schuman’s declaration of 1951 to the adhesion of Bulgaria and Romania in 2007. We have firstly the countries that were members of the EU since the beginning, such as France and Belgium. Then countries that symbolised enlargements of the EU toward the South (Portugal, 1986) and towards the north (Sweden, 1995). And, finally, countries that became mem-bers only during the last rounds of enlargement in 2005 (Malta, Hungary) and 2007 (Romania). These countries have also been chosen according to their geographical position in the northern, eastern, southern, or western parts of the European Union, with a clear focus on the margins, as we sus-pect that the vision of the world can be influenced by being located in the frontiers of the EU. For this reason, we have tried, when possible, to have also a survey on countries located on each side of the external borders of the EU, such as Romania/Moldova, Malta/Tunisia, or Turkey/Azerbaijan3.
Type A: Functional Integration is related to the states located in 3
It is important to keep in mind that Turkey is difficult to allocate to a group as it is at the same time a candidate country (future member?) and a major political and economic actor in the European neighbourhood
Figure 4: The ESPON typology of external relations of EU countries in 2000
the immediate eastern and southern neighbourhoods of the EU which are all characterised by a very strong polarisation of their trade and air relations towards Europe, despite the fact that they do not necessarily share the same language. In our sample, this type is represented by Tunisia and Egypt to the south; and by Turkey, Russia, and Moldova to the east. In the case of Turkey and Russia, we used various places of survey (three and four, respectively) in order to analyse possible internal variations.
Type B: Historical Responsibility is related to the fact that many countries of Western Europe (especially France, the UK, Spain, Belgium, Portugal, Spain, Germany, and Italy) established colonial relations in Africa in the 19th century. This common past induces a particular political re-sponsibility of the European Union for the development of these countries at the present time. A strong economic and demographic differential could be reduced through a real partnership based on equality and complementar-ities. In the EuroBroadMap survey, this type is illustrated by Cameroon, a country that has experienced colonial relations with three different Eu-ropean countries (Germany, France, and the UK). Four different places of survey have been chosen in Cameroon in order to analyse possible differences between English colonisation and French colonisation or between littoral and interior. The survey has also been extended to a place of survey located in Senegal (Dakar), in order to verify the degree of generality of the results obtained in Cameroon.
Type C: Opportunity is related to a large group of states located far from the European territory, but sharing a common language and history. This group is typically related to states that were early colonies of Europe and received a lot of emigrants between the 16th and 19th centuries. They
gained their independence earlier than the countries of Africa and have main-tained links with the countries of origin of the migrants. They are generally economic competitors of the EU, but they are also very important potential partners in a global world, where common language facilitates relations in the field of services, research, and cultural innovation. In our sample, this type is illustrated by Brazil, where four different places of survey have been chosen in order to examine internal differentiations. The choice of Brazil presents the particular interest of introducing the comparison with Portu-gal inside the European Union and to examine if common visions of the world can be related to a common language for the countries located inside and outside the EU. It is also illustrated by India which has experienced a long colonial relation with the UK and inherited the practice of the English language in India and other associated cultural practices such as cricket.
Type D: Challenge is related that part of the world where the ESPON study concludes that the European Union countries have a significantly lower influence despite the growing importance of their trade relations. States of this group are located along a large diagonal running from Sudan to the
Persian Gulf, Iran, China, Korea, and Japan. In this group we have chosen to analyse in depth the case of China and to examine five places of survey inside this giant country where it was possible to expect strong internal differences4. The survey in China made it possible to complete the list of the so-called “BRIC” countries (as Russia, India, and Brazil were also surveyed) and to propose a complete view of the vision of Europe in the world by major emerging countries. As in the case of Type C, it could have been of very great interest to introduce more countries of this group in our sample (such as Japan, Iran, or Saudi Arabia), but the resources available did not allow this.
As a whole, the 42 places of survey present a good balance between countries located inside the EU (13 places), countries located in its eastern or southern neighbourhoods (11 places), countries characterised by strong colonial and historical links (9 places), and great emerging countries from Asia (10 places)
General organisation of the questionnaire
The questionnaire was built in a quite participative way as all the teams involved in the project were associated in this step. It started in January 2009 with the discussion of the general organisation of the questionnaire and more precisely with discussing the questions. The point was the need that exactly the same questionnaire would be administrated in all countries to allow comparison, but, therefore, that all questions would be understood in the same way in all languages. In order to catch a non-Eurocentric percep-tion of Europe, the quespercep-tionnaire was organised in three main parts, plus questions related to the students in order to build explicative variables.
The first part (questions Part A) gathers some general questions about the students, focusing on their cultural, social, socio-economic context, spatial history, and their family and world experience. The main objective of this part is to gather some explanatory variables in order to check the hypothesis we made on the variation of the perception of the world and of the perception of Europe in the world.
The second part (questions Part B) is related to the level of attrac-tion of the different countries and cities of the world. The quesattrac-tion is not directly about Europe, but the level of attractiveness of European countries and cities can be deduced from the answers. The aim of this question is to find out what are the different countries / cities that are the most attractive or the less attractive: does the European Union appear? Are the quotation / attraction / non-attraction linked to structural factors (sise factors such as 4Another interest of the Chinese case was the opportunity to cross the EuroBroadMap
results with the ones of the FP7 project “Chinese Views of Europe”
population and wealth) at the world level? Are there differences by country, gender, field, or social and educational level?
The third part (questions Part C) is a mental map exercise where the students are asked to draw on a world map the divisions / regions that compose it and to name them. The aim was to catch the regionalisation of the world that exists in the minds and to check what is the place ded-icated to Europe on a world map. The main questions linked to this part are the following: How many world regions are drawn? What are their char-acteristics (name, position, size)? Where are their limits located: are they concentrated, fuzzy? What are the sharperst limits of the world? The fuzzi-est? How is “Europe” represented on the world map? Are there differences in the world representation by country, gender, field, or social and educational level?
The last part (questions Part D) finally focused on Europe: students had to draw the limits of Europe on a map and to provide five words to describe it. The aim is to check how does the geographical and conceptual perception of Europe vary across the different places surveyed. Are the visions of Europe very different, and how are they manifested in maps and in the use of vocabulary?
Background information on mobility, education, and international experience of students
As gender and field of study variables were introduced as constraints in the elaboration of the sample, their relative frequencies do not deserve more analysis than what has been said in the previous section. But three other categories of variables were introduced as background information that could provide potential explanatory factors of the mental maps of the students. As this background information was not constrained by the sample choice, it is interesting to examine its variation by country, place of survey, and eventually by gender or by field of study.
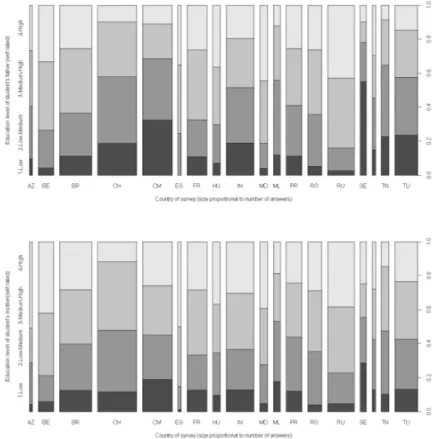
Material and symbolic capital of student’s family
Three background questions tried to evaluate the various forms of social, economic or symbolic capital (Bourdieu, 1984[13], 1988[14]) that can intro-duce variations in the students’ vision of the world. As it was not possible to evaluate directly the economic levels of the students, and complicated to compare educational systems in the 18 countries of the EuroBroadMap survey, we decided to use a qualitative scale where students are invited to provide a self-assessment of their family income and of the education level of their father and mother. This self-evaluation of position is certainly not a perfect measure of the objective situation of the student. But it remains an interesting approach as the subjective assessment of individual position
is an important component of social behaviour. It is for instance well known that women underestimate their opportunities of success (from the school to the labour market), which is precisely a factor of masculine domination (Bourdieu, 2001[15]). For the same reason, we can imagine that what is im-portant in terms of the vision of the world is not necessarily the real income of the student’s family or the real educational level of the parents, but the subjective fact that the student considers these levels as “Low”, “Medium”, or “High”.
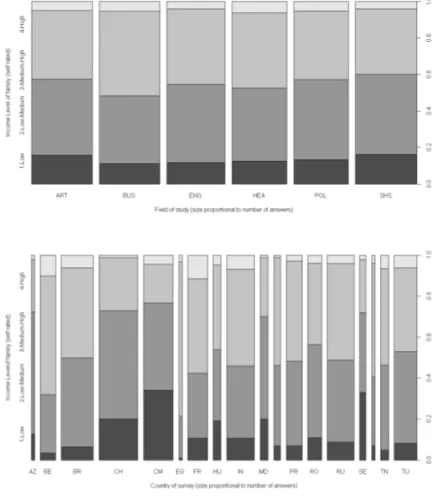
The income level of the family (self-rated) provides an overall eval-uation of the economic capital of the student. The large majority of students surveyed position themselves in the two medium income classes. The sub-Saharan African countries (Cameroon and Senegal) seem specific with the largest number of students that claim to belong to the “Low” level of income, which is consistent with so-called “objective” measures such as GDP/capita which is indeed the lowest for these countries compared to the rest of the sample. But this relation between a so-called objective measure of devel-opment and the subjective perception of students is not systematic, which can be easily demonstrated by the comparison of China and India. China is supposed to have a higher GDP/capita than India, but the proportion of Chinese students that declared to belong to “Low” or “Medium-Low” groups of income is much higher than in India, where a majority of students declared themselves as belonging to family with “Medium-High” or “High” levels of income. We can not exclude the hypothesis that Indian students could really be members of richer families than the Chinese students. But we consider more likely the existence of different collective visions and different criteria of appreciation of personal economic level in each country.
There is also a significant statistical link between the field of study chosen by the student and their evaluation of their family income level. Students in Social Science are over-represented in the lowest income level, and Health students in the highest one. Business students are over-represented in the Medium-High income level and Engineering and Political Science students in the Medium-Low income level. In the majority of countries, this hierarchy is consistent with the objective data concerning the incomes that can be expected by students in their future professional activity.
Parental education level (self-rated) provides an indirect evaluation of the social and cultural capital of the students. The answers are always relatively concentrated in the “Medium” classes, but less so than in the case of income. Many students claim a “High” level of education for their father or their mother. Interesting differences can also been observed concerning the level allocated according to the gender of the parents. For example, the students from Cameroon have generally declared a low proportion of fathers with “High” education, compared to Chinese students. But it is the reverse if we consider the level of education of the mother. We can also notice that
Figure 5: Family income of students (self-rated) by countries and field of study
Figure 6: Educational level of the students’ families (self-rated) by country and field of study
the evaluation of the parents’ education appears sometimes different from the income-evaluation. For example, Russian students have declared lower levels of income than French students, but higher levels of education for both their parents.
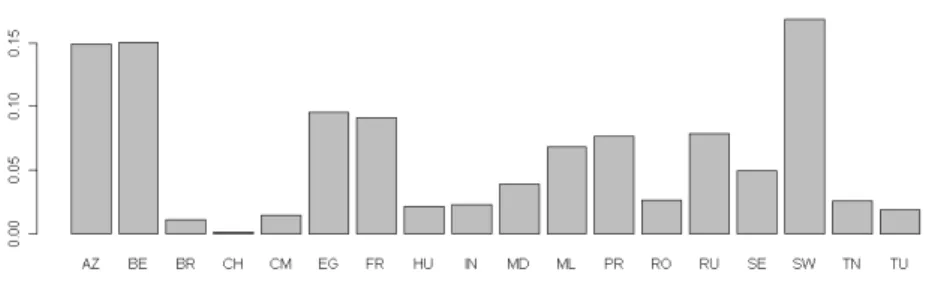
Spatial history of students and their families
The main hypothesis here is that the spatial history of students and families could, to a certain extent, have an influence on their world vision. For example, if a student has answered the questionnaire in one country but was born in another one, the spatial reference may be larger in order to include both spatial references. We assume also that the same effect could take place when the father or the mother were born in a different place than the student, producing a familial experience of international mobility. These effects are measured through the comparison of the birth place of the
Figure 7: Spatial history of students and their families
student with the place of survey (individual mobility), the place of survey of the father (father’s mobility) and the birth place of the mother (mother’s mobility).
Whatever the criteria, the spatial mobility of the family is generally low. The three figures concerning mobility have the same configuration with only a small percentage of the students concerned. This low level of familial mobil-ity is easy to explain by geographical factors (endogamy) and cultural factors (homogamy), which limit marriages between groups from different nation-alities. Nevertheless, it is possible to observe relatively huge differences be-tween the places of survey. The oldest member states of the European Union (France, Belgium, Sweden) are rich countries that have attracted migrants from the rest of the world for a long time, and they are still attractive places
for students from abroad. These factors explain a relatively high level of mixing (between 10% to 15%) with each of the three criteria. This diversity of familial history can also be observed in the Mediterranean countries of the EU (Malta and Portugal) that have been historically territories of emigra-tion, before becoming immigration countries. The result of this turnover is a medium level of familial diversity (6% to 10%). The former socialist countries from Eastern Europe (Hungary, Romania) are characterised on the contrary by very low levels of familial diversity because, after 1989, they have been mainly subject to emigration and do not attract a lot of immigrants and students from the rest of the world. The case of countries derived from the former Soviet Union is different and very high levels of familial mobility can be observed in Russia, and, to a lesser degree, in Moldova. But this mobility is partly an artefact related to the division of the USSR and the creation of new borders between people who were born initially in the same country. In all other countries, except Egypt5, the diversity of family history is very low, in particular in China. These low levels can sometimes be explained by the size of the country (India, China, Brazil) which makes it difficult to be in contact with people from other nationalities. But the low level of familial diversity can also be related to the low level of economic development, which limits the arrival of people from foreign countries (Cameroon, Senegal). In countries of emigration to the European Union (Tunisia, Turkey), the famil-ial mixity is mainly realised by emigrants who prefer generally staying in the European Union and do not contribute to international diversity in their country of origin.
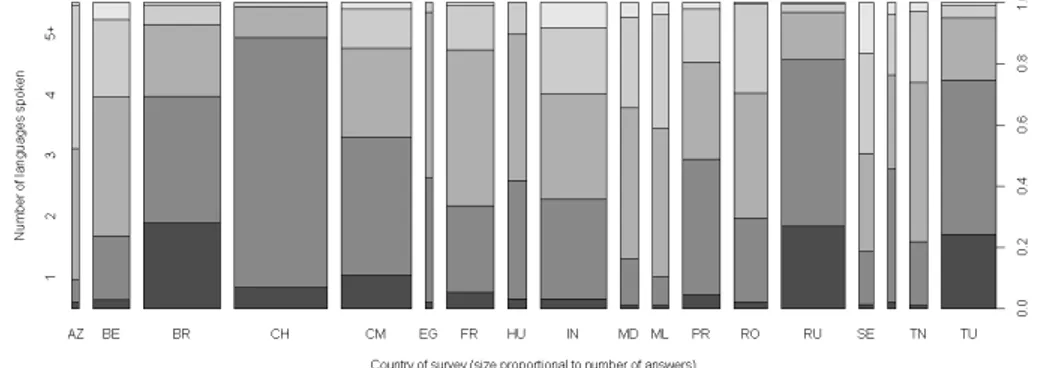
Personal awareness of the international and cultural diversity of the world
The variables gathered provide information on the “awareness” of the inter-national and cultural diversity of the world: the number of languages spoken, the number of countries where the student lived for more than three months, and the number of countries the student has visited for a shorter period (such as holidays). What is the relation between a high level of practice (travel, living abroad) and the world representation? Does it increase the perception of a “global world” with the apparition of “one world” maps or territorialised maps (my home, my space of vacations)? Or does it increase the knowledge of the world and then induce a larger number of areas on maps in order to produce a more precise regionalisation?
The number of languages spoken defines firstly the capacity of stu-dents to experience cultural diversity without necessarily travelling. The majority of the students (73%) claim to speak (or to have spoken) two or
5
This Egyptian exception is difficult to comment on as the sample of students was not completed (98 instead of 240), and also because the place of survey (Alexandria) is much more international than the rest of the country.
Figure 8: Number of languages spoken by students of countries of survey
three languages. Globally, the students claim to speak two or three languages which is quite coherent with the secondary education program as far as Eu-ropean countries are concerned. The repartition is however quite different if one considers the repartition of languages spoken according to the domain. Nearly 50% of engineering students speak one or two languages, but in busi-ness, the figure falls to about 15%. Other facts explaining the difference of number of languages between countries are official languages, and colonial past. For example, the impact of the English language on educational insti-tutions and administrative functions is noteworthy in India. Some countries have a specific multilingual situation, such as Cameroon. Students speak-ing four languages comprise 11% of the total, with 12% speakspeak-ing five and 2% speaking six languages or more. The two official languages, French and English, are systematically taught from the primary school to the secondary school, where a third international language such as German, Spanish, or Arabic, can be chosen. In this context, the average number of languages spoken by the students in the sample is more than two, since in daily life, people speak at least in French or in English, as official languages, and also in one or many of their 220 national languages.
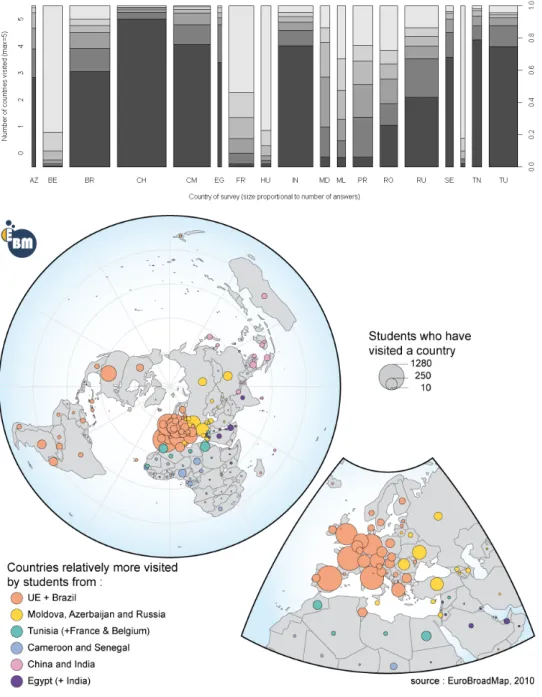
The experience of travel abroad defines a second level of interna-tional experience which is measured here by the number of answers to the question “What are the last five countries you have visited ?” These journeys abroad are not necessarily related for long periods and are generally strongly related to holidays, which implies that they will be necessarily more frequent in rich countries than in poor ones. They are also easier in the parts of the world where the political map is very fragmented in many states of small size, such as in the European Union or Africa. It is obviously easier to travel abroad for a student that lives in Luxembourg than for a student that lives in the central part of China or Russia. . . The combination of these two fac-tors produces a very strong opposition between the students located in rich
but fragmented political areas (France, Belgium, Portugal, Sweden) and the students located in giant but relatively poor countries (Russia, China, India, Brazil). In the first case, a majority of students have taken journeys abroad in a minimum of five different countries. In the second case, the majority of students has never visited another country. Intermediate situations are observed in the countries that combine differently the two factors.
The map of the journeys of students abroad shows that students travelled nearly all over the world, even if some regions are less visited or even not visited at all, such as central Asia or a large part of Africa. A large percentage of students travelled in the European countries but also in countries close to the European Union and in the United States. This can be explained both by the geographical origin of some students from migrants’ families, and by the classical tourist behaviour of student population that is quite well represented among the tourists going to European countries and Turkey. Inside the European countries, a discontinuity appears with the countries of the north of Europe which are less visited. Travels in the USA are also quite frequent among the sample of students, and this country is also among the favourite tourist destination abroad.
With a more detailed look at the results, we have made a classification of the countries visited according to the places of survey. It appears therefore that the importance of the European Union is mostly related to trips from students located inside the EU but also to students from Brazil. These students from the European Union and Brazil are also more likely to claim they have visited countries from North and South America, and we can conclude the existence of a common pattern of travel on both sides of the Atlantic Ocean. The effect of spatial proximity on travel is very obvious when we examine the fact that countries from sub-Saharan Africa are more visited by students from Cameroon and Senegal; countries of Northern Africa are more visited by students from Tunisia; countries from the Persian Gulf are more visited by students from Egypt; countries from Eastern Europe are more visited by students from Moldova, Azerbaijan, and Russia; and countries from Eastern Asia and Oceania are more visited by students from India and China. In other words, the frequency of countries visited is mainly the consequence of the choice of our sample and should not be interpreted as any kind of world measure of attractiveness. But this map is important as it will be very useful for the interpretation of Question B about countries where students would like to live in the near future.
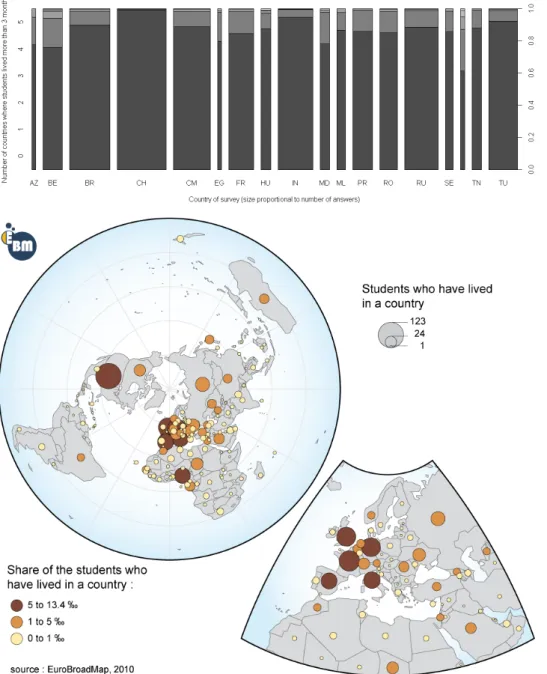
The experience of living abroad more than three months defines the third and higher level of international experience as it implies a more intensive contact with another country or another culture than in the previ-ous case of simple visits during a short period. The choice to live more than three months abroad is often associated for students with a personal choice of career. It can also be related to familial history and therefore associated
to a collective territorial practice that is not only the choice of one individ-ual. But, whatever the explanation, it should have potentially the highest influence on a student’s vision of the world. Looking at the distribution of this experience by countries of survey, we do not find such wide differences as was the case before for the countries visited. Of course, the giant coun-tries (China, India, Brazil, and Russia) are the places where students have experienced the lowest number of visits of external countries for more than three months, but the situation is not very different in many other countries such as Hungary, Malta, Turkey or Tunisia. The international experience of students from the richest countries of Western Europe is finally not so im-portant according to this criterion. And we can suspect that an imim-portant part of the international level of students observed in France, Belgium or Sweden is related to foreign students!
The map of the countries where students lived for more than three months is less concentrated around the European Union than the map of countries visited by students. Only the biggest and richest countries of Western Eu-rope are mentioned by more than 5% of the students (France, Germany, Spain, Italy, and the United Kingdom) as well as the United States and Nigeria (because of Cameroon’s students). Out of these major destinations, students have claim migration nearly all over the world, except for few coun-tries located in South America or in South Africa. It seems that, in the case of the EU, the map is strongly correlated with the attractiveness of coun-tries for studies for cultural reasons, and the relative importance of councoun-tries is similar to what can be measured via the destinations of students in the ERASMUS programs. The countries where some students lived are also apparently quite well linked to the migrations and to the pattern of firms’ interests around the world: a significant share of the students surveyed may have lived during their childhood in foreign countries where their parents were expatriated for professional reasons. One more time, this map should be cautiously interpreted because the EuroBroadMap sample is not repre-sentative of the world distribution of students. For example, the fact that Japan has attracted fewer students than Chad is obviously related to our sample choice and does not reflect the real mobility of students all over the world. . . If the EuroBroadMap survey had been also realised in Korea, the Philippines, or Indonesia, much more mobility to Japan would have been declared. And the same is true for the USA if the survey had been realised in Canada or Mexico.
Conclusion: The potential influence of economic inequalities on mental maps of the world
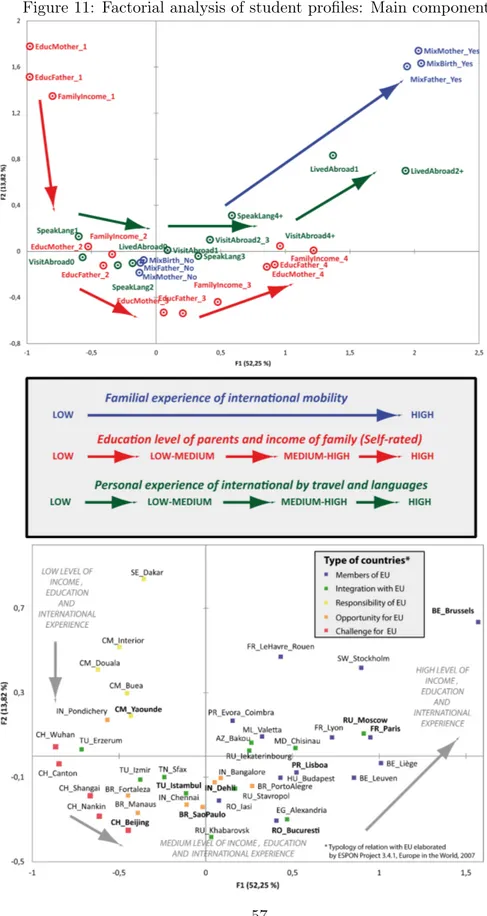
In order to summarise the previous discoveries, we have applied a multiple correspondence analysis to the table of the 8600 students with complete an-swers, described by the nine variables analysed in the previous section, in order to examine the potential correlations between familial experience of international mobility, self-rated economic and educational level, and per-sonal experience of mobility by journeys or languages. The factorial analysis reveals without any ambiguity that all these parameters are strongly associ-ated and define a major component of differentiation between students (52% of total inertia). The second component (13.8% of inertia) is not indepen-dent from the first one because they are obviously related by a non-linear relation (Guttman effect) which implies that both components should be analysed simultaneously as a single factor of differentiation of students that accounts for 69% of the initial information. The other components introduce only minor variations that can be neglected.
Looking at the situation of the different groups of variables, we can ob-serve a clear organisation of the situation of the students, when looking at the different corners of the graph.
Students located in the top left corner are characterised by a “Low” level of familial capital in terms of income or education of the father and mother. This situation of low familial level (self-rated) is associated with very low number of languages spoken and journeys abroad. But it can eventually be related to some experience of international mobility by the fact that student of this type can live in a different place than their place of birth. And they can have parents with birth places different from that of the student. This situation is typically the one of students from Cameroon or Senegal that have a very negative perception of their individual situation and have very few opportunity to travel abroad because of the low level of economic development of their country.
Students located in the bottom left corner also possess, but to a less important degree, the self perception of “Low” to “Low-medium” level of familial income and “Low” to “Medium-Low” level of parental education. Their experience of travel abroad and foreign languages is also very limited, and it is not balanced, as in the previous case, by a familial history of in-ternational mobility. This situation is typically illustrated by Chinese or Turkish students, and also by some places of survey located in India and Brazil. The size of these countries is certainly an important factor in ex-plaining the situation, and confirms the previous assumption that students located at long distances from any borders have very few opportunities to travel abroad and gain international experience.
Students located in the bottom right corner have a more optimistic
evaluation of their familial income and parental education level, which are self-rated from “Medium-High” to “High”. The experience of the world by journeys and eventual migration for more than three months is much higher and is somehow related to a greater number of languages spoken. The famil-ial history is not necessarily very complex, which means that students from this group have generally the same nationality as their parents and generally also live in the country where they were born. This situation is typically observed in countries of Eastern and Central Europe such as Russia and Ro-mania. The fall of the iron curtain has probably introduced new perspectives in mobility for the current generation of students, but this was not the case for the previous generation (see familial history). The experience of foreign countries is generally limited to short periods (holidays) and few students had the opportunity to stay a long time in a foreign country.
Students located in the top right corner possess the highest level of international experience, associated with the highest level of self-rated familial income and parental education. The most original factors in this group are the combination of complex familial histories and high frequency of travel abroad for periods longer than three months. It is clear that this combination is typical of students who were not living in their own country at the moment of the EuroBroadMap survey. To be sure, the fact that Brussels is located in the most extreme top-right position in the graph does not necessarily mean that Belgian students are more international than the others. But it proves that the universities from Brussels are very much open to foreign students with complex familial histories and parents of different nationalities. This situation of strong international experience can also be observed to a less important degree in other places of survey located in Belgium, France, Sweden, or Portugal.
Differences between central metropolitan areas (capital cities) and remote places of survey (geographically isolated or economi-cally underdeveloped) are visible in most of the countries. On the graph, we have indicated in bold the capital cities or the most economically de-veloped places of the countries where the survey was realised in different places. The advantage of metropolitan areas or capital cities is clearly im-portant in Belgium (Brussels), France (Paris), Russia (Moscow), Portugal (Lisbon), China (Beijing), Turkey (Istanbul), Cameroon (Yaounde), and Romania (Bucuresti). It is less clear in India where the best situation is observed in Bangalore and not in Delhi. But it is possible to argue that the level of technological innovation is higher in Bangalore, which is strongly connected to the rest of the world by the computer industry. Finally, the re-lation appears not verified in Brazil, where it is Porto Alegre which appears the most international, rather than Sao Paulo. Looking at the opposite, we can verify that cities that are very far from the borders, or less developed, are generally places where the students are less likely to gain international
experience and where the level of income and education is perceived as lower: Le Havre (France), Erzerum (Turkey), Wuhan and Nankin (China).
In conclusion, it appears that the 42 places of the EuroBroadMap survey have been successfully chosen for assuring equal proportions of fields of study and gender, and also for covering the different types of countries according to their potential interaction with the EU. But it is also clear that the students of our sample are not equivalent in terms of income and education, neither in terms of familial and personal experience of the world through languages and international mobility. It was not possible to control these variations but it is important to keep in mind their potential effect when we will analyse the answers to the various questions of the survey. For example, the degree of belonging that students will claim (on a scale of local to global) is certainly not independent of their familial or personal experience of the world. The countries and cities where they would like to live or not like to live in the near future are probably related to some extent to the countries they have visited. Finally, the limits of Europe and the choice of five words associated with “Europe” are certainly questions that are strongly influenced by the parental educational level and the income of the family of the students.