HAL Id: halshs-00188745
https://halshs.archives-ouvertes.fr/halshs-00188745
Submitted on 19 Nov 2007
HAL is a multi-disciplinary open access
archive for the deposit and dissemination of
sci-entific research documents, whether they are
pub-lished or not. The documents may come from
teaching and research institutions in France or
L’archive ouverte pluridisciplinaire HAL, est
destinée au dépôt et à la diffusion de documents
scientifiques de niveau recherche, publiés ou non,
émanant des établissements d’enseignement et de
recherche français ou étrangers, des laboratoires
Gender wage discrimination in the Turkish labor market
Elisabeth Cudeville, Leman Yonca Gurbuzer
To cite this version:
Elisabeth Cudeville, Leman Yonca Gurbuzer. Gender wage discrimination in the Turkish labor market.
2007. �halshs-00188745�
Documents de Travail du
Centre d’Economie de la Sorbonne
Maison des Sciences Économiques, 106-112 boulevard de L'Hôpital, 75647 Paris Cedex 13
http://ces.univ-paris1.fr/cesdp/CES-docs.htm
Gender Wage Discrimination in the Turkish labor market
Elisabeth C
UDEVILLE, Leman Yonca G
URBUZERGender Wage Discrimination in the Turkish labor market
∗
Elisabeth Cudeville
†and Leman Yonca Gurbuzer
‡May, 2007
Abstract : While the topic of gender equality turns out to be an important element in the preparation of Turkey to join the European Union, very little empirical research on this issue has been done using Turkish data. This paper aims to contribute toward filling this gap. We propose an estimate of the wage discrimination in Turkey relying on different decompositions of the gender wage differential. The data set used is the 2003 Turkish Household Budget Survey. In Turkey, the observed average gender wage gap is about 25.2% in favor of men for the salaried population, and around 60% of it may be attributed to discrimination. In terms of gender wage discrimination, with an observed wage gap close to those observed in France and Italy, and a discrimination component close to the ones obtained in Spain and Greece with comparable methods, Turkey happens to do not so bad. But, in the Turkish case, wage discrimination appears to be a bad indicator of gender inequalities in the labor market, as exclusion and segregation of women are the main concerns.
Keywords: discrimination, gender wage gap decompositions, Turkey. JEL Codes: J16 - J71 - J82
R´esum´e : Si le th`eme de l’´egalit´e des sexes se r´ev`ele ˆetre un sujet sensible dans les discussions pr´eparatoires `a une future adh´esion de la Turquie `a l’Union Europ´eenne, peu de travaux empiriques ont ´et´e men´es sur donn´ees turques. Cet article propose une estimation de la discrimination salariale sur le march´e du travail turc `a partir de diff´erentes d´ecompositions de l’´ecart de salaires hommes-femmes, sur la base de l’Enquˆete m´enage 2003. Il apparaˆıt, qu’en moyenne, en Turquie, sur la population salari´ee, un homme touche 25,2% de plus qu’une femme, et qu’environ 60% de cet ´ecart peut ˆetre attribu´e `a des pratiques discriminatoires. Du point de vue de la discri-mination salariale, avec un ´ecart de salaires observ´e du mˆeme ordre que ceux constat´es en France et en Italie, et une part attribu´ee `a la discrimination, `a partir de m´ethodes directement comparables, proche de celles obtenues sur l’Espagne et la Gr`ece, la Turquie se situe dans les standards europ´eens. Mais, dans le cas turc, les limites des mesures de discrimination salariale comme indicateur des in´egalit´es hommes-femmes sur le march´e du travail appa-raissent clairement, l’exclusion et la s´egr´egation ´etant les probl`emes majeurs auxquels sont confront´ees les femmes.
Mots-clefs : discrimination, d´ecompositions du diff´erentiel de salaires hommes-femmes, genre, Turquie. Classement JEL : J16 - J71 - J82
∗Paper presented at the JMA, Fribourg, June 2007 and the ECINEQ Conference, Berlin, July 2007. †TEAM, Panth´eon-Sorbonne University, elisabeth.cudeville@univ-paris1.fr
1
Introduction
”If a society does not walk towards its objective with all women and all men who compose it, it will not progress.”
Mustafa Kemal Atat¨urk
While Turkey’s accession negotiations to the European Union began in October 2005, the topic of gender equality has turned out to be an important element in the preparation of the country to join the Union. Reports after reports, the European Commission underlines the incompleteness of the Turkish alignment process on the Community acquis in the area of non-discrimination and gender equality. The 2006 Commission’s report notes, as regards equal opportunities, that alignment is required in respect of the Community acquis, in particular concerning parental leave, equal pay, equal access to employment and statutory and occupational social security.
If the question of discriminating practices against women in the Turkish labor market is a recurrent point of debate between the organisms of the Community and the Turkish government — point all the more sensitive that inevitably linked in common minds to cultural and religious factors — there is actually very few quantitative studies on this topic going beyond the simple statements of the very low employment rate for women and a wage differential disfavoring them.
However, we know that such statements are not sufficient to draw conclusions in terms of discrimina-tion against women. In fact, wage gaps may be justified by objective reasons, for instance productivity differences between men and women, themselves explained by differences in education or training. The approach the most commonly used in the literature to measure and analyze wage discrimination is based on wage gap decompositions in the line of the one first proposed by Oaxaca (1973) and Blinder (1973). The idea of these decompositions is to isolate, in the gender wage differential, the part due to differences in the observable characteristics of the individuals, from the part which can not be explained by these differences, generally attributed to discrimination.
Even though this approach of wage discrimination may be, and has been criticized on different grounds, it is nevertheless the one we will follow here as our main concern is comparability. Indeed, the present contribution is not intended to propose methodological improvements on the empirical treatment of wage discrimination but to situate Turkey in terms of gender wage discrimination relative to the EU countries. As far as we know, one of the most recent and comprehensive study on gender wage discrimination implemented on a large sample of European countries is the one proposed by Meurs and Ponthieux (2005). This study presents the great advantage of using recent data — the 7th wave (2000) of the ECHP data set — and applying to the different countries concerned1 a perfectly homogeneous method.
To make possible the comparison with Turkey, we chose to follow the same approach based on different decompositions of the gender wage gap, completed with a Heckman’s two-steps procedure (1979) in order to correct for selectivity. The data set used is the 2003 Household Budget Survey conducted by the Turkish Institute of Statistics.
The paper is organized as follows. In the next section we give few key statistics to briefly present the current state of the Turkish labor market and the space it makes for women. We then describe our data. Section 3 presents our findings with respect to the observed gender gaps in a series of figures. Section 1The analysis is done for 10 countries of the EU : Austria, Denmark, France, Germany, Greece, Ireland, Italy, Portugal,
4 contains the results of the wage equations’ estimates and our decomposition analysis of the gender wage gaps in Turkey. In section 5 we complete our analysis by a treatment of selectivity based on the Heckman’s two-steps procedure (1979) in order to estimate the selectivity corrected wage gap. In the last section, we compare our results with the ones obtained using the same methodology by Meurs and Ponthieux (2005) on European countries.
2
Women in the Turkish labor market
2.1
Some Key Statistics
One of the most serious structural handicap penalizing Turkey in the negotiation process on its future membership in the EU is the state of its labor market. The low employment rate, the high level of unemployment, the size of the informal economy, and the strong disparities between rural an urban areas are the main challenges that Turkey has to take up in terms of employment policy.
Labor force participation in Turkey is exceptionally low by international standards and has been in long-term declining. The overall participation rate of 48.7 % in 2004 was the lowest in the OECD and 21.4 percentage points below the OECD average (Table 1). According to the World Bank (2006), from 1980 to 2004, the working age population (those aged from 15 to 64) grew by 23 million in Turkey, but only 6 million net jobs were created. As a result, the employment rate (the percentage of working age population that is employed) in 2004, at 43.7%, is one of the lowest in the world. Most countries have employment rates in excess of 50%2; the EU-15 average in 2004 was 65 %.
Tab. 1 – Labor Force Participation and Employment, 2004
Population 15+ Labor force Employment Participation rate Employment rate
Thousands Thousands Thousands Percent Percent
Total 49,906 24,290 21,791 48.7 43.7 Female 25,150 6,388 5,768 25.4 22.9 Male 24,756 17,902 16,023 72.3 64.7 Urban 30,813 13,714 11,844 44.5 38.4 Female 15,450 2,832 2,325 18.3 15.0 Male 15,363 10,882 9,519 70.8 62.0 Rural 19,093 10,576 9,948 55.4 52.1 Female 9,700 3,556 3,443 36.7 35.5 Male 9,393 7,020 6,505 74.7 69.3 Memo item : OECD Total 70.1 65.3
Source : SIS, HLFS, and OECD Employment Outlook 2005.
Participation and employment rates differ significantly with respect to gender and location. Rural participation and employment rates are higher than urban and men’s are higher than women’s. For the economy overall, the male participation rate (72.3 %) is nearly three times the female rate (25.4 %). In urban areas, women’s labor force participation is exceptionally low, at only 18.3 % versus 70.8% for
men (Table 1). Actually, a significant part of the gap between the employment rate in Turkey and the EU-15 comes from the very low employment rate for women. According to the World Bank (2006), the employment rate in 2004 in Turkey was 64.7 % for men, while in the EU-15 it was 72.9. By contrast, the average for women, 22.9 %, was less than half the EU-15 average of 57.1%. Thus, by 2004, less than one in four Turkish women aged 15-64 was employed. Moreover, according to studies by the European Foundation for the Improvement of Living and Working Conditions, the female participation rate has dropped to around 20% from 1998 to 2004, in contrast to the rise of women’s participation in the informal sector. These evolutions are the result of the combination of a range of sociological, cultural
Tab. 2 – Educational Attainment, 1988 and 2003 (% of population)
Population Men Women
1988 2003 1988 2003 1988 2003
Illiterate 22.9 11.7 11.6 4.3 33.9 18.9
No diploma 9.1 4.4 9.6 4.0 8.6 4.8
Primary 47.2 49.6 51.8 48.7 42.8 50.6
Lower secondary 8.1 9.8 10.5 12.9 5.7 6.8
Lower secondary vocational 0.7 0.1 1.0 0.1 0.5 0.1
Upper secondary 6.0 11.1 7.1 13.1 5.0 9.1
Upper secondary vocational 2.7 6.4 3.8 8.3 1.7 4.4
Tertiary 3.2 6.9 4.7 8.6 1.8 5.2
Source : SIS Labor Force database.
and institutional factors and partly explain the declining overall trend of the labor market participation. The rapid demographic transition experienced by Turkey since the 1950s and the concomitant structural transformations of the country resulting in a shift out agriculture have been translated into a high ratio of rural-to-urban migration and a decline in women’s participation in the labor force. When rural women actively working in agriculture migrate to urban areas, the fact that they are less educated than men virtually prevents them from finding paid employment in the official labor force. In rural areas, where agriculture dominates and labor-intensive technology is widespread, and where home and work environment overlap to a great extent, all family members are more likely to participate in productive activities, and most of the women and children work as unpaid family labor in agriculture. By contrast, urban households tend to be more specialized, men earn an income while women are homemakers. Lower female participation rates in the urban areas reflect both social custom whereby married women are expected to devote themselves to domestic work and a greater access to education that lowers participation among the youngest. Regional differences are also striking in the instance of female employment. In the West of Turkey, the proportion of women working for pay is 40%, while in the East approximately 90% of women still have the status of unpaid family workers (Ilkkaracan, 1999).
Although between 1980 and 2000 the employment rate in Turkey was continuously falling, the unem-ployment rate did not increase. As a result, open unemunem-ployment is not particularly high, averaging 8 to 10 % during the 1990’s and the early 20003. In the same time, the informal sector has developed, 3Turkey’s unemployment figures are likely to be underestimated as workers have few incitations to report themselves
as unemployed. The unemployment insurance system was legally established in 1999 but the first benefit payments were made in the beginning of 2002 only. Moreover, the coverage of the plan is currently very low. According to the World Bank (2006), less than 4% of the unemployed workers are getting benefits.
and according the the last report of the World Bank, more than half of the working population is today working in the informal sector. In urban areas, one worker out of three has no social insurance, and in rural areas, this proportion raises up to three persons out of four. Consequently, half of existing workers in Turkey receive no social benefits or job protection, and this precariousness affects more often the female workers, which are more concerned by unemployment4and when working are more often employed in the
informal sector.
Thus, even though gender discrimination is legally prohibited 5 in Turkey, the situation of women
in the labor market appears particularly worrying. However, these descriptive statistics does not say if the situation is due to active discrimination against women. It could be also the result of the traditional accepted gender division in the Turkish society, or the consequence of inferior human capital characteris-tics of women, particularly in terms of education. This is the question that we will try to clarify in the following sections.
2.2
Structure of the Population Studied
The data used in this study is taken from the 2003 Household Budget Survey conducted by the Turkish State Institute of Statistics (SIS). This survey uses samples representative of the whole population, chosen in both urban and rural areas, in order to study the behavior of Turkish households. The final sample is composed of 107,614 individuals from 25,920 households.
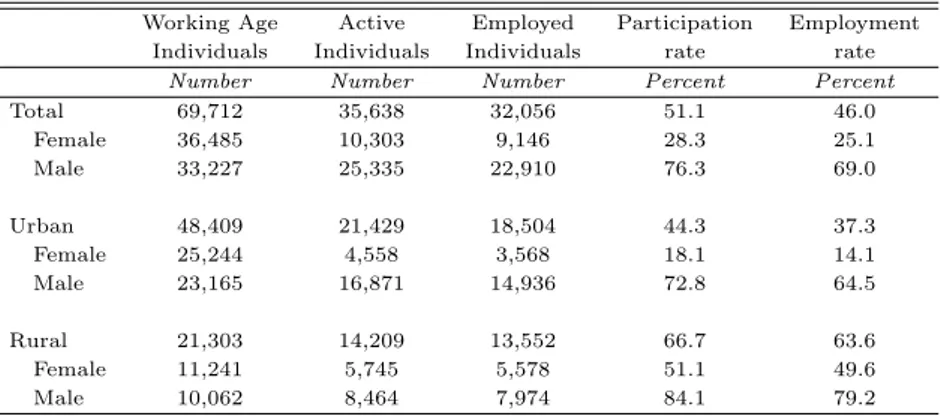
We confine our investigation to the working age population, that is individuals from 15 to 64, which numbered 69,712, with 47.7% males and 52.3% females (Table 3). Among them, only 35,638 are active, resulting in a very low labor force participation rate equal to 51.1 %. Women’s participation in the labor market is even lower as if they count for more than half of the sample working age population, only 28.3% are active. Therefore, the great majority of the inactive people of working age are women (76.8 %). If we consider only what we could call the ”pure inactive” people (by excluding from the inactive those who can not apply for a job : the individuals who are waiting to start work, the students, the sick and disabled persons, the pensioners ...), 95.1 % are women (see Table 21 in Appendix 1). Table 3 also shows that participation and employment rates are higher in rural than in urban areas, especially for women.
In our sample, the unemployment rate (the percentage of the labor force that is unemployed) reaches 10.1 % and is very close to the national average unemployment rate equal to 10.5% in 2003. Women are slightly more concerned than men as the female unemployment rate is equal to 11.2% and the male’s is 9.6%.
Figure 1(b) shows clearly that the bulk of working aged women are inactive (73%). When they are active, one women out of two is an unpaid family worker, and one out of three is a wage employee. Compared to men, active women are far less often wage-earners, self-employed or employers (see Table 4).
If we focus on the salaried population, who represents 23.6 % of the sample working age population, women become scarcer as they count for only 20 % of the salaried workers. This proportion is falling to 18.5 % when we restrict to the full-time salaried workers only (those working at least 30 hours a
4According to World Bank (2006), in 2002, 24.7% of women only have access to social security, for 50.9% of men. 5Labor Law Article 26 stipulates that male and female workers performing jobs of the same nature and working with
Tab. 3 – Structure of the Population Studied
Working Age Active Employed Participation Employment
Individuals Individuals Individuals rate rate
Number Number Number Percent Percent
Total 69,712 35,638 32,056 51.1 46.0 Female 36,485 10,303 9,146 28.3 25.1 Male 33,227 25,335 22,910 76.3 69.0 Urban 48,409 21,429 18,504 44.3 37.3 Female 25,244 4,558 3,568 18.1 14.1 Male 23,165 16,871 14,936 72.8 64.5 Rural 21,303 14,209 13,552 66.7 63.6 Female 11,241 5,745 5,578 51.1 49.6 Male 10,062 8,464 7,974 84.1 79.2
Source : HBS Turkey 2006, (SIS Turkey).
Tab. 4 – Composition of the Labor Force
Status Wage Earners Employers Self-Employed Unpaid Family Unemployed Total
Workers
Total 16,475 (46.2 %) 1,684 (4.7 %) 6,602 (18.5%) 7,295 (20.5%) 3,582 (10.1%) 35,652
Female 3,301 (32.1%) 61 (0.6%) 883 (8.6%) 4,901 (47.5%) 1,157 (11.2%) 10,310
Male 13,174 (52.0%) 1,623 (6.4%) 5,719 (22.6%) 2,394 (9,5%) 2,425 (9.6%) 25,342
Source : HBS Turkey 2006, (SIS Turkey).
week.6). If in urban areas, wage and salary employees form the largest fraction of the male and female
working populations with 72.3% and 79.2% respectively, in rural areas by contrast, 42.9% of working men are self-employed and only 29.9% of them are wage earners. Concerning women, the dominant form of employment in rural areas is unpaid family membership with about 80% of the total, only 8.6% of rural active women are wage-earners (see Table 24 in Appendix 1).
In the sample, women are more likely than men to be in precarious jobs, even among salary workers (see Table 5). The proportion of salaried women with long term contracts is equal to 76.2 % compared to 85.6 % for men, 58.5% of them are registered in social security compared to 65.6% of the salaried man. If we consider the fact of not being covered by any social insurance as a proxy of the belonging to the informal sector7, women are proportionally more concerned.
Gender disparities in education appear clearly in the data (Table 6), and are particularly pronounced at the lowest levels of education. In our sample, 21.6% of the working age women are illiterate or non graduate compared to 6.4% of their male counterparts. A third only of women of working age have achieved a level of education higher than primary school, compared to more than half for men.
The picture is quite different if we focus on the salaried population of our sample (Table 6 and Figures 2). Salaried women happen to be strikingly more educated than their counterparts of working age. Illiterate and non graduate women are clearly under-represented among wage earners, though the
6The legal working time in Turkey is 45 hours a week.
24% 7% 40% 5% 17% 7% Inactive Unemployed Salaried Employers Self-employed Unpaid workers
(a) Men of Working Age
73% 3% 9% 0% 2% 13% Inactive Unemployed Salaried Employers Self-employed Unpaid workers
(b) Women of Working Age
Fig. 1 – Activity Status
Tab. 5 – Type of Labor Contract
Wage-Earners Long-term Covered by social Full-time
contract insurance
Total 16,475 13,800 (83.8%) 10,574 (64.2%) 15,286 (92.8%)
Female 3,301 2,516 (76.2%) 1,930 (58.5%) 2,829 (85.7%)
Male 13,174 11,284 (85.6%) 8,644 (65.6%) 12,457 (94.6%)
Source : HBS Turkey 2006, (SIS Turkey).
most educated are over-represented. So, salaried employment concentrates women who are comparatively more educated. This phenomenon does not concern men to the same extent.
Given the scarcity of women in the Turkish labor market, occupations are all dominated by men except the skilled agricultural workers (Figure 8(a) in Appendix 1). This exception is explained by the
Tab. 6 – Educational Attainment
% of Working Age Population % of Salaried Population
Population Men Women Population Men Women
Illiterate 8.8 2.5 14.5 2.1 1.4 4.6
No diploma 5.6 3.9 7.1 2.3 2.1 3.0
Primary 42.9 41.5 44.2 37.9 40.3 28.4
Lower secondary 16.9 19.9 14.1 14.3 15.4 9.9
Lower secondary vocational 0.3 0.4 0.2 0.5 0.6 0.2
Upper secondary 16.1 19.1 13.3 20.8 20.8 21.1
Upper secondary vocational 3.1 4.4 2.0 6.3 6.3 6.4
Tertiary 6.4 8.3 4.6 15.8 13.1 26.5
Source : HBS Turkey 2006, (SIS Turkey).
0% 5% 10% 15% 20% 25% 30% 35% 40% 45% 50%
No Diploma Primary Middle High University Men Women
(a) Working Age Population
0% 5% 10% 15% 20% 25% 30% 35% 40% 45% 50%
No Diploma Primary Middle High University Men Women
(b) Wage Earners Fig. 2 – Distribution of Men and Women by Educational Attainment
domination of women among unpaid family workers. Indeed, if we restrict to the salaried population only, all occupations are male-dominated (see Figure 8(b) in Appendix 1). Concerning sectors, women dominate the agricultural sector — where are found most of the unpaid family workers — and the sector of private households with employed persons, where domestic workers — who are mainly women — are registered. Except for agriculture, the gender composition of sectors is very close for the working aged and the salaried populations (see Figures 9 in Appendix 1).
Genders are differently distributed across occupations and sectors. The bulk of working women are agricultural workers, nearly 60% against 20% of their male counterparts (Figure 3(a)). The distribution of the female salaried population across occupations is much less concentrated — as more than half of the salaried women is uniformly distributed across intermediary occupations (17% are professionals, 15% clerks, 12% service and sale workers) and a quarter is elementary workers (Figure 3(b)). It is worthwhile noticing that, in our sample, female salaried workers are more likely to be managers, professionals or employees than their male counterparts, although the latter are more often skilled or unskilled workers. We find here the same feature than in the Southern European countries (Spain, Greece, Italy or Portu-gal) where the proportion of women holding managerial positions is higher than men’s (see Meurs and Ponthieux, 2005). The main reason of this particularity is the low employment rate for women in these countries. As women are actually fewer in employment, those holding high-status occupations are pro-portionally in greater numbers compared to men in these countries, or to women in the other developed countries. This trait may also be partly explained by a generation effect, older women being less likely
to be active, and when active, more likely to be unpaid family workers than the younger, who are more likely to be both better educated and salaried.
0% 10% 20% 30% 40% 50% 60% 70%
ManagersProfess. Techni. Clerks Service Work.
Sk. Agric. Work.
Craft Work. Operators Elem. Occ.
Male Female
(a) Working Population
0% 5% 10% 15% 20% 25% 30%
Managers Profess. Techni. Clerks Service Work.
Sk. Agric. Work.
Craft Work. Operators Elem. Occ.
Male Female
(b) Wage Earners Fig. 3 – Distribution of Men and Women by Occupation
At the sector level, if working women are concentrated in agriculture, the salaried women are found first in the manufacturing sector, followed by education and trade (see Figure 4). Interestingly, if in much countries the public sector appears rather favorable to female workers, this does not seem to be the case in Turkey since the public sector employs women and men in quite the same proportions than the private one, and the distribution of men and women between these two sectors is the same (see Table 23 in Appendix 1).
Finally, concerning differences in geographical location, 36% of the female salaried workers are concen-trated in the Marmara region (the westerner region of the country, where Istanbul is located). A closer examination show that among wage-earners, the proportion of women is falling when moving toward the Eastern regions (see Figures 10). This can be related to cultural and religious differences between these two areas, Eastern regions being more rural and less developed than the Western ones. When considering the geographical distribution of the working population rather than the salaried one, the proportion of women raises up, particularly in the rural regions (Black Sea, South East Anatolia, East Anatolia), what can be linked to the number of unpaid family workers among active women (see Table 25 and Figures 5 and 10).
On the whole, we find clearly in our sample data the global characteristics of the Turkish labor market described in the preceding section : women do not participate much in the labor market, they are on average less educated than men, they are more often in precarious jobs and in the informal sector. Salaried women are even scarcer — the probability to accede to the salaried employment is much lower for women than for men — they are mainly urban, much more educated than the women’s average and form the majority of the high educated wage earners. Compared to men, they are more likely to occupy high-status occupations. These characteristics may indicate a high selectivity for women into salaried employment, the process of selection setting for them higher standards in terms of educational attainment. The figures presented so far reveal striking differences in the way men and women are distributed into employment, across occupations and sectors, and let suspect that the mechanisms of selection into work and into salaried work are likely to be gender specific in Turkey, the selection process being potentially tainted of segregation. Those differences would have to be taken into account in our analysis of discrimination.
0% 10% 20% 30% 40% 50% 60% 70% Agr . Fish ing Min ing Man uf. Ele ct. Con stru . Trad e Hot els Tran sp. Fina nc. RE , ren ting Pub lic a dm . Edu . Hel ath Oth er p ers. Ser v. Priv . Hsl d se rv. Ext ra-te rrit. Male Female
(a) Working Population
0% 5% 10% 15% 20% 25% 30% Agr . Fish ing Min ing Man uf. Ele ct. Con stru . Trad e Hot els Tran sp. Fina nc. RE , ren ting Pub lic a dm . Edu . Hel ath Oth er p ers. Ser v. Priv . Hsl d se rv. Ext ra-te rrit. Male Female (b) Wage Earners
Fig. 4 – Distribution of Men and Women by Industries
3
Observed Gender Wage Gaps in Turkey
The relative gap between the male and female average monthly wages8computed on the full sample
of the salary workers is equal to 25 % in favor of men (Table 7). The average monthly wage differential is much lower, 10.4%, if we restrict to the sole full-time salary workers. Those figures are not so high when compared to the European standards. Meurs and Ponthieux (2005) compute the average gender wage 8Wages are the sum of cash earnings, bonuses and the value of income in-kind. Fringe benefits are not included in the
0% 5% 10% 15% 20% 25% 30%
Marmara Aegean Mediterranean Black Sea Central Anatolia Eastern Anatolia Southeast Anatolia Female Male
(a) Working Population
0% 5% 10% 15% 20% 25% 30% 35% 40% M arm ara A egea n M ed ite rr. B lack Sea C . A nato lia E as t. A nato lia SE A nato lia Female Male (b) Salary workers Fig. 5 – Distribution of Men and Women by Region
ratio on the salaried workers aged 25 to 55 and working at least 15 hours a week for seven European countries and find results varying from 1.2 in Portugal to more than 1.5 in Germany, Austria, Ireland and the United Kingdom. On our data, we obtain, for the same population, a ratio equal to 1.13 (Table 7). Then, if we stuck to this simple comparison, situation of Turkey in terms of wage equality would not seem particularly worrying as the Turkey’s average wage gap lies in the same scope than the one observed in the UK, the Netherlands or Germany, that is between 20 to 25%. But beyond this observation, the crucial point is to know how much of this gap is due to discrimination.
Tab. 7 – Observed Gender Monthly Wage Gap (New Turkish Liras)
Wage Earners (15-64) Full-time Wage Earners (25-55) Full-time
Wage Earners (15-64) working at least 15 h./week Wage Earners (25-55)
Men Women Wage gap Men Women Wage gap Men Women Wage gap Men Women Wage gap
(1) (2) [(1)/(2)] (1) (2) [(1)/(2)] (1) (2) [(1)/(2)] (1) (2) [(1)/(2)] Average 487 389.6 1.25 491.9 410.3 1.20 531.7 469.7 1.13 533.8 483.5 1.10 Median Wage 380 260 1.46 400 300 1.33 430 350 1.23 434 380 1.14 D1 180 90 1.80 200 119 1.68 220 100 2.20 223 130 1.71 D9 863.6 750 1.15 870 778 1.12 900 850 1.06 900 850 1.06 D9/D1 4.8 8.33 - 4.35 6.54 - 4.09 8.50 - 4.04 6.54
-Source : HBS Turkey 2006, (SIS Turkey).
Table 7 also shows that the wage gap is not uniform throughout the distribution of wages but is clearly higher at the bottom of the distribution where it reaches 80% for those aged 15-64 and 120% for the 25-55 working at least 15 h./week, and substantially lower at the top, where it is only of 13% for the 15-64 and 6% for the 25-55. This result remains true when we consider the full-time salary workers only. Figure 6 plots the gender gap in terms of the differences of logged gross monthly wages of respectively male and female salaried workers working at least 15 hours a week. As can be observed, there is a decreasing trend, and the gender gap at the various percentiles differs notably from the gap at the mean. This evolution stands in sharp contrast to the one found for example by Albrecht et al. (2003) in the case of Sweden, where the raw gap increases from the bottom to the top of the log wage distribution, given rise to the well-known glass ceiling phenomenon. Here we have a decreasing trend, resembling the sticky floor phenomenon documented for example in de la Rica, Dolado and Llorens (2005) for the low educated
0 0,1 0,2 0,3 0,4 0,5 0,6 0,7 0,8 0,9 1 2 3 4 5 6 7 8 9 Percentiles G e n d e r W a g e G a p ( s a la ry w o rk e rs ) 15-64 working at least 15h./week 25-55 working at least 15h./week
Fig. 6 – Gender Wage Gap Distribution
Spanish workers9. The ratio D9/D1 reported in Table 7 also shows the high degree of inequalities in the
distribution of wages that prevails in Turkey, inequalities much more pronounced for women.
Given that the working time is typically unequal between men and women, it is likely that a part of the observed gender monthly wage gap is explained by differences in hours worked. In our sample, male wage earners work in average seven hours more than their female counterparts : the weekly average working time for women is about 44 hours, and nearly 51 hours for men (Table 8). The proportion of part-time workers10in the salaried population is low, only 5.2%11, and women are more concerned than
men, as 10.5% of them work part-time against 3.9% for men (see Table 22 in Appendix 1). However, the difference in working time does not come only from a part-time work effect, but also from differences in hours worked in full-time employment as shown by table 8. As noted by Meurs and Ponthieux (2005), the working time is strongly constrained by sector and occupational practices and most often, workers have to conform with the norm of their activity. Given that occupations and sectors are heterogeneous in terms of the average working time, the hourly wage rate is not appropriate to study wage inequalities. This point is particularly important in the study of gender wage gaps as certain occupations are dominated by women, and others by men. In order to take into account those differences in hours worked between men and women, we will retain the monthly wage as the dependant variable in our econometric analysis of the gender wage gap and will include the working time as one of the explicative variable.
Male and female salaried workers differ in their working time and the type of jobs they occupied. They also differ in their human capital characteristics as education attainment or experience. The differential in monthly wages between men and women may thus be explained by these objective differences, but 9The rationale they give to explain this phenomenon may fit quite well the case of Turkey. Insofar as Turkish women’s
careers suffer from frequent interruptions — due to social discrimination in family duties and religious beliefs — employers may use statistical discrimination resulting in lower wages in the lower part of the wage distribution, which typically corresponds to entry jobs in the labor market. As their job tenure expands, however, women become more reliable to employers and their wages converge to those of men.
10The legal working time in Turkey is 45 hours a week. We consider full-time a wage-earner working 30 hours a week or
more, and part-time a wage earner working between 10 and 29 hours.
11This is low compared to the average EU part-time employment rate equal to 18.2% in 2002 according to the European
Foundation for the Improvement of Living and Working Conditions (Corral and Isusi, 2003). The part-time employment rate in Turkey is comparable with the one observed in Greece (4.5% in 2002).
Tab. 8 – Gender Differences in Weekly Worked Hours
Wage Earners Full-time Wage Earners Full-time
(15-64) Wage Earners (15-64) (25-55) Wage Earners (25-55)
Men Women Wage gap Men Women Wage gap Men Women Wage gap Men Women Wage gap
(1) (2) [(1)/(2)] (1) (2) [(1)/(2)] (1) (2) [(1)/(2)] (1) (2) [(1)/(2)] Average 50.9 43.8 1.2 53.0 48.6 1.09 50.4 42.1 1.20 52.4 47 1.11 Median 48 45 1.1 50 48.0 1.04 48 40 1.20 48.0 45 1.06 D1 40 20 2.00 40 36 1.11 40 20 2.00 40 35 1.14 D9 70 60 1.17 70 63 1.11 70 60 1.17 70 60 1.17 D9/D1 1.75 3.00 - 1.75 1.75 - 1.75 3 - 1.75 1.71
-Source : HBS Turkey 2006, (SIS Turkey).
it may also partly result from a different evaluation by the market of identical characteristics, what is generally referred as discrimination. These returns are not directly observable but have to be estimated. We do so by estimating Mincer-type earnings equations.
4
Gender Wage Discrimination in Turkey
4.1
Earnings Equations Estimates
The usual approach to investigate the wage gap — the one we will follow here — has been derived from human capital theory (Becker, 1956 ; Mincer, 1958, 1974), where an individual’s wage rate reflects the productivity potential based on various human capital characteristics. According to Oaxaca (1973) and Blinder (1973), any wage differential between two groups of people can therefore be decomposed into two parts. The first is explained by differences in observable human capital endowments supposed to reflect productivity differences and other job related variables between both group (endowment effect), the second reflects differences in the values assigned in the labor market to women’s and men’s characteristics, that is the price or remuneration of these endowments (remuneration effect). This latter part of the wage differential may be interpreted as an estimate of wage discrimination.
In this line, we assume the following log-linear wage regression model :
lnW = βX0+ u (1)
where W is the monthly wage in New Turkish Liras, X is a vector of explicative variables including the set of usual Mincerian human capital variables augmented with working time related variables, job attributes and firm and sector characteristics, β is a vector of unknown parameters — the returns of the aforesaid characteristics —, and u the error term.
The detailed list of the earnings equation’s variables, as well as the reference categories chosen for dummies are given in Appendix 2, Figure 11, and descriptive statistics are reported in Table 26. Education is represented by dummy variables indicating different levels of education attainment. Few information related to work experience are available in our data set. Consequently, following Mincer (1974), we define a proxy for actual work experience as age minus the number of years of schooling completed minus seven, the age of entry into school in Turkey. This variable measures what is called the potential experience, where we would like to measure the actual experience. When work experience is acquired
without interruption after the completion of formal schooling, potential and actual experience coincide. Potential experience is typically a reasonable proxy for the men’s actual experience since men on average exhibit a strong attachment to the labor force. However, potential experience overstates the actual years of work experience of women to the extent that career’s interruptions are frequent for many female workers due to their household and childbearing activities. This problem of measurement typically creates a bias toward finding discrimination. To better measure the effective experience — following Oaxaca (1973) — we include the number of children born to the women as a regressor of the earnings equation as a proxy of the cost of career’s interruptions for women. The linear children variable reflects the cost of lost experience due to child care, including the costs from the depreciation of skills during the period of absence from the labor force. Accordingly, we expect the estimated coefficient of the number of child variable to have a negative sign.
One could think that this problem of measurement of female actual work experience is not so significant in the case of Turkey, having in mind the example of Southern European countries, where typically women once married and having children leave definitely the labor market. In fact, this is not the case in Turkey where a very small fraction of working aged women enters the labor market. Figure ?? plots the male and female participation rate computed on our sample data. It shows clearly that when women decide to participate — what very few do — they stay in the labor market.
In the set of regressors related to experience, we also include tenure on the last job occupied, as well as the square of potential experience and of job tenure in order to capture the non linearity of the wage–experience relation.
Since we use the monthly wage as dependent variable, we include variables related to the working time in the set of the regressors : we use the natural logarithm of the weekly worked hours and a dummy indicating part-time employment. At last, we had as control variables, variables related to the class of worker (dummy variables for union membership, government employed, social insurance), the type of labor contract (dummy variables for permanent and fixed term contracts), the job occupied (dummy variables for occupations and industries) and the geographical localization (dummy variables for residence in rural area and for the seven big Turkish regions).
The results of the estimates are presented in Appendix 2, Figures 13 and 14. The different components of human capital (education level, potential experience and job tenure) have a positive and significant effect on wages for both men and women. The returns to job tenure are very close for both sexes, although the returns to education and potential experience are higher for men at all levels. Experience squared and job tenure squared have a negative impact on wages also for both sex, implying that wages increase at a decreasing rate with experience and job tenure, reflecting an inverted U-shaped profile of earnings as experience and job tenure increase. The number of worked hours has a positive impact on wages for both men and women, but compared to men, women gain more from working more than the average. Part-time workers receive lower wages, particularly when they are women, and wages are significantly higher in the public sector than in the private sector. As to occupations, wages increase monotonically along the job ladder for men. This is true also for women but this effect is significant beyond the employee category only. Wages also increase with the firm’s size in all the regressions and with social insurance affiliation. In fact, as we said before, this last variable may be used as a proxy of the informal sector. An individual without social insurance has a good chance to be employed in the informal sector where the wages are lower, for both men and women. Regional dummies are in general not significant except for Marmara
(Istanbul) and the Central Anatolia (Ankara) where the coefficients are significant and positive, implying that wages in these areas — where the main cities are located — are higher than elsewhere.
The average logarithm of the monthly wages computed from our sample are 5.9550 for men and 5.6126 for women. The value of the wage differential in logarithmic terms is 0.34244. The estimated average monthly wage of the salary workers is 442 for males and 352.8 for females, that is a gender wage gap equal to 25.2% in favor of men. We now have to find out whether these gender differences in earnings reflect productivity enhancing characteristics such as education, or are unexplained, that is are related to discrimination practices.
4.2
Wage decompositions
Following Oaxaca (1973) and Blinder (1973) it is usual to write the average wage gap as follows : ln¡W¯m/ ¯Wf ¢ = ¯X0 f ³ ˆ βm− ˆβf ´ | {z } Discrimination + ˆβm ¡ ¯ Xm− ¯Xf ¢0 | {z } Endowments (2)
where ¯W denotes the geometric mean wage evaluated by the earning equation (1), ¯X are the average characteristics and ˆβ the estimated returns on these characteristics, the indices m and f denoting male and female variables respectively. The first term of decomposition (2) represents the differences in returns on male and female characteristics respectively, that is the discrimination component, the second one the differences in the observed characteristics of men and women — the endowment component.
The Oaxaca-Blinder’s method has been subject to criticisms on the point that it is based on the endowment prices of one of the two genders — the male here and in most applications — thereby intro-ducing a potential dissymmetry in the effects depending on which gender is considered as the reference. Actually, this problem — known as the index-problem — lies in the choice of the wage structure that is to be regarded as the non-discriminatory standard. Indeed, and more generally, given (1), the gender wage gap could be decomposed in the following way :
ln¡W¯m/ ¯Wf ¢ = ¯Xm0 ³ ˆ βm− ˆβ∗ ´ + ¯Xf0 ³ ˆ β∗− ˆβf ´ | {z } Discrimination + ˆβ∗¡X¯m− ¯Xf ¢0 | {z } Endowments (3)
where ˆβ∗ is an estimated non-discriminatory wage structure. The first two terms in (3) correspond to
the discrimination component — the first term representing pure favoritism toward males and the second one pure discrimination against females —, the third term is the endowment component. A choice has to be made regarding ˆβ∗. Oaxaca (1973) first proposes either the current male structure ˆβ
m(which leads to
the decomposition described in equation 2), or the current female wage structure ˆβf, suggesting that the
result would bracket the ”true” non-discriminating wage structure. But other decompositions have been proposed in the literature. Reimers (1983) assigns identical weights to both men and women. Cotton (1988) argues that the non-discriminatory structure should approach the structure that holds for the larger group and thus proposes using as weights the relative group sizes in the sample. A more general method is provided by Neumark (1988) and Oaxaca and Ransom (1994) who uses the wage structure obtained by OLS estimates on the pool sample as the non-discriminatory standard.
Table 9 presents our results for four alternative decompositions (see Appendix 3, Figure 17 for confi-dence intervals). The first (D1) and the third (D3) are the standard Oaxaca-Blinder decompositions using
respectively the current male and female wage structures as the non-discriminating norm, the second one (D2) is the one proposed by Reimers using the intermediate norm and the fourth and last one (D4) is the one proposed by Oaxaca and Ransom. The results appear clearly sensitive to the decomposition method used.
Tab. 9 – Gender Wage Gap Decompositions∗
Full-scale Wage Regressions
Decomposition method Endowment Discrimination
D1 Oaxaca-Blinder Male 42.3% 57.7%
D2 Reimers 31.8% 68.2%
D3 Oaxaca-Blinder Female 21.3% 78.7%
D4 Oaxaca-Ransom 54.0% 46.0%
∗ All components are significant at the 5% level, see Appendix 3 for details.
Not surprisingly, the discrimination component is the highest in the Oaxaca-Blinder decomposition using the female wage structure as reference, as it amounts to 78.7% of the gender wage gap, against 57.7% when using the male structure. The Reimers decomposition leads to an intermediate result of 68.2%, although the Oaxaca-Ransom decomposition, that uses the pool wage structure as the non discriminatory standard, leads to assign a lower part of the gender wage gap to discrimination as the remuneration effect is lessened to 46%. So, the discrimination component, depending on the decomposition, ranges from 46 to 79% of the estimated gender wage gap.
None of these decompositions is better than the others, each of them referring to a peculiar vision of discrimination. Using for example the estimated male wage structure as the norm assumes that all of the discrimination against women is attributable to favoritism toward men, whereas using the estimated female wage structure assumes that all of the discrimination against women is pure discrimination. It is generally accepted that the current female wage structure is not a good choice as the non discriminatory standard. As pointed by Oaxaca and Ransom (2003), in terms of practical application for correcting gender wage inequities, the use of the female structure as the equity standard presents potential problems of implementation associated with legal restrictions and employee moral. Ginther and Hayes (2003) point out that men are the usual comparison group in legal proceedings concerning gender discrimination and consequently cast doubts on the fact that a pooled approach, obtained from a weighted average of the male and female wage structures as in D3 or D4, could be used in legal cases concerned with equal opportunities for women and men. The diversity of wage gap decompositions found in the literature makes comparisons difficult and from this point of view is regrettable. We follow Ginther and Hayes (2003) in considering that operational choice criteria should weigh in this debate, criteria that lead to favor the traditional Oaxaca-Blinder decomposition using the male norm. But our concern here being also comparability, and given that Meurs and Ponthieux (2005) chose to use in their study of the EU countries the Oaxaca and Ransom methodology, we will systematically report in the following this other measure of discrimination.
If the wage decomposition into endowment and discrimination components depends on the choice of the non-discriminating norm, it also crucially depends on the choice of explanatory variables included in the earning equations. Typically, the greater the number of control variables is, the smaller the remu-neration effect will be and thus the part of the gender gap affected to discrimination (Sofer, 1995). In
fact, when controlling by variables related to the job occupied and geographical localization, one defines discrimination as difference in remuneration between individuals of identical characteristics occupying the same job and living in the same area. By doing so, one neglects the fact that typically men and women have not got the same access into jobs because of segregation phenomena and that segregation practices may be more or less pronounced depending on occupations, sectors and regions, so the effects of these types of barriers as sources of discrimination ar eliminated. As a result, we are likely to underestimate the effects of discrimination when adding regressors in Mincer equation beyond the human capital variables. One way to evaluate the scale of segregation against women is thus to estimate another set of equations that do not control for occupation, industry, class of worker, type of labor contract and region. With this set of regressions that we shall labeled, following Oaxaca (1973), the personal characteristics wage regressions, we obtain the results presented in Table 10 (see Appendix 2, Figures 15 and 16 for estimation results and Appendix 3, Figure 18 for details on decompositions).
Tab. 10 – Gender Wage Gap Decompositions∗
Personal Characteristics Wage Regressions
Decomposition method Endowment Discrimination
D1 Oaxaca-Blinder Male 22.5% 77.5%
D2 Reimers 09.4% 90.6%
D3 Oaxaca-Blinder Female -03.8% 103.8%
D4 Oaxaca-Ransom 28.4% 71.6%
∗ All components are significant at the 5% level, see Appendix 3 for details.
Actually, discrimination increases sharply as it ranges now, depending on the decomposition, from 71.6% to 103.8% (compared to the 46%-78.7% range obtained from the full-scale wage regressions). Consequently, segregation against women is likely to be an important phenomenon in the Turkish labor market, and an essential component of the gender labor market discrimination prevailing in this country.
Tab. 11 – Decomposition of the Endowment Component
Casual Factor Amount Amount Amount
attributable attributable attributable
Variable to Endowments to Coefficients
Education -4.2 -6.8 8.6 Primary School 3.2 1.3 1.9 Middle School 1.9 1.0 0.9 High School 2.9 -0.2 3.1 Bachelor degree -1.2 -1.8 0.6 Over -5.0 -7.1 2.1 Experience 26.8 9.5 17.3 Experience 44.7 21.1 23.6 Experience squarred -17.9 -11.6 -6.3 Job Tenure 5.8 4.4 1.5 Tenure 8.9 8.5 0.5 Tenure squarred -3.1 -4.1 1.0 Working Time -56.3 2.7 -59.0 Hours Worked -57.2 2.1 -59.3 Part-time Work 0.9 0.6 0.3 Rural area -0.5 -0.2 -0.3 Region of residence -4.8 -1.2 -3.7 Aegean -1.0 0.0 -1.0 Mediterranean 0.0 0.0 -0.0 Marmara -3.3 -1.3 -1.9
South East Anatolia -0.1 0.1 -0.2
Central Anatolia -0.5 0.2 -0.7
Eastern Anatolia 0.1 0.1 0.1
Labor Contract Stability 2.6 1.8 0.9
Permanent 1.2 -0.5 1.8 Fixed-term 1.4 2.3 -0.9 Occupations -3.0 -2.5 -0.3 Managers, officials -3.6 -2.3 -1.2 Professionals -1.5 -1.0 -0.5 Employees -0.2 -0.2 0.1 Skilled Workers 2.3 1.0 1.3 Sectors -11.2 5.1 -16.5 Industry -0.9 0.2 -1.1 Construction 2.0 2.0 -0.0
Trade and Repair -1.5 0.1 -1.6
Hotels and Restaurants -0.4 0.0 -0.4
Transport and Communication 1.1 1.2 -0.2
Financial services, Real Estate and Business Activities -0.9 -0.4 -0.6
Public Administration, Education, Health and Social Work -5.6 1.0 -6.6
Other Services -5.0 1.0 -6.0 Public sector 1.6 0.3 1.3 Firm’s Size 1.4 -0.5 1.9 Social Insurance -7.9 1.3 -9.2 Union Membership 0.6 0.4 0.2 Number of Children 3.2 -0.2 3.4 Subtotal -39.9 E=14.5 C=-54.4
Shift Coefficient U=74.2
Total R=34.2 D=C+U=19.8
A + sign indicates an advantage for males ; a − sign an advantage for females.
A closer examination of the results obtained with the full-scale regressions enables us to say more about the part played by each subset of variables into the average non-discriminatory endowment effect denoted
E in Table (11) that refers to the traditional Oaxaca-Blinder decomposition (D1). The E component related to the observed wage gap denoted R in Table (11) gives the endowment component reported in Table(9). The decomposition of the endowment effect by components presented in Table (11) reveals that even though female salary workers have, on average, inferior endowments compared to males, this is not true concerning education attainments since educational variables actually accounts for a 6.8% differential in favor of women. The results of the regressions further show that this advantage in endowments is accounted for by the average higher level of schooling of women among the highly educated salary workers. Actually, we saw in section 2.2 that the female salary workers are in average more educated than men at the high levels of education. Interestingly also, the distribution of female salary workers across occupations give them an advantage in term of endowments due to the fact that, compared to men, they are more concentrated at the top of the job ladder. By contrast, the distribution of salary workers across industries favors men. But the main factor explaining the inferior endowments of female salary workers is their lack of experience and job tenure. Interestingly, this disadvantage does not come from their level of experience and tenure on job — as in terms of years of potential experience and tenure women get the advantage —- but from the associated quadratic terms, indicating that the main advantage for male salary workers is their more concave experience-wage and tenure-age profile. The female inferior endowments are also explained by a lower working time and by more precarious labor contracts.
The decomposition of the discrimination term is not interpretable in the same way as shown by Jones (1983). In fact, this latter demonstrates that the Blinder (1973) decomposition of the residual discrimination term (D), into two components — the part due to difference in the coefficients (C) and the part due to the difference between the intercepts (U) — is arbitrary and thus uninterpretable. Indeed, this decomposition cannot be uniquely determined because the value for the difference in intercepts depends on measurement decisions, in particular the choice of the omitted category for the dummy variables and the treatment of certain variables as continuous or not. Consequently, to go further in our analysis of discrimination in Turkey, we compute the same decompositions for different sub-populations.
Results are reported in Table (12) for the different occupations. The wage gap decreases monotonically along the job ladder, from .743 in logarithms for the unskilled workers to .138 for the senior managers, but it is not the case for discrimination which appears to be particularly strong at the top for the senior managers (from 74.6% in D4 to 91.9% in D1), and at the bottom for the skilled workers (from 48.9% in D4 to 64.6% in D1).
Tab. 12 – Wage Gap Decompositions by Occupations
Oaxaca-Blinder Oaxaca-Ransom
Deomposition Decomposition
Wage gap Endowments Discrimination Endowments Discrimination (% of wage gap) (% of wage gap) (% of wage gap) (% of wage gap)
Total of the wage-earners 0.342 42.3 57.7 54.0 46.0
Senior managers 0.138 8.1 91.9 25.4 74.6
Technicians and associate 0.202 90.9 8.1 80.4 19.6
Clerks and service Workers 0.313 65.4 34.6 70.4 29.6
Skilled workers 0.599 35.4 64.6 51.1 48.9
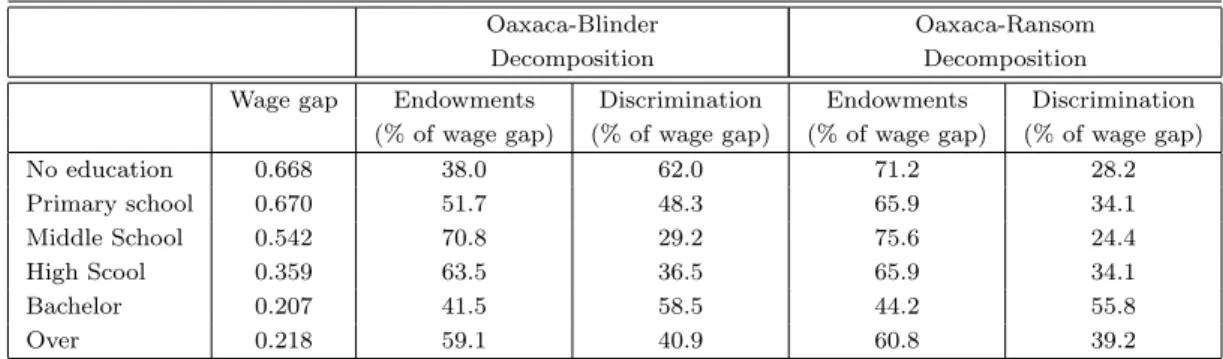
We have also estimated the wages for men and women by level of educational attainment. Results are reported in Table (13) and show that if the wage gap decreases with higher levels of education (from .668 in logarithms for the non graduate salary workers to .218 for the university graduate salary workers), there is no clear relation between education and discrimination except that education does not protect women against discrimination, as even for the highest levels of education (over bachelor), discrimination still amounts to about 40% of the wage gap.
Tab. 13 – Wage Gap Decompositions by Educational Attainments
Oaxaca-Blinder Oaxaca-Ransom
Decomposition Decomposition
Wage gap Endowments Discrimination Endowments Discrimination (% of wage gap) (% of wage gap) (% of wage gap) (% of wage gap)
No education 0.668 38.0 62.0 71.2 28.2 Primary school 0.670 51.7 48.3 65.9 34.1 Middle School 0.542 70.8 29.2 75.6 24.4 High Scool 0.359 63.5 36.5 65.9 34.1 Bachelor 0.207 41.5 58.5 44.2 55.8 Over 0.218 59.1 40.9 60.8 39.2
We saw in section 2.2 that contrasts between rural and urban areas are important in Turkey concerning the structure of the labor market. Separate estimates on the rural and urban populations show that the urban environment is not particularly favorable to the female salary workers as, if the wage differential is lower in the cities, discrimination is slightly higher (Table 14).
Tab. 14 – Wage Gap Decompositions by areas
Oaxaca-Blinder Oaxaca-Ransom
Decomposition Decomposition
Wage gap Endowments Discrimination Endowments Discrimination (% of wage gap) (% of wage gap) (% of wage gap) (% of wage gap)
Rural 0.588 48.1 51.9 65.4 34.6
Urban 0.311 41.4 58.6 52.1 47.9
Examination to the age factor shows that age does protect against discrimination (Table 15). If the gender wage gap increases monotonically with age, from 0 to .71 in logarithms, the part attributed to discrimination is the lowest for the oldest, as it lessens from more than 167% of the wage gap to 39% in D1 and from 133.6 to 26.5% in D4. This result corroborates the possibility of statistical discrimination against young women, employers anticipating that they will leave the labor market once married and mothers. Consequently, when restricting to the population studies by Meurs and Ponthieux of those aged 25-55 working at least 15 hours a week, we find a wage differential equal to 0.256 in logarithms, that is a wage gap equal to 13.2% in favor of men, and a discrimination component raising to 67.9% in D1 and to 84% in D4.
Tab. 15 – Wage Gap Decompositions by Age Categories
Oaxaca-Blinder Oaxaca-Ransom
Decomposition Decomposition
Wage gap Endowments Discrimination Endowments Discrimination (% of wage gap) (% of wage gap) (% of wage gap) (% of wage gap)
[15 − 64] 0.342 42.3 57.7 54.0 46.0 [15 − 25[ 0.00 – – – – [25 − 35[ 0.122 −67.2 167.2 −33.6 133.6 [35 − 45[ 0.396 25.8 74.2 45.2 54.8 [45 and over[ 0.709 61.1 38.9 73.5 26.5 [25 − 55] 0.256 16.0 84.0 32.1 67.9
Decompositions by industries show that discrimination is particularly high in the agricultural sector and in the Public Administration, Education, Health and Social Work category, two sectors where women are over represented. But if in the former, the wage differential is particularly high (.679 in logarithms), in the latter it is particularly low (.112).
Tab. 16 – Wage Gap Decompositions by Industries
Oaxaca-Blinder Oaxaca-Ransom
Decomposition Decomposition
Wage gap Endowments Discrimination Endowments Discrimination (% of wage gap) (% of wage gap) (% of wage gap) (% of wage gap)
Agriculture 0.679 31.2 68.8 46.7 53.3
Industry 0.513 46.6 53.4 59.8 40.2
Construction 0.023† – – – –
Trade and Repair 0.241 50.1 41.9 63.9 36.1
Hotels and Restaurants 0.083† – – – –
Transport and Communication 0.063† – – – –
Fin. and Business activities 0.240 39.2 60.8 47.1 52.9
Public Adm, Edu. Health and Social 0.112 -8.0† 108.0 14.3† 85.7
Other services 0.518 71.4 28.6 89.0 11.0
†Non significant at the 5% level.
It is then interesting to estimate discrimination by opposing public and private sectors. The results, given in Table 17, show that even though the wage differential is small in the public sector, discrimination is very high as it ranges from 120 to more than 400% depending on decompositions. This result contrasts with the one obtained on developed countries where generally12 the public sector is more favorable to
women (see Meurs and Ponthieux, 2005). As to informality, surprisingly, our results do not show the informal sector as unfavorable to women. On the contrary, discrimination happens to be higher for the socially insured salary workers. By contrast, the union membership lessens the discrimination component of the gender gap.
Tab. 17 – Wage Gap Decompositions by classes of workers
Oaxaca-Blinder Oaxaca-Ransom
Decomposition Decomposition
Wage gap Endowments Discrimination Endowments Discrimination (% of wage gap) (% of wage gap) (% of wage gap) (% of wage gap)
Public 0.080 -20† 120 -337.5 437.5 Private 0.427 44.0 56 58.3 41.7 Insured 0.096 -26.0 126.0 -21.9 121.9 Not Insured 0.569 45.5 54.5 63.4 36.6 Unionized 0.107 50.5 49.5 41.1 58.9 Not Unionized 0.339 36.9 63.1 51.0 49.0
†Non significant at the 5% level.
At last, concerning regions, the decompositions shows that discrimination is higher in Eastern Turkey (Table 18). This is not surprising as Turkey is one country seriously affected by problems resulting from regional differences in socio-economic conditions, which are progressively worse as one moves from West to East, particularly for women. According to Ilkkaracan (1999), Eastern Turkey can at best be characterized as a semi-feudal, traditional, agricultural economy. The region has a multi-ethnic character (besides Kurds and Turks, which are the largest ethnic groups, the region also includes Zaza, Azerbaijanis, Arabs, Christians who speak Syriac language and others) and women are confronted with a variety of customary and religious practices, which seriously limit their rights.
Tab. 18 – Wage Gap Decompositions by Regions
Oaxaca-Blinder Oaxaca-Ransom
Decomposition Decomposition
Wage gap Endowments Discrimination Endowments Discrimination (% of wage gap) (% of wage gap) (% of wage gap) (% of wage gap)
Marmara 0.321 42.7 57.3 57.3 42.7 Aegean 0.342 45.3 54.7 55.8 44.2 Mediterranean 0.499 56.1 43.9 43.9 56.1 Black Sea 0.412 47.3 52.7 52.4 47.6 C. Anatolia 0.239 22.1 77.9 41.8 58.2 E. Anatolia 0.132† -50.0† 150 -18.1† 118.1 SE. Anatolia 0.303 26.7 73.3 42.1 57.9
†Non significant at the 5% level.
The estimates of wages presented so far are based on the hypothesis of an equal access for men and women to salaried employment. However, as shown in section 2.2, the probability to belong to the salaried population differs for men and women since women are clearly under represented among salary workers. The process of selection into wage-earning jobs probably differs also since only the most skilled women are found there, what is not the case for men. Thus, it seems hard to consider the male and female salary
populations as random samples of the male and female working age populations. Consequently, selection may be a problem resulting in biased estimates of wages and as a result of wage discrimination. That is why we propose in the next section to reestimate the wage equations using the Heckman two-steps procedure in order to correct for potential selectivity bias.
5
Selection into salaried employment
Selectivity bias is a problem that arises when the sample used is not randomly selected. In our case, the wages we observe are the wages of individuals who chose to work as wage-earners — a decision based on several factors, some of which might affect the wage itself. Consequently, the coefficients obtained in the preceding simple regressions may capture not only the effect of the dependent variables on the wage, but also their effect on the participation decision into salaried employment. Selectivity bias might be found at different stages of the employment process : at the stage of joining the employed labor force or when an employment status is chosen. To solve the potential selectivity problem we follow Meurs and Ponthieux (2005) and introduce a selection equation referring to the decision of being a salaried worker rather than remaining inactive. We saw in the first section that in our sample, economically inactive people are mainly women. Among the population of working age from which are excluded those who can not find a job, those who are not in position to apply for a job (students, old age pensioners, etc), and those who are not available for a salary job, that is the employers, the self-employed and the unpaid family workers, 95.3% of the men are salaried workers, compared with only 15.4% of women.
The selectivity correction consists in estimating via a Probit model a latent variable that is a function of individuals’ characteristics and expresses their propensity to hold a salaried job rather than being purely inactive. This estimation provides us with an additional regressor (the inverse Mills ratio - IMR) to introduce into the earning equation. This variable enables us to capture the effect on wages of selection into the salaried employment. With a standard earning equation, we therefore have a model of the following form :
LnW = βX0+ θλ0+ u
where λ is an estimator of the inverse Mills ratio and θ is the coefficient indicating the effect of selection on the wage.
To identify the participation into salaried employment, we use individual characteristics (age13, age
squared, marital status and a dummy for polygamy14), households’ demographics (having children,
ha-ving children aged between 0 and 6 years, number of children, size of the household) and household’s wealth indicators (housing owner, logarithm of household’s incomes other than wages) as instruments (see Appendix 4, Figure 19 for a detailed list of the regressors used in the selection equation). These variables are expected to have a direct impact on occupational choice but no direct impact on the actual wage earned. Results of the estimates are presented in Appendix 4, Figures 20 and 21.
Age and age squared have the expected positive and negative signs respectively. The coefficients are significant in all specifications implying that the probability of working as a salary worker increases with 13The idea here is that what matters for wages is how many years one is in the labor market as for the probability of
entrance into salaried employment, age might be more relevant than work experience because of potential discrimination at the entrance level against very young or old applicants or cohort effect that might be at work.
age but at a decreasing rate, reflecting an inverted U-shaped profile with age. High levels of education increase the probability of being a salary worker rather than being inactive for both men and women. For women, a level of education higher than the primary school strongly increases the probability of being a wage earner.
The marital status has an important impact on the participation in the salaried employment but differs with gender as the coefficient of the variable ”married” is significantly positive for men and significantly negative for women. Married men are more likely to work than their unmarried counterparts, which could be explained by the fact that men are typically the main wage earner in the family. On the contrary, married women are less likely to be salaried-worker than their unmarried counter-parts and than men. This probably reflects a higher reservation wage for married women resulting for access to their spouses’ income, and also because of difficulties of coping with wage employment owing to the burden of their domestic responsibilities and of traditions. As to the polygamy variable, it does not significant affect the participation decision into salaried employment.
While the coefficient of the household’s size is significant and negative for both sexes, the number of children has a significant positive impact on the probability of being a wage-earner, but the presence of small children has a negative impact on women’s participation, while it is not significant for men. These results corroborate the interpretation as men being the main wage earner for the household and women having to care for children.
At last, the variable ”housing owner” appears to be significant and negative in all the regressions, being owner of one’s housing reduces the probability to be a salaried worker rather than inactive. The variable ”household’s other incomes” play a distinctive role for men and women as its coefficient is significantly positive for women but negative for men.
Once wage estimates corrected for selectivity bias, we compute the Oaxaca-Blinder’s type decompo-sitions on the corrected wage gap. The difference between the two gaps (without and with selectivity correction) may be interpreted as the part of the observed wage gap due to selectivity. Neuwman and Oaxaca [1998] discuss the question of the affectation of the selectivity term to the explained and unex-plained components. We choose here to treat selectivity as a separate component. This is the simplest approach, as it requires no a priori hypotheses about whether selectivity has more influence on individual characteristics or on the returns on theses characteristics. We then obtain an equation of the following form : ln¡W¯m/ ¯Wf ¢ = ¯Xm0 ³ ˆ βm− ˆβ∗ ´ + ¯Xf0 ³ ˆ β∗− ˆβf ´ | {z } Discrimination + ˆβ∗¡X¯m− ¯Xf ¢0 | {z } Endowments − ³ ˆ θmˆλm− ˆθfλˆf ´ | {z } Selectivity (4)
where ˆβ∗ is the non-discriminating norm.
Results are presented in Table (19) (see Figure 22 in Appendix 4 for confidence intervals). Selection contributes to slightly reduce the gender wage gap as it now amounts in logarithms to .334 compared to .342 without selectivity correction. For both men and women, the coefficient of the IMR is negative and significant. As the IMR is negatively related to the probability to participate into salaried employment, these results show that for both genders, those who are the more likely to be wage-earners are also the more likely to earn high wages. So, the individuals actually employed as salaried workers are the higher earning potential ones when compared with the reference population, and this is particularly true for men