HAL Id: hal-02917019
https://hal.archives-ouvertes.fr/hal-02917019
Submitted on 19 Aug 2020
HAL is a multi-disciplinary open access
archive for the deposit and dissemination of
sci-entific research documents, whether they are
pub-lished or not. The documents may come from
teaching and research institutions in France or
abroad, or from public or private research centers.
L’archive ouverte pluridisciplinaire HAL, est
destinée au dépôt et à la diffusion de documents
scientifiques de niveau recherche, publiés ou non,
émanant des établissements d’enseignement et de
recherche français ou étrangers, des laboratoires
publics ou privés.
Two Records of Relative Paleointensity for the Past 4
Myr
Jean-Pierre Valet, Anojh Thevarasan, Franck Bassinot, Tatiana Savranskaia,
Naoufel Haddam
To cite this version:
Jean-Pierre Valet, Anojh Thevarasan, Franck Bassinot, Tatiana Savranskaia, Naoufel Haddam. Two
Records of Relative Paleointensity for the Past 4 Myr. Frontiers in Earth Science, Frontiers Media,
2020, 8, pp.148. �10.3389/feart.2020.00148�. �hal-02917019�
doi: 10.3389/feart.2020.00148
Edited by: Edgardo Cañón-Tapia, Ensenada Center for Scientific Research and Higher Education, Mexico Reviewed by: Xixi Zhao, University of California, Santa Cruz, United States Simo Spassov, Royal Meteorological Institute of Belgium, Belgium *Correspondence: Jean-Pierre Valet valet@ipgp.fr
†Present address:
Franck Bassinot and Naoufel Haddam, Laboratoire des Sciences du Climat et de l’Environnement (LSCE), Orme des Merisiers, Saint-Aubin, France Specialty section: This article was submitted to Geomagnetism and Paleomagnetism, a section of the journal Frontiers in Earth Science Received: 09 February 2020 Accepted: 21 April 2020 Published: 19 May 2020 Citation: Valet J-P, Thevarasan A, Bassinot F, Savranskaia T and Haddam N (2020) Two Records of Relative Paleointensity for the Past 4 Myr. Front. Earth Sci. 8:148. doi: 10.3389/feart.2020.00148
Two Records of Relative
Paleointensity for the Past 4 Myr
Jean-Pierre Valet*, Anojh Thevarasan, Franck Bassinot†, Tatiana Savranskaia and
Naoufel Haddam†
Institut de Physique du Globe de Paris, Université de Paris, Paris, France
We performed new high-resolution magnetic measurements of sedimentary cores from the east northern Pacific ODP Site 1021 and the East equatorial Pacific ODP Site 851. ODP Site 1021 is characterized by a high clay content with less than 10% carbonates in contrast to ODP Site 851 which is highly carbonated (% CaCO3 of
at least 70%). The time scale of both records was obtained by orbital tuning of sediment density and/or susceptibility variations and whenever possible tested against the reversal positions. Previous magnetic studies at both sites have been concentrated on the past 1.2 Ma using U-channels. We extended this period and performed high resolution and detailed studies of 4210 sediment levels that cover the past 4.4 Ma. Natural remanent magnetization (NRM) and anhysteretic remanent magnetization (ARM) were both stepwise demagnetized by alternating fields. The new results confirm the magnetostratigraphy derived from the shipboard measurements but improve the definition of the polarity intervals and identify zones or events that were either unclear or hidden by unremoved secondary components. Studies of relative paleointensity were conducted following the standard rules and yielded determinations with the exception of intervals that were either too weakly magnetized or disturbed. The evolution of relative paleointensity displays similar behavior during the reversal periods at both sites, but the two curves show strikingly different patterns outside the transitional intervals that are characterized by the largest intensity changes. Spectral analyses revealed that magnetic concentration was strongly dependent on paleoenvironmental components at ODP Site 1021 which likely affected the results of relative paleointensity. It is assumed that the absence of any long-term geomagnetic trend during the stable polarity intervals at this site results from the interplay between climatic and geomagnetic factors. The large amplitude of field intensity decrease during the reversal periods dominates all other factors and is thus visible over the entire record.
Keywords: paleointensity, geomagnetic field, reversals, magnetization, paleomagnetism
INTRODUCTION
Records of relative paleointensity from sedimentary sequences make a substantive contribution to our knowledge of the geomagnetic field intensity in the past (see e.g., Meynadier et al., 1992; Channell et al., 1997, 2008, 2016; Guyodo and Valet, 1999; Yamazaki, 1999; Laj et al., 2000; Stoner et al., 2000; Horng et al., 2003; Valet et al., 2005; Yamazaki and Oda, 2005;
feart-08-00148 May 18, 2020 Time: 15:3 # 2
Valet et al. Relative Paleointensity During 4 Myr
Yamamoto et al., 2007; Yamazaki and Kanamatsu, 2007;
Suganuma et al., 2008; Inoue and Yamazaki, 2010; Macri et al., 2010; Mazaud et al., 2015). However, very few data provide a continuous record of the field changes prior to the past two million years because data acquisition is faced with a compromise between achieving an optimum temporal resolution and investigating as long a duration as possible. In fact, a 4–5 Ma-long period may somehow represent a higher limit to paleomagnetic records. In deep-sea basins, sedimentary sequences accumulate at a few centimeters by 1,000 years. Assuming a deposition rate of ∼2 cm/ka, a 4 Ma-long sequence corresponds to a 80 meter-thick sedimentary column. Below this depth, it is common that sediments get too much indurated making it impossible or extremely difficult to perform continuous sampling. Notwithstanding, such long records provide essential information about the field evolution across geomagnetic reversals, the averaged field intensity at different periods, and the frequency of intensity lows that are usually associated with directional excursions or aborted reversals as well as other aspects of magnetic field behavior.
In this manuscript, we re-analyze and extend the paleointensity records from two ODP Sites in order to provide a better description of the field evolution during at least the past 4 Ma. The sediment from ODP Site 851 was previously studied in detail over the past 1.2 Ma (Valet and Meynadier, 1993). As no continuous sampling was allowed by the former ODP rules below this level, the results covering the period 1.2–4.4 Ma were tentatively combined with the shipboard magnetic measurements of sediment from ODP Sites 848 and 852 (Meynadier et al., 1995) and subsequently tested against the measurements of 260 single samples. The second dataset comes from ODP Site 1021 and was also previously studied in detail for the period covering the past 1.4 Ma (Guyodo et al., 1999). The deposition rate between 2 and 4 cm/ka at these two sites is appropriate to study the long evolution of the dipole field over several million years.
LITHOLOGY AND SAMPLING
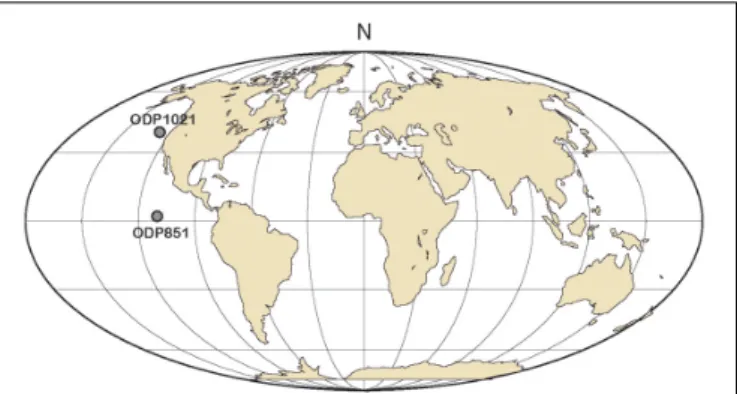
ODP Site 851 (2◦
0.46.2230
N–110◦
34.3080
W; Figure 1) is located near the northern limit of the westward-flowing South Equatorial Current (SEC) and the southern limit between the North Equatorial Countercurrent and the SEC which migrates seasonally. The upper 87 mcd (meter composite depth) are dominated by foraminifer nannofossil ooze with a high percentage of CaCO3 showing little variability (76 ± 8%), high
water content, moderate susceptibility decreasing with depth and low GRAPE density values. The sediments contain 30–80% nannofossils, 10–40% foraminifers, 2–30% radiolarians, 2–20% diatoms, and 0–10% clay. We relied on the composite depth scheme for ODP Site 851 which has been published in the ODP Leg 138 Scientific Results (Shackleton et al., 1995) to perform a continuous sampling below the upper 20 m that have been previously investigated by U-channel measurements (Meynadier et al., 1995). Including the U-channels and single samples that were previously taken in the cores from Hole D, the successive samplings cover 80 m of sediment thickness. A total of 710
FIGURE 1 | Geographic map showing the positions of ODP Sites 851 and 1021.
single samples were taken from Hole B (cores 04H to 08H), Hole C (cores 03H, 04H, 05H, 07H, and 8H) and Hole E (cores 2H, 03H, 07H, and 08H). To those, were added 8 U-channels from Hole B (cores 03H, 06H, and 07H) and 7 from Hole C (cores 03H and 04H). ODP Site 1021 (39◦ 5.2460 N–127◦ 46.9820 W; Figure 1) is located ∼100 km south of the Mendocino Fracture Zone and 360 km from the California coast on an abyssal hill at 4213 m of water depth. Sediment lithology is dominated by alternating sections of clays with nannofossil (Lyle et al., 1997). A first unit in the upper 9 mcd is composed of light grayish olive clay. The late Pleistocene (from 9 to 130 mcd) which covers most of the sampled interval is dominated by clay with nannofossils and nannofossils ooze with clay. There is no large lithological change with possible consequences for the sediment magnetization. The organic carbon content is very low (0.06 wt%) and calcium carbonate varies between 0 and 10 wt% averaging at circa 8% wt%. Diatoms, foraminifers, and radiolarians are minor components. As for ODP Site 851, we relied on the composite depth scheme published in the ODP volume 167 to conduct the sampling of the cores taken at ODP Site 1021. Sampling was performed within the interval 46 to 146 mcd to complete the upper 45 m that have been previously measured using U-channels. Below this depth, sediment induration was not appropriate for U-channels and many sections were previously sampled for other purposes. We took 378 samples from Hole C and 2092 samples from Hole D.
MAGNETIC SUSCEPTIBILITY AND
DEPTH-TIME CORRELATION
At ODP Site 851, volume magnetic susceptibility (K) was measured on all samples and every two centimeters in U-channels. These new measurements complete the previous shipboard dataset that was performed on half-cores at 2 or 4 cm intervals, therefore with relatively low resolution. The depth-time conversion was initially derived from characteristic events in the Grape density record (Shackleton et al., 1995). We only refined the upper part (last 1 Ma) of the age-model (Supplementary
Table S1) by visually tuning the ODP 851 record of stable oxygen isotope ratio (δ18O) (Ravello and Schakleton, 1995) to
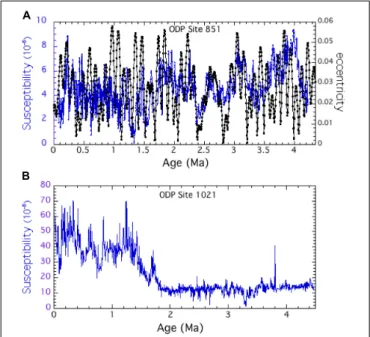
the LR04 reference record (Lisiecki and Raymo, 2005). The successive variations of low-field susceptibility as a function of time (Figure 2A) are quite similar to those of the previous measurements but with better resolution. A striking feature is an apparent phase relationship between the susceptibility and the changes in Earth’s orbit eccentricity that are shown along in the same plot (Figure 2A;Laskar et al., 2011). Little mismatches between the two parameters may result from uncertainties in the time scale but are more likely generated by the complexity and diversity of factors that contribute to the susceptibility signal. The relationship between susceptibility and eccentricity may imply an imprint of environmental factors on the magnetic record. More specifically, a modulation of magnetic concentration by climatically related parameters could have some impact on relative paleointensity if it dominates over the variability linked to the field itself.
Susceptibility measurements were also performed on all discrete samples and U-channels from ODP Site 1021. The susceptibility variations are characterized by a very sharp drop from 45 to 58 mcd (Figure 2B). We will scrutinize whether this large decrease of the magnetic content have consequences for relative paleointensity. We used the depth-time correlation proposed by Guyodo et al. (1999) for the past 0.9 Ma. For the period between 0.9 and 1.4 Ma we refined the model using the link between the present measurements of magnetic susceptibility and the oxygen isotope record (Lisiecki and Raymo, 2005). For the previous period, we relied on the present magnetostratigraphy and used the successive reversal depths as tie points (Supplementary Table S1), which, given their relatively high frequency, provided a reasonably good framework. Once plotted in terms of age, it appears that the
FIGURE 2 | (A) Evolution of low-field susceptibility compared to the changes in the Earth’s orbital eccentricity at ODP site 851 as a function of time. (B) Evolution of low-field susceptibility at ODP site 1021.
sharp susceptibility drop took place between 1.6 and 1.2 Ma and thus preceded the progressive shift of the mid-Pleistocene from climatic changes that were dominated by obliquity-related, 41 kyr cycles to larger amplitude, glacial-interglacial cycles dominated by ∼100 kyr oscillations. During the upper Pleistocene, susceptibility variations appear to be modulated by those ∼100 kyr oscillations.
Magnetic Studies
The natural remanent magnetization (NRM) of all samples and U-channels from both sites was measured using a horizontal 2G cryogenic magnetometer in the shielded room at the Institut de Physique du Globe de Paris. Batches of 10 samples positioned along the length of the 1.6 m long tray holder were measured every 1 mm. The successive sample positions were identified from their characteristic bell-shaped response curves on each axis and the final results were calculated after taking into account the integration of the signal on both sides of each magnetization peak. This technique provides the advantage of not stopping the tray motion as measurements were processed in a continuous way at very low speed. The same protocol was followed for U-channels, but in this case the successive 1 mm measurements were averaged out over 2 cm large intervals.
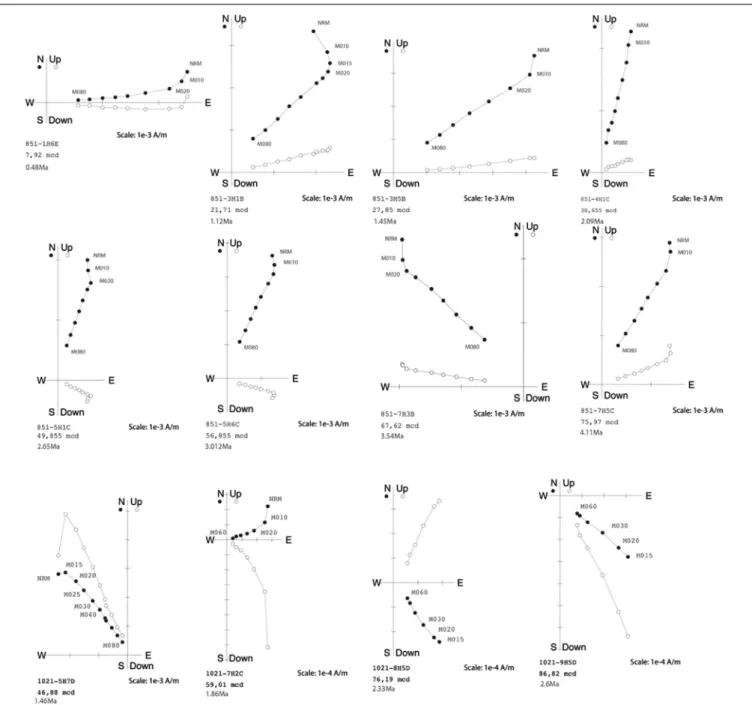
All samples and U-channels were stepwise demagnetized every 5 mT from 5 to 80 mT using the in-line alternating field (af) demagnetization coils. The results obtained after each demagnetization step were compiled every 2 cm in order to generate the corresponding demagnetization diagrams. Typical demagnetization diagrams are shown in Figure 3 for both sites. The characteristic directions were calculated using the standard technique (Channell, 1999). In most cases, the fit was anchored to the origin. Diagrams with fitting lines passing far away from the origin were not taken in consideration. We did not observe direct evidence for drill string re-magnetization which, if present, involved the same coercivity range as a small secondary component that we interpreted as viscosity dominated and was removed after 10 mT. A suitable characteristic direction was mostly obtained between 20 and 70 mT although in a number of cases the magnetization level was too low for demagnetization beyond 45–50 mT. This was particularly true within the transitional intervals that are always very weakly magnetized. About 5% of the diagrams displayed erratic or incoherent successive demagnetization results and were thus rejected. In a second step, we disregarded the results with successive directions lying within a 95% confidence cone larger than 30◦
as well as those with a maximum angular deviation (MAD) exceeding 15◦
. A total of 2904 and 3492 diagrams passed the criteria for ODP Sites 851 and 1021 yielding rejection of 9% and 10% additional results, respectively. In each case, the final interpretation was derived from the demagnetization steps comprised at least between 20 and 50 mT. The averaged value of the normal polarity declinations of each core was adjusted to zero assuming that the time covered was long enough to averaged out the non-dipole components.
Anhysteretic remanent magnetization (ARM) was measured and demagnetized using the same protocol as for NRM. After cleaning in a 90 mT field to remove any residual magnetization
feart-08-00148 May 18, 2020 Time: 15:3 # 4
Valet et al. Relative Paleointensity During 4 Myr
FIGURE 3 | Typical diagrams from ODP sites 851 and 1021 obtained after demagnetization by alternating field. M numbers correspond to the a.f. demagnetization level in mT (e.g., M010 = 10 mT).
component, samples and U-channels were remagnetized in 80 mT alternating field in presence of a 50µT steady field. ARM was subsequently measured and demagnetized at 20, 30, 40, and 50 mT af peak fields. Changes in magnetic granulometry and mineralogy were documented for a few samples from each site at different depths using the downcore evolution of the ARM/K ratio and the resistance of NRM to af demagnetization.
Magnetostratigraphy
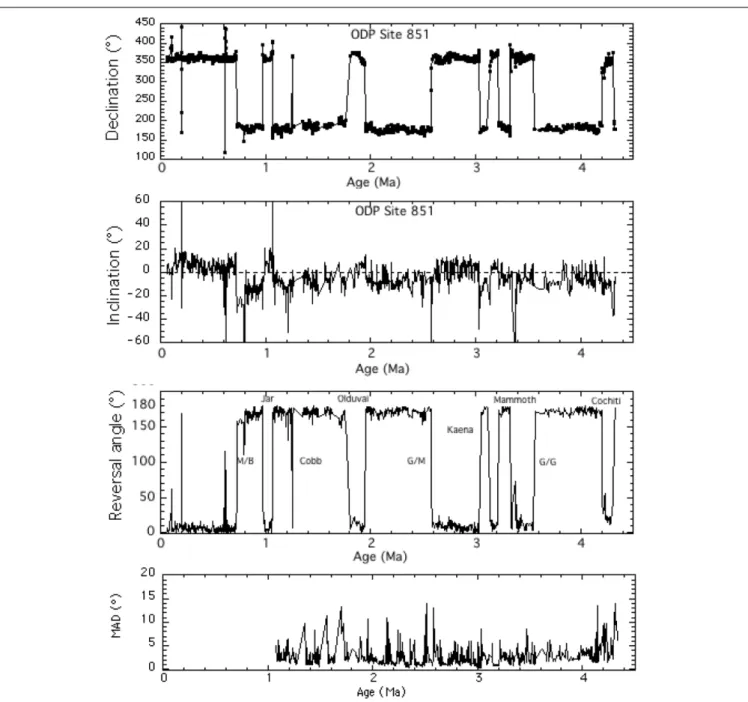
The successive declinations and inclinations derived from the demagnetization diagrams of both sites are plotted in Figures 4, 5
as a function of age (Supplementary Tables S2, S3). Both declinations and inclinations display the same coherent polarity pattern at each site. This is also valid for the inclinations from ODP Site 851 despite its equatorial position at 2◦
of latitude. The reversal angle defined with respect to the local direction of the axial dipole is also shown in the same figure. The depth of the major geomagnetic events was defined with reference to this parameter. The successive polarities are indicated in the figure. The directions show that all polarity intervals have been successfully recorded down to the upper Cochiti event. At ODP Site 851, no suitable interpretation of the shipboard
FIGURE 4 | Evolution of declination, inclination, reversal angle, and maximum angular deviation (MAD) as a function of time at ODP site 851. The MAD is only shown for the samples that were measured in the present study. Abbreviations shown with reversal angles are for reversal names (e.g., M/B, Matuyama-Brunhes; G/G, Gilbert/Gauss).
measurements was previously obtained between 23.7 (1.25 Ma) mcd and 31.9 mcd (1.72 Ma). This period within the Matuyama chron remains less documented, but the intervals 26–28.8 mcd (1.36–1.5 Ma) and 29.7–30.8 mcd (1.56–1.63 Ma) provide now reliable results.
The depth of several events is more accurately determined than the shipboard measurements due to the higher sampling resolution, but also because demagnetization was performed at higher af peak fields and thus was more efficient at removing the imprint of the secondary components within weakly magnetized intervals. It is likely that the reversed
directions were mixed up with normal polarity components within transitional intervals and therefore no final direction could be properly isolated. In fact, most normal to reverse reversals were frequently found at slightly lower depths than in the shipboard previous study. In these specific intervals of low magnetization intensity, complete af demagnetization was more effective to remove all normal polarity secondary components. A direct consequence is that weakly magnetized reversed directions could be isolated at lower stratigraphic levels and that the overall scatter of directions has been reduced.
feart-08-00148 May 18, 2020 Time: 15:3 # 6
Valet et al. Relative Paleointensity During 4 Myr
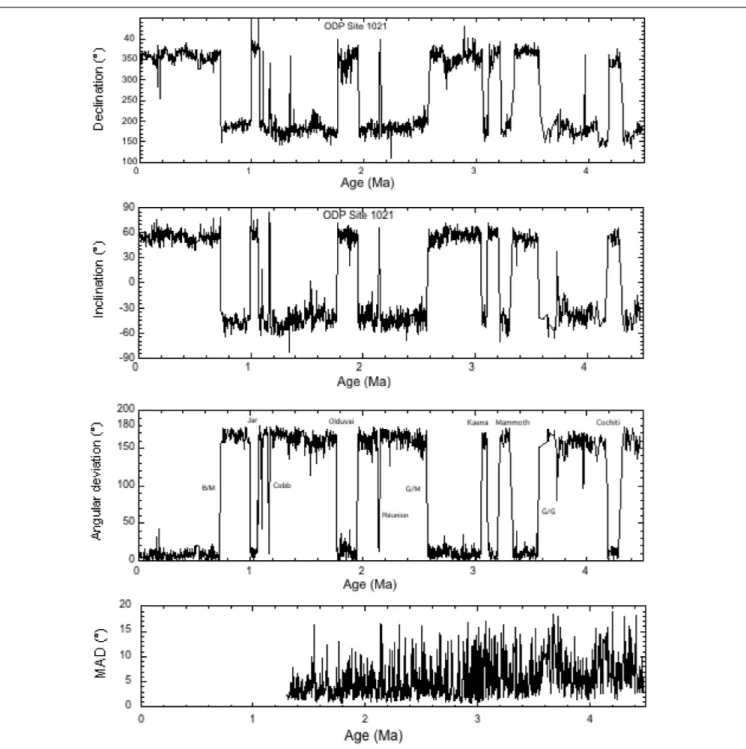
FIGURE 5 | Evolution of declination, inclination, reversal angle, and maximum angular deviation (MAD) as a function of time at ODP site 1021. The MAD is only shown for the samples that were measured in the present study. Abbreviations shown with reversal angles are for reversal names (e.g., M/B, Matuyama-Brunhes; G/G, Gilbert/Gauss).
It is also noticeable that the successive directions within each polarity interval are less scattered at ODP Site 851 than at ODP Site 1021. We can tentatively evaluate to what extent this dispersion reflects the difference of resolution between the two records by smearing the directions from ODP Site 1021 and thus simulating the same resolution as at ODP Site 851. Dispersion decreases but remains higher than at ODP Site 851. A second possible cause is that the demagnetization diagrams
are somehow more scattered at ODP Site 1021 than at ODP Site 851. This characteristic feature may be associated with the large amount of clay minerals present in the samples while the sediment from ODP Site 851 is almost entirely composed of carbonates. We will discuss this aspect further when dealing with relative paleointensity.
The succession of all reversals (Figure 4) indicates that an age of about 4.4 Ma has been reached at the bottom of both records.
Note that this date was attained at 145 mcd for ODP Site 1021 but at only 80 mcd for ODP Site 851, which results from the almost double deposition rate (3.2 cm/kyr) at ODP Site 1021 compared to that from ODP Site 851 (1.5 cm/kyr). A direct consequence of the lower resolution at ODP Site 851 is the absence of the Réunion event while it is identified at ODP Site 1021. In contrast, the directional changes linked to the Cobb event which lasted longer are present at both sites. Below 4.4 Ma, the magnetization level was too low for providing suitable directions. When compared to the previous shipboard results, the upper parts of both records have remained unchanged.
RELATIVE PALEOINTENSITY
Selecting Appropriate Sediment Levels
Normalization of remanent magnetization to magnetic concentration remains the most direct and suitable technique to recover relative paleointensity from marine sediments. The assumption behind this approach is that the magnetization response to field intensity changes should not change drastically within the sedimentary column, which implies that the magnetic characteristics of the sediment do not vary significantly along the sedimentary column. In the opposite situation, changes in the magnetization process are likely to occur and thus to generate significant variations of magnetization intensity. Clusters of particles play an important role in the magnetization process (Katari and Bloxham, 2001;Shcherbakov and Sycheva, 2008, 2010; Valet et al., 2017). Changes in the formation process of such aggregates are likely to be associated with a change in the magnetic alignment yielding different magnetic responses and then generating dispersion within the stable polarity intervals. The successive directions plotted in Figures 4, 5 show that both records are characterized by little dispersion of the normal and reverse directions (3.5◦
) for both normal and reverse directions at both sites within 15◦
from the axial dipole). The absence of additional scatter for the reverse directions is a good indication that the viscous overprint (and sometimes a small drilling remanence) was correctly removed at both sites. Note also that the relatively low resolution of the records is incompatible with large amplitude paleosecular variation since changes with characteristic times lower than a few 1 ka are either smeared out or remain mostly undetectable.
A first criterion for selecting appropriate samples for relative paleointensity is the quality of their demagnetization diagrams that are characterized by a well-defined direction with a straight line decreasing toward the origin. This condition has been taken into account by selecting the samples with directions lying within a 95% confidence cone lower than 30◦
and a MAD that does not exceed 15◦
.
A second parameter is the absence of large downcore variations in the magnetic content (Levi and Banerjee, 1976;King et al., 1983). It is usually considered that variations lower than a factor of 15 should not drastically affect the determination of relative paleointensity. The K and ARM changes are characterized by large variations at ODP Site 1021, but they remain below this
limit. Except for very few intervals that were ruled out, no similar high-amplitude change is present at ODP Site 851 (Figure 6A).
A good indicator of downcore magnetic homogeneity relies also on the similarity of parameters that are indicative to the magnetic content. It is usual to scrutinize the evolution of low-field susceptibility along with that of ARM which are both linked to different grain size fractions. Perfect downcore magnetic homogeneity implies similar profiles and amplitudes of both parameters. The large drop in susceptibility between 1.5 and 1.8 Ma at ODP Site 1021 (Figure 6B) is accompanied by a larger change in the amplitude of ARM, resulting in a marked decrease of the ARM/K ratio (Figure 6C). In the absence of significant variations of coercivity, the evolution of ARM/K is thus most likely caused by changes in magnetic grain size with potential consequences on the magnetic alignment.
It is thus expected to observe a different downcore profile for the NRM/K ratio than for the NRM/ARM ratio. Indeed, the NRM/K ratio does not account for the large decrease of the magnetic content, thus suggesting a magnetic field that would significantly lower prior to 1.5 Ma ago. This is inconsistent with our knowledge of field behavior during this period as documented from other marine sediments as well as from volcanic lava flows. In contrast, the results derived from the NRM/ARM ratio have a similar range of values for both periods. We see two issues behind these results. The first one is to assume that, despite being within the usual acceptable limit for changes in magnetic concentration, the sediment cannot be considered as homogeneous and would therefore not be appropriate for relative paleointensity. Alternatively, it can be argued that in contrast to susceptibility, ARM would involve magnetic grain sizes that are similar to those of the NRM and would thus be the unique suitable parameter for normalization. The fact that the large change in magnetic concentration at 1.4 Ma has no repercussion on the mean value of the NRM/ARM ratio at all demagnetization levels is in favor of this hypothesis (see Figure 8).
Paleointensity Results
The paleointensity experiments were carried out for specimens with well-defined and unambiguous characteristic remanence. As mentioned above, all samples with MAD lower than 15◦
were eliminated as well as those that were characterized by incoherent directions mostly due to very low magnetization intensity. Therefore, many data points from the transitional intervals were excluded because the directions were poorly constrained due to very weak intensity. A direct consequence of this selection process is that a few intervals are poorly described or even sometimes depleted of data. The paleointensity results were obtained from the averaged value of the NRM/ARM ratios after demagnetization at 20, 30, 40, and 50 mT. They were compared to the results derived from the slope of the NRM versus ARM plots at the same demagnetization levels. Both techniques yielded the same results. In Figures 7, 8 the paleointensity records from ODP Sites 851 and 1021 expressed in terms of the averaged NRM/ARM ratios are plotted as a function of age (Supplementary Tables S2, S3). In the same figure, is shown the reversal angle which describes the succession of polarity intervals during the past 4 Ma.
feart-08-00148 May 18, 2020 Time: 15:3 # 8
Valet et al. Relative Paleointensity During 4 Myr
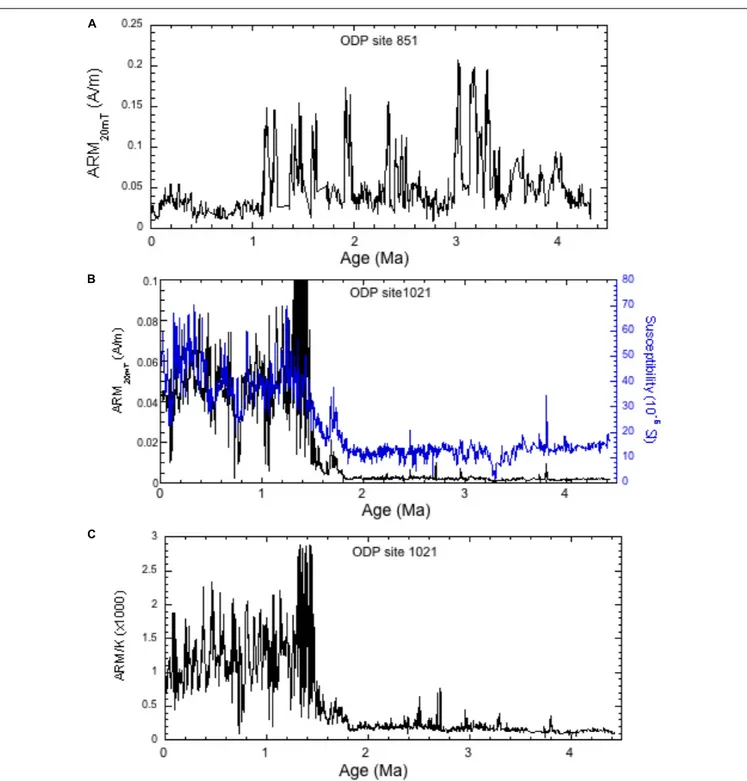
FIGURE 6 | (A) ARM variations as a function of age at ODP site 851. (B) ARM and low-field susceptibility changes as a function of age for ODP site 1021. (C) Downhole evolution of ARM/K indicates that the decrease in magnetic content at 1.8 Ma is accompanied by a change in magnetic grain size.
It is striking that the two records look different, except during the reversal periods that are always characterized by a significant drop of relative paleointensity. A similar decrease is present during smaller events like the Cobb and Réunion although the Réunion event is only indicated by low intensity without directional changes at ODP Site 851. The curve from ODP Site 851 shows also a larger amplitude of the oscillations. One of the
most conspicuous features is the asymmetrical pattern across the reversals that was initially reported from the initial paleointensity results of the four holes drilled at this site using ARM and susceptibility as normalizers of NRM for the 0–1.2 Ma period (Valet and Meynadier, 1993). In contrast, the paleointensity record from ODP Site 1021 is characterized by a succession of oscillations with similar amplitudes and wavelength. There is no
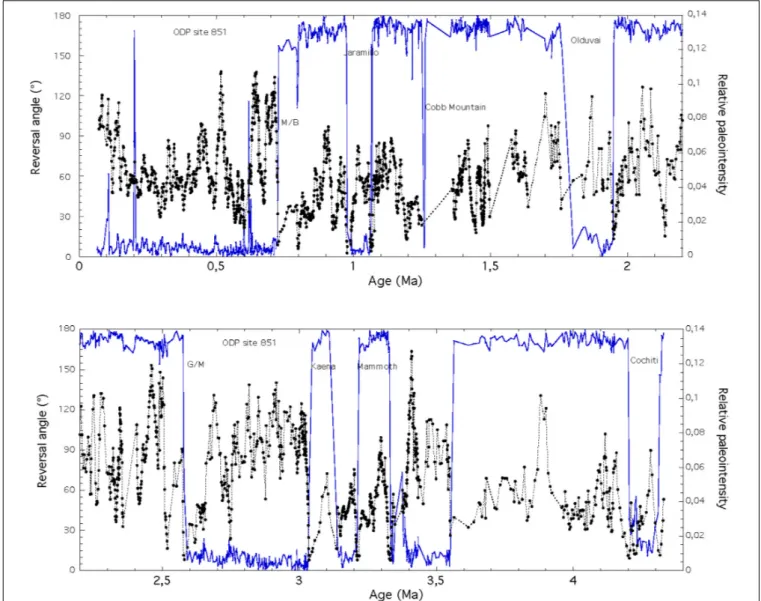
FIGURE 7 | Relative paleointensity (derived from the average of NRM20 mT/ARM20 mT, NRM30 mT/ARM30 mT, NRM40 mT/ARM40 mT, and NRM50 mT/ARM50 mT) and
reversal angle (blue line) during the past 4.4 Ma from ODP site 851.
evidence for asymmetry across reversals, neither for any specific pattern, but a succession of large amplitude cycles.
Influence of Environmental Factors
The question arises as to which extent we can trust the fidelity of these records, which requires to investigate to which extent paleoenvironmental factors can affect the normalization (Lund and Schwartz, 1999;Guyodo et al., 2000). A first aspect that comes to mind is the influence of lithology since the sediments from both sites are opposite in terms of carbonate and clay content.
ODP Site 851
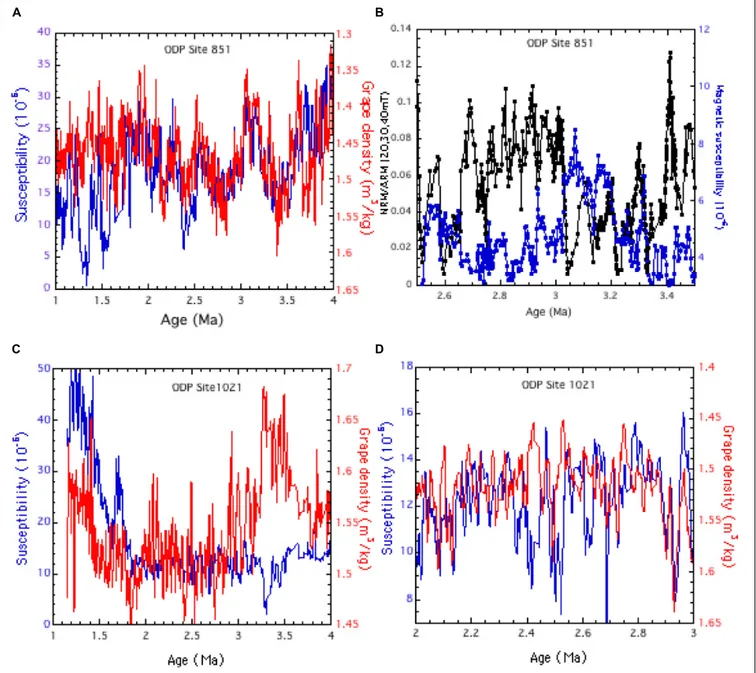
One way of approaching the problem is to investigate a possible link between magnetic parameters and climatically induced changes recorded in the sedimentary column. At ODP Site 851, many short as well as long-term features in the susceptibility record correlate with density variations in the GRAPE record
(Figure 9A). A strong positive relationship between wet bulk density and carbonate content has been reported in sediments collected from the Eastern Equatorial Pacific Ocean (e.g.,Mayer, 1991). Carbonate measurements have confirmed that the inverse relationship between magnetic susceptibility and density chiefly reflects the anti-correlation between magnetic concentration and carbonate content and therefore points out a process of dilution.
The similarity of the susceptibility and density profiles is an indication of the homogeneity of the sediment both in terms of lithology and magnetism. In fact, the global inverse relationship between magnetic susceptibility and density indicates that changes in magnetic concentration are driven at first-order by a unique cause which has a similar impact on the NRM and the concentration parameters (K, ARM, and SIRM). Therefore, it seems reasonable to expect that these changes should globally be accounted by the normalization.
feart-08-00148 May 18, 2020 Time: 15:3 # 10
Valet et al. Relative Paleointensity During 4 Myr
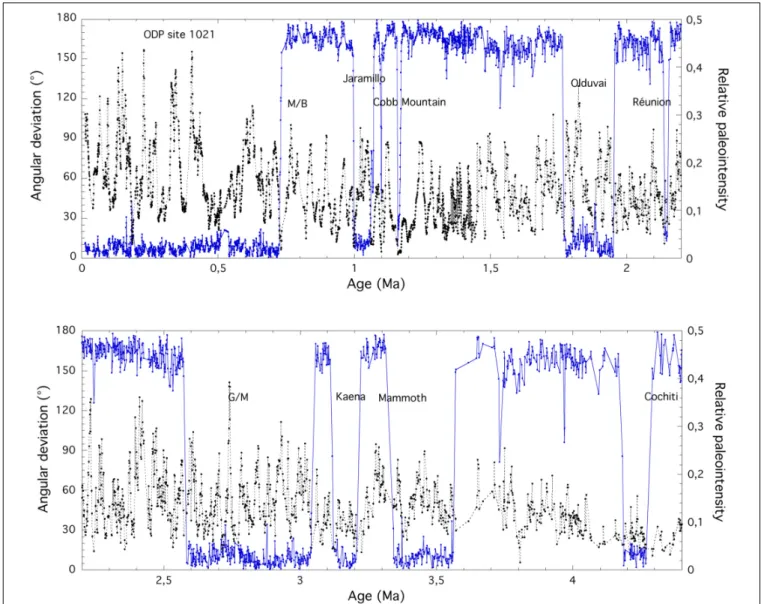
FIGURE 8 | Relative paleointensity (derived from the average of NRM20mT/ARM20mT, NRM30mT/ARM30mT, NRM40mT/ARM40mT, and NRM50mT/ARM50mT) and
reversal angle (blue line) during the past 4.4 Ma from ODP site 1021.
The persistence of a climatic overprint in records of relative paleointensity is usually investigated using spectral analyses (Channell et al., 1998; Guyodo et al., 2000; Yokoyama and Yamazaki, 2000) to determine whether typical frequencies of the Earth’s orbital parameters remain present. However, this approach can be delicate as it critically depends on the accuracy of the time scale which cannot be better than 5 ka, especially for periods as short as 21 ka or even 42 ka that would be recorded over 10 or 20 cm, respectively, with a 2 cm/ka accumulation rate. Spectral analyses are also hampered by the irregular resolution of the records with some intervals missing or poorly described.
The bulk density variations from ODP Site 851 result from orbitally driven climatic periodicities and were tuned to insolation changes to derive the initial depth-time model (Shackleton et al., 1995). The correlation between density and magnetic susceptibility indicates that this parameter is
similarly related to orbital frequencies. The persistence of a climatic overprint in the NRM/ARM paleointensity record should thus be reflected by a correlation with magnetic susceptibility. We scrutinized these two indicators over the same time interval as for density and susceptibility in Figure 9A and found no direct resemblance between their long-term changes (Figure 9B). The situation of the short-term variations seems to be a little more complex with correlations that can be either positive or negative. However, caution is required before validating this resemblance which in many cases is only apparent, but not realistic. A typical example is the similarity between patterns of relative paleointensity and susceptibility that surround the intensity lows associated with the lower Mammoth and upper Mammoth reversals and therefore independent of any lithological change. Given poor resemblance between magnetic concentration, density, and relative paleointensity, it seems likely that the record of
FIGURE 9 | (A) low-field susceptibility and Grape bulk density as a function of age at ODP site 851, (B) susceptibility and relative paleointensity as a function of age at ODP site 851, (C) low-field susceptibility and Grape density as a function of age at site 1021, and (D) same as (C) for the 2–3 Ma interval.
relative paleointensity is not significantly affected by a climatic overprint.
ODP Site 1021
The susceptibility variations from ODP Site 1021 do not match the Grape density variations so well that for ODP Site 851 (Figure 9C). There are significant discrepancies between the amplitudes of both parameters which suggest a more complex behavior and a more complicated relationship between magnetic concentration and density. The short-term variations plotted between 2 and 3 Ma in Figure 9D (for comparison with ODP Site 851) are either correlated or inversely correlated. In
summary, there is clearly less convergence between lithology and magnetism.
The NRM/ARM record from ODP Site 1021 appears to be partly affected by global climatic changes. This has been noticed for the past 1.2 Ma (Guyodo et al., 2000) and is further observed for the previous period by comparing the susceptibility changes (obtained with a simple age model using the reversal ages as unique tie points) and the delta18O global stack (Lisiecki and Raymo, 2005). We have seen above that the susceptibility record (Figure 2A) correlates with eccentricity (100 ka) and thus suggest an imprint of orbital frequencies on magnetic concentration at this site. We can wonder to what extent the large amplitude oscillations which dominate the
feart-08-00148 May 18, 2020 Time: 15:3 # 12
Valet et al. Relative Paleointensity During 4 Myr
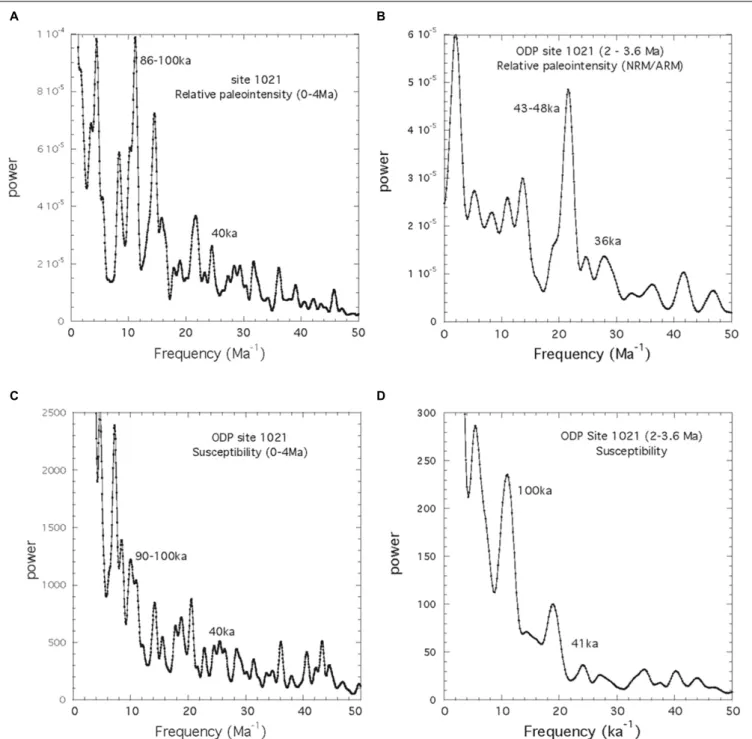
FIGURE 10 | Power spectrum of the NRM/ARM ratio for (A) the 0–4.4 Ma and (B) the 2–4 Ma period. Power spectrum of low-field susceptibility for (C) the 0–4.4 Ma and (D) the 2–4 Ma period.
paleointensity record would be linked to a climatic overprint that obliterated the geomagnetic variations. We performed spectral analyses of susceptibility and paleointensity records using the Blackman-Tukey approach with a Bartlett window. As mentioned above, we keep in mind that such analyses are heavily dependent on the accuracy of the time scale which is not better than 5 ka, and therefore has consequences for the analysis of short periods. We investigated the 0– 4 Ma interval and the past 2 Ma in order to account
for the switch from the dominant climatic influence of obliquity to eccentricity between 1 and 1.4 Ma (Guyodo et al., 1999). The plots in Figures 10A,B show that when dealing with the entire 4 Myr long record, the NRM/ARM ratio displays power within the eccentricity and obliquity bands. The susceptibility (Figures 10C,D) does not show such a strong 100 ka frequency, but confirms the dominance of the obliquity band. These conclusions are reinforced when dealing only with the oldest part of the record (2–4 Ma).
FIGURE 11 | Paleointensity changes across reversals from ODP site 851. The origin of the x-axis corresponds to the directional onset of the transition. Positive ages correspond to pre-reversal period.
feart-08-00148 May 18, 2020 Time: 15:3 # 14
Valet et al. Relative Paleointensity During 4 Myr
FIGURE 12 | Relative paleointensity and stable oxygen isotope ratio (δ18O) for (A,B) common time intervals at ODP Site 983 (Channell, 1999) and ODP Site 1021
During this period, obliquity shows more power in the susceptibility record and becomes strongly dominant in the RPI indicating the presence of climatic overprint in the NRM/ARM data. The periods of weak geomagnetic intensity surrounding the reversals are characterized by a very large amplitude and therefore dominate the influence of non-magnetic parameters. However, the large amplitude intensity lows outside identified reversals or geomagnetic features like excursions are puzzling and suggest the contribution of other factors were during these periods.
Origin of the Main Paleointensity
Features
One of the main characteristics of the record from ODP Site 851 is its specific asymmetrical pattern across the geomagnetic reversals (Valet and Meynadier, 1993;Valet et al., 1994). This feature is not common to all paleomagnetic records and remains controversial (Tauxe and Shackleton, 1994;Channell et al., 1997). It is neither present at ODP Site 1021 and therefore led us to wonder about the exact origin of the changes in relative paleointensity. We do not pretend to bring here any firm answer but just report a few interesting observations.
The asymmetrical pattern of relative paleointensity across the successive reversals (as shown in Figure 11) at ODP Site 851 is repeated at different horizons within the sediment. This progressive evolution is difficult to associate with a periodic climatic or paleoenvironmental signature. Among other non-geomagnetic hypotheses; a process of cumulative viscous remanence that would have not been removed by alternating fields was suggested (Kok and Tauxe, 1996). This hypothesis has been formerly ruled out from theoretical considerations as well as from experimental results of thermal demagnetization (Meynadier et al., 1998; Meynadier and Valet, 2000). Post-depositional magnetization (Mazaud, 1996; Meynadier and Valet, 1996) was also pointed out, but it would require a magnetization lock-in over several meters depth scale to generate the long-term decrease, which is difficult to reconcile with physical processes within the sediment.
The paleointensity records from ODP Site 983 in the Northern Atlantic Ocean (Channell, 1999) and the present results from ODP Site 1021 are plotted in Figure 12. The two curves are shown over the common time interval 0.5–1 Ma because the high-resolution record from ODP Site 983 does not go beyond 1.1 Ma. A direct comparison is restrained by the age of the last reversal which is different in both studies (0.78 Ma for ODP Site 983 and 0.73 Ma for ODP Site 1021), but this little discrepancy does not explain why the two curves cannot be reconciled. Interestingly, they display similar characteristics with a succession of large amplitude pseudo-periodic cycles without any long-term characteristic behavior. The changes in relative paleointensity from ODP Site 1021 are plotted in
Figure 12C along with the evolution of δ18O for the interval 1.5–2 Ma. Both curves display a great deal of similarities. Unless assuming an unlikely strong modulation of the geomagnetic field by earth’s orbital parameters, we are rather inclined to
consider that, despite normalization, the two records remain partly affected by other factors than field intensity. The area of ODP Site 983 in the Northern Atlantic Ocean is prone to large changes induced by climatic fluctuations associated to ice cap dynamics, oceanic circulation and various sedimentary processes. Similarly, the sediment from ODP Site 1021 on the Californian continental margin is subjected to lithological variations that may not be fully appropriate to maintain the same response of the magnetization to field intensity. The complexity and the variety of these processes is certainly difficult to be accounted only by changes in magnetic concentration and point out the interplay between lithology and sedimentary factors. Interestingly, at both sites there is a large decrease of the RPI during all reversals which indicates that the geomagnetic contribution was dominant when the field changes exceeded the contribution of the other parameters. In contrast, similar drops at other stratigraphic levels cannot be reconciled with a geomagnetic origin.
CONCLUSION
This study aimed at extending the paleointensity records from the equatorial ODP Site 851 and from the mid-latitude ODP Site 1021 in the California margin over the past 4.4 Ma. The time-scale was obtained from orbital tuning of the Grape bulk density and susceptibility measurements for the younger part of the record and was obtained by interpolating the successive reversal ages below 1.4 Ma. The study was concentrated first on the directional changes that were mostly obtained from detailed measurements of single samples with a resolution between 1 and 2 kyr. The initial magnetostratigraphy derived from the shipboard measurements with relatively poor demagnetization has been improved at both sites with more accurate positions of the successive reversals down to the Cochiti period. The two records of relative paleointensity display a large decrease during all reversals giving confidence on the geomagnetic origin of the signal during these periods. However, the pattern of field changes surrounding the reversals as well as the successive variations during the stable polarity intervals differ significantly between both sites and prevent us from extracting common field characteristics. Spectral analyses and considerations regarding the changes in magnetic concentration parameters led us to conclude that the paleointensity signal from ODP Site 1021 remained imprinted by climatic components despite normalization by magnetic concentration. Such variability would bias the signal and explain the absence of any long-term geomagnetic evolution of the signal. These different signatures are most likely linked to lithology and would indicate that in this case the higher carbonate content at ODP Site 851 was more appropriate for relative paleointensity than the large clay content present at ODP Site 1021. However, this cannot be dissociated from the paleoenvironmental situation of the sites, more specifically the fact that ODP Site 1021 is located on the Californian margin and thus prone to more complex depositional processes.
feart-08-00148 May 18, 2020 Time: 15:3 # 16
Valet et al. Relative Paleointensity During 4 Myr
DATA AVAILABILITY STATEMENT
All datasets generated for this study are included in the article/Supplementary Material. Further information will be provided by the authors on request.
AUTHOR CONTRIBUTIONS
J-PV initiated the study, helped with sampling, interpreted the measurements, and wrote the manuscript. AT performed the measurements, helped with sampling, and participated to the first step of interpretation. FB involved in the time-depth correlation and edited the manuscript. TS and NH helped with sampling and carbonate measurements.
FUNDING
This research was funded by the European Research Council under the European Union’s Seventh Framework
Program (FP7/2007–2013)/ERC advanced grant agreement GA 339899.
ACKNOWLEDGMENTS
We acknowledge the work done by two reviewers which improved the manuscript. Many thanks to the people from the Gulf Coast Core repository for their invaluable help. This is IPGP contribution 4138. Sampling was made possible by the IODP program.
SUPPLEMENTARY MATERIAL
The Supplementary Material for this article can be found online at: https://www.frontiersin.org/articles/10.3389/feart. 2020.00148/full#supplementary-material
TABLE S1 | Tie points used for depth-time correlation.
TABLE S2 | Directional and relative paleointensity dataset for ODP Site 851. TABLE S3 | Directional and relative paleointensity dataset for ODP Site 1021.
REFERENCES
Channell, J. E. T. (1999). Geomagnetic paleointensity and directional secular variation at ocean drilling program (ODP) site 984 (Bjorn Drift) since 500 ka: comparisons with ODP Site 983 (Gardar Drift). J. Geophys. Res. 104, 22937-22951.
Channell, J. E. T., Hodell, D. A., and Curtis, J. H. (2016). Relative paleointensity (RPI) and oxygen isotope stratigraphy at IODP Site U1308: north Atlantic RPI stack for 1.2–2.2 Ma (NARPI-2200) and age of the Olduvai Subchron.Quat. Sci. Rev. 131, 1–19.
Channell, J. E. T., Hodell, D. A., and Lehman, B. (1997). Relative geomagnetic paleointensity and18O at ODP Site 983 (Gardar Drift, North Atlantic) since
350 ka.Earth Planet. Sci. Lett. 153, 103–118.
Channell, J. E. T., Hodell, D. A., and Lehman, B. (1998). Orbital modulation of the Earth’s magnetic field intensity.Nature 394, 464–468.
Channell, J. E. T., Hodell, D. A., Xuan, C., Mazaud, A., and Stoner, J. S. (2008). Age calibrated relative paleointensity for the last 1.5 Myr at IODP Site U1308 (North Atlantic).Earth Planet. Sci. Lett. 274, 59–71.
Guyodo, Y., Gaillot, P., and Channell, J. E. T. (2000). Wavelet analysis of relative geomagnetic paleointensity at ODP Site 983. Earth Planet. Sci. Lett. 184, 109–123.
Guyodo, Y., Richter, C., and Valet, J.-P. (1999). Paleointensity record from pleistocene sediments off the California Margin.J. Geophys. Res. 22953–22965. Guyodo, Y., and Valet, J. P. (1999). Global changes in geomagnetic intensity during
the past 800 thousand years.Nature 399, 249–252.
Horng, C. S., Roberts, A. P., and Liang, W. T. (2003). A 2.14-Myr astronomically tuned record of relative geomagnetic paleointensity from the western Philippine Sea.J. Geophys. Res. 108:2059. doi: 10.1029/2001JB001698
Inoue, S., and Yamazaki, T. (2010). Geomagnetic relative paleointensity chronostratigraphy of sediment cores from the Okhotsk Sea. Palaeogeogr. Palaeoclimatol. Palaeoecol. 291, 253–266.
Katari, K., and Bloxham, J. (2001). Effects of sediment aggregate size on DRM intensity: a new theory.Earth Planet. Sci. Lett. 186, 113–122.
King, J. W., Banerjee, S. K., and Marvin, J. (1983). A new rock-magnetic approach to selecting sediments for geomagnetic paleointensity studies: application to paleointensity for the last 4000 years.J. Geophys. Res. 88, 5911–5921. Kirschvink, J. L. (1980). The least-sqaures line and plane and the analysis of
paleomagnetic data.Geohys. J. Inter. 62, 699–718. doi: 10.1111/j.1365-246X. 1980.tb02601.x
Kok, Y. S., and Tauxe, L. (1996). Saw-tooth pattern of relative paleointensity records and cumulative viscous remanence. Earth Planet. Sci. Lett. 137, 95–99.
Laj, C., Kissel, C., Mazaud, A., Channell, J. E. T., and Beer, J. (2000). North Atlantic palaeointensity stack since 75 ka (NAPIS-75) and the duration of the Laschamp event.Philos. Trans. R. Soc. Lond. A 358, 1009–1025.
Laskar, J., Fienga, A., Gastineau, M., and Manche, H. (2011). La2010: a new orbital solution for the long-term motion of the Earth.Astron. Astrophys. 532:A89. doi: 10.1051/0004-6361/201116836
Levi, S., and Banerjee, S. K. (1976). On the possibility of obtaining relative paleointensities from lake sediments.Earth. Planet. Sci. Lett. 29, 219–226. Lisiecki, L. E., and Raymo, M. E. (2005). A Pliocene−Pleistocene stack of 57
globally distributed benthicδ18O records.Paleoceanography 20:A1003. doi:
10.1029/2004PA001071
Lund, S., and Schwartz, M. (1999). “Environmental factors affecting geomagnetic field paleointensity estimates from sediments,” inQuaternary Environmental Magnetism, eds B. Maher, and R. Thompson (Cambridge: Cambridge Univ. Press).
Lyle, M., Koizumi, I., and Richter, C. (1997). “Shipboard scientific party,” in Proceedings of the Ocean Drilling Program, Initial Reports, Part 1, Vol 167, College Station, TX.
Macri, P., Sagnotti, L., Dinarès-Turell, J., and Caburlotto, A. (2010). Relative geomagnetic paleointensity of the Brunhes Chron and the Matuyama–Brunhes precursor as recorded in sediment core from Wilkes Land Basin (Antarctica). Phys. Earth Planet. Int. 179, 72–86.
Mayer, L. A. (1991). Extraction of high-resolution carbonate data for palaeoclimate reconstruction.Nature 352, 148–150.
Mazaud, A. (1996). Saw-tooth variation in magnetic intensity profiles and delayed acquisition of magnetization in deep sea cores.Earth Planet. Sci. Lett. 139, 379–386.
Mazaud, A., Channell, J. E. T., and Stoner, J. S. (2015). The paleomagnetic record at IODP Site U1307 back to 2.2 Ma (Eirik Drift, off south Greenland).Earth Planet. Sci. Lett. 429, 82–89.
Meynadier, L., and Valet, J. P. (1996). Post-depositional realignment of magnetic grains and asymmetrical saw-toothed pattern of magnetization intensity.Earth Planet. Sci. Lett. 140, 123–132.
Meynadier, L., and Valet, J. P. (2000). Reply to the comment on “Saw-toothed variations of relative paleointensity and cumulative viscous remanence: testing the records and the model”.J. Geophys. Res. 105:613.
Meynadier, L., Valet, J.-P., Guyodo, Y., and Richter, C. (1998). Saw-toothed variations of relative paleointensity and cumulative viscous remanence: testing the records and the model.J. Geophys. Res. 103, 7095–7105.
Meynadier, L., Valet, J. P., and Shackleton, N. J. (1995). “Relative geomagnetic intensity during the last 4 m.y. from the equatorial Pacific,” inProceedings of the Ocean Drilling Program, Scientific Results, Vol. 138, eds N. G. Pisias, L. A. Mayer, T. R. Janacek, A. Palmer-Julson, and T. H. van Andel (College Station, TX: Ocean Drilling Program), 779–795.
Meynadier, L., Valet, J. P., Weeks, R., Shackleton, N., and Hagee, V. L. (1992). Relative paleointensities of the geomagnetic field during the last fourteen hundred thousand years. Earth Planet. Sci. Lett. 114, 39–57.
Ravello, A. C., and Schakleton, N. J. (1995). “Evidence for surface-water circulation changes at site 851 in the eastern tropical Pacific Ocean,” inProceedings of the Ocean Drilling Program, Scientific Results, Vol. 138, eds N. G. Pisias, L. A. Meyer, T. R. Janecek, A. Palmer-Julson, and T. H. van Andel (Texas A&M University). Shackleton, N. J., Crowhurst, S., Hagelberg, T., Pisias, G., and Schneider, D. A. (1995). “A new late Neogene time scale, application to leg 138 sites,” in Proceedings of the Ocean Drilling Program, Scientific Results, Vol. 13, eds N. G. Pisias, L. A. Mayer, T. R. Janecek, A. Palmer-Julson, and T. H. van Andel (College Station, TX: Ocean Drilling Program).
Shcherbakov, V., and Sycheva, N. (2008). Flocculation mechanism of the acquisition of remanent magnetization by sedimentary rocks.Izvestiya Phys. Solid Earth 44, 804–815.
Shcherbakov, V., and Sycheva, N. (2010). On the mechanism of formation of depositional remanent magnetization.Geochem. Geophys. Geosyst. 11, 1–18. doi: 10.1029/2009GC002830
Stoner, J. S., Channell, J. E. T., Hillaire-Marcel, C., and Kissel, C. (2000). Geomagnetic paleointensity and environmental record from Labrador Sea core MD95-2024: global marine sediment and ice core chronostratigraphy for the last 110 kyr.Earth Planet. Sci.Lett. 183, 161–177.
Suganuma, Y., Yamazaki, T., Kanamatsu, T., and Hokanishi, N. (2008). Relative paleointensity record during the last 800 ka from the equatorial Indian Ocean: implication for relationship between inclination and intensity variations. Geochem. Geophys. Geosyst. 9:Q02011. doi: 10.1029/2007GC0 01723
Tauxe, L., and Shackleton, N. J. (1994). Relative paleointensity records from the Ontong-Java Plateau.Geophys. J. Int. 117, 769–782.
Valet, J. P., and Meynadier, L. (1993). Geomagnetic field intensity and reversals during the past four million years.Nature 366, 234–238.
Valet, J. P., Meynadier, L., Bassinot, F., and Garnier, F. (1994). Relative paleointensity across the last geomagnetic reversal from sediments of the Atlantic, Indian and Pacific oceans. Geophys. Res. Lett. 21, 485–488.
Valet, J.-P., Meynadier, L., and Guyodo, Y. (2005). Geomagnetic field strength and reversal rate over the past 2 Million years.Nature 435, 802–805. doi: 10.1038/nature03674
Valet, J. P., Tanty, C., and Carlut, J. (2017). Detrital magnetization of laboratory-redeposited sediments.Geophys. J. Int. 210, 34–34.
Yamamoto, Y., Yamazaki, T., Kanamatsu, T., Ioka, N., and Mishima, T. (2007). Relative paleointensity stack during the last 250 kyr in the northwest Pacific. J. Geophys. Res. 112:B01104. doi: 10.1029/2006JB0 04477
Yamazaki, T. (1999). Relative paleointensity of the geomagnetic field during the Brunhes Chron recorded in North Pacific deep-sea sediment cores: orbital influence?Earth Planet. Sci. Lett. 169, 23–35.
Yamazaki, T., and Kanamatsu, T. (2007). A relative paleointensity record of the geomagnetic field since 1.6 Ma from the North Pacific.Earth Planets Space 59, 785–794. doi: 10.1186/BF03352741
Yamazaki, T., and Oda, H. (2005). A geomagnetic paleointensity stack between 0.8 and 3.0 Ma from equatorial Pacific sediment cores.Geochem. Geophys. Geosyst. 6:Q11H20. doi: 10.1029/2005GC001001
Yokoyama, Y., and Yamazaki, T. (2000). Geomagnetic paleointensity variation with a 100 kyr quasi-period.Earth Planet. Sci. Lett. 181, 7–14.
Conflict of Interest:The authors declare that the research was conducted in the absence of any commercial or financial relationships that could be construed as a potential conflict of interest.
Copyright © 2020 Valet, Thevarasan, Bassinot, Savranskaia and Haddam. This is an open-access article distributed under the terms of the Creative Commons Attribution License (CC BY). The use, distribution or reproduction in other forums is permitted, provided the original author(s) and the copyright owner(s) are credited and that the original publication in this journal is cited, in accordance with accepted academic practice. No use, distribution or reproduction is permitted which does not comply with these terms.