HAL Id: halshs-00566120
https://halshs.archives-ouvertes.fr/halshs-00566120
Preprint submitted on 15 Feb 2011
HAL is a multi-disciplinary open access
archive for the deposit and dissemination of sci-entific research documents, whether they are pub-lished or not. The documents may come from teaching and research institutions in France or abroad, or from public or private research centers.
L’archive ouverte pluridisciplinaire HAL, est destinée au dépôt et à la diffusion de documents scientifiques de niveau recherche, publiés ou non, émanant des établissements d’enseignement et de recherche français ou étrangers, des laboratoires publics ou privés.
Let us pray: religious interactions in life satisfaction
Andrew E. Clark, Orsolya Lelkes
To cite this version:
Andrew E. Clark, Orsolya Lelkes. Let us pray: religious interactions in life satisfaction. 2009. �halshs-00566120�
WORKING PAPER N° 2009 - 01
Let us pray:
Religious interactions in life satisfaction
Andrew E. Clark Orsolya Lelkes
JEL Codes: D02, I31, Z12
Keywords: Life satisfaction, religion, externalities
P
ARIS-
JOURDANS
CIENCESE
CONOMIQUESL
ABORATOIRE D’E
CONOMIEA
PPLIQUÉE-
INRA48,BD JOURDAN –E.N.S.–75014PARIS TÉL. :33(0)143136300 – FAX :33(0)143136310
www.pse.ens.fr
CENTRE NATIONAL DE LA RECHERCHE SCIENTIFIQUE –ÉCOLE DES HAUTES ÉTUDES EN SCIENCES SOCIALES
LET US PRAY: RELIGIOUS INTERACTIONS IN LIFE SATISFACTION
Andrew E. Clark* (Paris School of Economics and IZA) Orsolya Lelkes (European Centre, Vienna)
January 2009
Abstract
We use recent pooled survey data on 90 000 individuals in 26 European countries to examine religious spillover effects on life satisfaction. Own religious behaviour is positively correlated with individual life satisfaction. More unusually, average religiosity in the region also has a positive impact: people are more satisfied in more religious regions. This spillover holds both for those who are religious and for those who are not. The flipside of the coin is that a greater proportion of “atheists” (those who say they do not currently belong to any religious denomination) has negative spillover effects, for the religious and atheists alike. We last show that both Protestants and Catholics like to live in regions where their own religion is dominant, while Protestants are also more satisfied when Catholics dominate. The generic positive spillover effect of others’ religion is not explained by social capital, crime, or trust.
JEL Codes: D02, I31, Z12
Keywords: Life Satisfaction, Religion, Externalities
* Corresponding author: PSE, 48 Boulevard Jourdan, 75014 Paris, France. Tel: 33-1-43-13-63-29. E-mail: [email protected]. The Norwegian Social Science Data Services (NSD) is the data archive and distributor of the ESS data. We are grateful to the ATIP programme of the CNRS for financial support. Thanks to Ed Diener, Jean-Yves Duclos and seminar participants at the “De Gustibus Est Disputandum” Conference (La Baule), DIW Berlin, the IARIW Conference (Portoroz, Slovenia), the 6th ISQOLS Conference (Philadelphia), the Journée francophone des utilisateurs de l'Enquête sociale européenne (Paris), and Université Paris 2 for useful comments.
Let Us Pray: Religious Interactions In Life Satisfaction
Andrew E. Clark and Orsolya Lelkes
1 Introduction
Social interactions – whereby what you do affects my utility and my subsequent behaviour – have overwhelmingly been investigated using data on choices (observable behaviours). There are, however, arguably good reasons to complement these behavioural results by the analysis of some measure of utility. This paper takes the latter utility approach to modelling social interactions, but applied to a somewhat unusual phenomenon: religious behaviour. While it seems fairly established across various social science disciplines that the religious report higher levels of well-being than do the non-religious, almost no attention has been paid to social interactions in religion. This paper attempts to fill this gap, asking if the well-being premium for the religious depends on the religious behaviour of those around them. It further evaluates these religious overspills not only with respect to denomination, but also two different kinds of religious behaviour: one that might be thought of as at least partly social (going to church) and another that is intensely private (prayer).
It is already known that individuals seem to benefit from their own religious involvement: the religious tend to be happier than the non-religious, ceteris paribus (e.g. Lelkes 2006). However, we know much less about the consequences of this behaviour on others. We might expect any religious spillovers to affect primarily “insiders”, that is those who belong to the same religious group or denomination. This might be because of some kind of local (religious group) social capital, or a “signalling effect” of religious affiliation that can be better interpreted by those who belong to the same religious group.
We appeal to large-scale survey data across Europe including information on both life satisfaction and religion to show that religious spillovers are positive, and affect both insiders and outsiders. The religious like living in regions where there are a greater percentage of religious people, but crucially so do the non-religious. Attempts to explain away this generalised positive religious spillover by measures of local social capital, crime, and measures of trust in others are not successful.
The paper is organised as follows. Section 2 briefly reviews the literature on well-being and religion, and social comparisons in well-being. Section 3 presents the data, and Section 4 the main regression results. Last, Section 5 concludes.
2 Subjective Well-Being and Social Comparisons
There is a very general feeling across much of Social Science that “context matters”. One way of fleshing this out is to consider context as being picked up by what other people who are like me do. The broad idea of social comparisons is that I am more likely to compare to people who are in some way similar to me. This similarity can be operationalised in terms of individual characteristics, such as age, sex and education, or by simple geographical proximity, where we compare to our neighbours. We consider the second of these here.
The idea of social comparisons or spillovers working within a defined geographical area has been appealed to in a number of recent contributions. With respect to comparisons over income, Luttmer (2005) showed that individual life satisfaction was positively correlated with own income, but negatively correlated with a comparison income measure defined as average income by local area in a number of waves of the US National Survey of Families and Households. Analogous findings are reported by Blanchflower and Oswald (2004), Graham and Felton (2006), Helliwell and Huang (2009) and Kingdon and Knight (2007), using American GSS data, data from 18 Latin American countries, Canadian GSS data, and South African SALDRU data respectively.
Changing the focus from a good to a bad, Clark (2003) used British Household Panel Survey (BHPS) data to show that, while unemployment reduced individual well-being, it did so less in regions with higher unemployment rates.1 This finding has been replicated on South-African data by Powdthavee (2007a).
Taking geographical proximity to its natural limit perhaps, other work has considered well-being spillovers between household members.2 Clark (1996) found that individual job satisfaction was negatively correlated with spouse’s wage in the first wave of the BHPS, while Powdthavee (2009) also appealed to the BHPS to show that the relationship between individual self-assessed health and health problems depended on the health problems reported by other household members. Clark and Etilé (2008) show that the link between subjective well-being and own weight (as measured by the BMI) depends critically on the BMI of the individual’s spouse. Last, Powdthavee (2007b) models the general relationship between the well-being of couple members, and Winkelmann (2005) considers the overall structure of well-being within households.
1
Which is consistent with the epidemiological finding that suicide and para-suicide by the unemployed is higher in low unemployment regions (Platt et al., 1992).
2
The idea of comparisons has to our knowledge barely been addressed in the context of one of the most important characteristics of individuals’ lives: their religious behaviour. The only contribution we are aware of is Helliwell (2003), who uses cross-country data from the World Values Survey to show that weekly or more church attendance has positive spillovers on the well-being of others at the national level.
This paper continues this line of reasoning, but makes the distinction between spillovers across denominations and spillovers within denominations using large-scale European multi-country survey data.
3 Data
The European Social Survey (the ESS: freely available from
http://www.europeansocialsurvey.org) is a multi-country survey which has covered 30 different countries at various points over the first three rounds used here (which cover the period between 2003 and 2007). We will have to drop four of these countries, due to missing values on key variables (religion and region). The survey contains information on a wide range of attitudinal and socio-demographic characteristics.3 After excluding respondents who are under 16 or over 80, the total sample size in the 30 countries is 120 137. This figure falls to 86 701 in the regression sample, due to missing values for a number of key variables.4
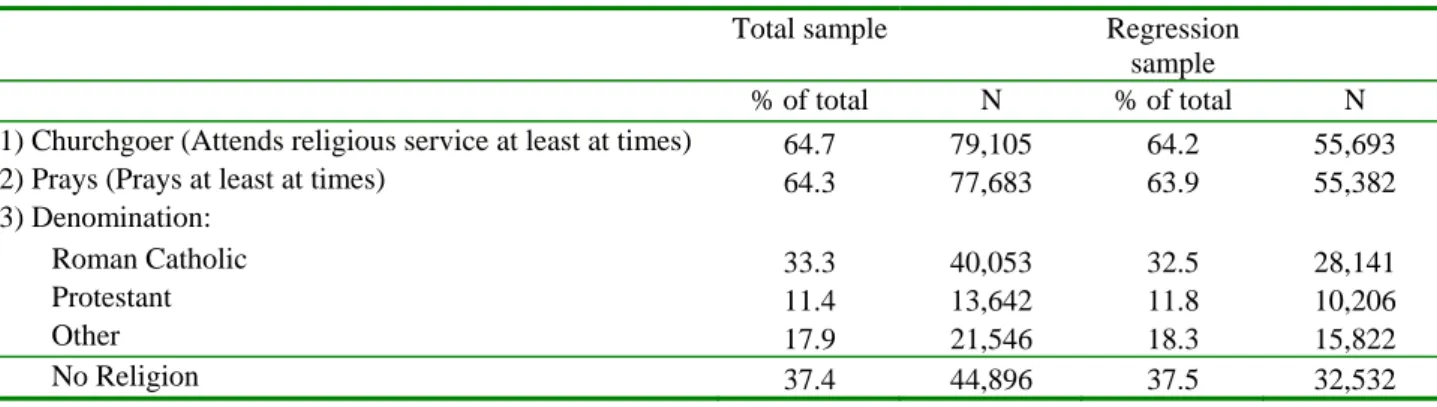
The ESS includes three distinct measures of religiosity in each wave of data: (1) denomination; (2) church attendance; and (3) personal prayer. These are described below.
1) Denomination
All respondents are asked, “Do you consider yourself as belonging to any particular
religion or denomination”?, where it is made clear that belonging to means identifying with, rather than any official membership. The largest denominations are Roman Catholic and Protestant,5 covering 33% and 11% of respondents respectively (Table 1). A number of other religions were mentioned, which we have grouped together as “Other religion”, making up
3
The survey design includes strict quality controls, such as random probability sampling, a minimum target response rate of 70% and rigorous translation protocols. It is reasonable to expect this data to be high quality. See Jowell et al. (2003) for more details.
4
This particularly applies to household income. We check that our key results are qualitatively unchanged when income is excluded as an explanatory variable, yielding a larger sample.
5
Protestants include individuals who consider themselves as any of the following: Protestant (no further detail), Church of England/Anglican, Baptist, Methodist, Presbyterian/Church of Scotland, United Reform Church/Congregational, Free Presbyterian, Brethren, or Other Protestant.
18% of the total sample (this group is predominantly comprised of Eastern Orthodox, 50%, Muslim, 34%, Other Christian denominations, 11%, and Jewish 2%). Last, over one-third of respondents say that do not belong to any particular religion or denomination.
2) Attendance at Religious Services
Respondents are then asked: “Apart from special occasions such as weddings and funerals,
about how often do you attend religious services nowadays”?, with the possible responses
• Every day
• More than once a week • Once a week
• At least once a month • Only on special holy days • Less often
• Never
We calculate a dichotomous measure of churchgoing, indicating if the respondent attends religious services at all, as opposed to those who say “Never”. This hence picks up any religious activity, however irregular it might be.
In the ESS data, 65% of people go to church at least sometimes: 27% go at least once a month, and 38% go only on special holy days or less often. Over one-third of ESS respondents say that they never go to church.
3) Prayer
Last, individuals in the ESS are asked: “Apart from when you are at religious services, how
often, if at all, do you pray”?, with answers on the same scale as for 2) above.
In the ESS, 28% of respondents say that they pray every day, 9% more than once a week, 6% once a week, and 26% less frequently. In total, 64% say that they pray at least sometimes; consequently, 36% of the sample never pray.
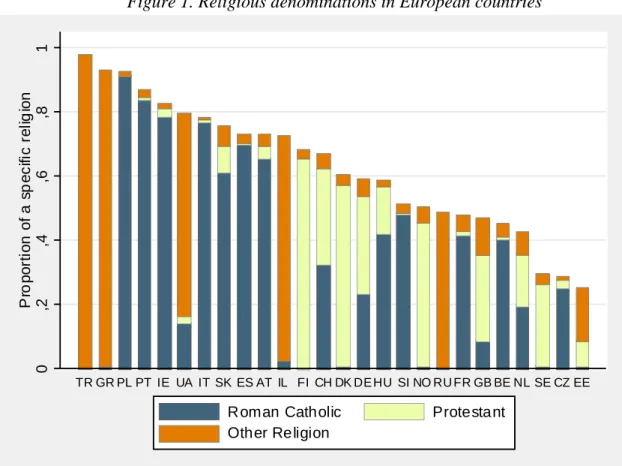
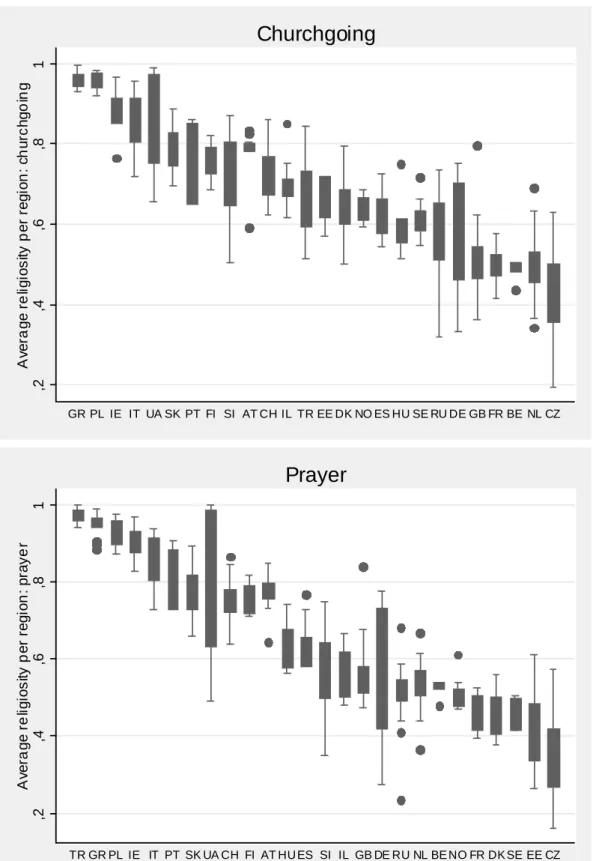
The distribution of these three variables is shown in Table 1, both for the overall sample and for the regression sample. Considering the three aspects of religiosity together, religion is part of the life of the majority of Europeans in one way or another. Roughly two-thirds of respondents say that they currently belong to a religious denomination, or are actively involved in religious activities. However, the individual country figures shown in Table 6 and Figure 1 reveal considerable national variation. In particular, the Greeks, Polish, Turkish and
Irish are the most religious, and the Czechs, the Estonians and the Swedish are the least religious on most counts.
With respect to individual demographic variables, women are more religious than men, especially with respect to prayer. Religiosity also rises with age: those over the age of 65 are the most religious. These findings appear to be very consistent across numerous empirical papers (e.g. de Vaus and McAllister 1987; Iannaccone 1998).
Religiosity is far from being a unique individual attribute, however, which is well-illustrated in the distribution and overlap of our three religiosity measures. Tables 2 and 3 present the cross-tabulations between these measures. About one-third of those who do not consider themselves as belonging to a particular religion actually do undertake religious activities, i.e. prayer or churchgoing. By way of contrast, a non-negligible proportion (15%-20%) of those who say that they belong to a denomination never go to church, with a similar figure pertaining for prayer. As Table 2 shows, prayer is a more prevalent form of religious activity than regular churchgoing for other religions, but there is no significant difference between these two forms of religious activities between Roman Catholics and Protestants, which are the two most prevalent denominations in our data.
Subjective Well-Being
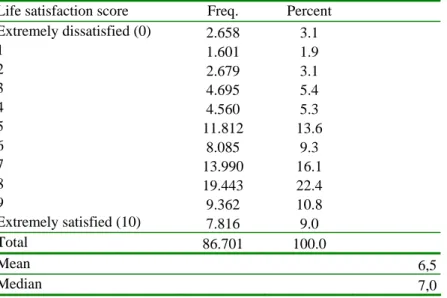
There are two variables measuring subjective well-being in the ESS: life satisfaction and happiness.6 We here use life satisfaction, which is sometimes considered to pick up less ephemeral feelings than happiness. This is measured by the following question:
“All things considered, how satisfied are you with your life as a whole nowadays”?
This question is answered on a scale of 0 to 10, where 0 means extremely dissatisfied and 10 means extremely satisfied. The overall distribution of life satisfaction over the three waves of the ESS is shown in Table 4.
There is, as is usual, evidence of positive skew in the distribution of life satisfaction: most people are found towards the “satisfied” end of the spectrum. The distribution of life satisfaction is very similar in the smaller regression sample to that in the overall sample; as such we only present the former figures. In the multivariate analysis, life satisfaction scores of
6
These measures provide reliable estimates, as shown e.g. by Krueger and Schkade (2008) The authors find that the test-retest correlation of life satisfaction is lower than those typically found for income or education, but “they are probably sufficiently high to support much of the research that is currently being undertaken on
subjective well-being, particularly in studies where group means are compared”. See also the discussion in
0 to 2 will be combined due to small cell sizes. The modal life satisfaction response is eight, while the mean and the median are both around seven. A non-negligible number of respondents report life satisfaction at the top and bottom ends of the scale.
Regional Comparisons
We face the same difficult question as much of the social interaction literature: What is the relevant reference group to which individuals compare, or which defines the context in which they operate?7 Here we use a geographical definition, and relate individual life satisfaction to average religiosity within her region, and hence suppose that any comparison or spillover effects operate mostly at that level.
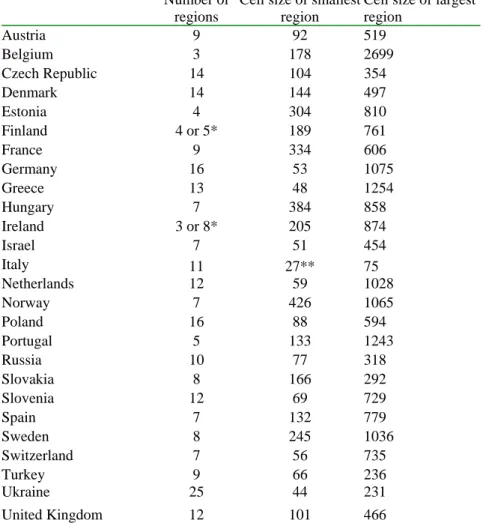
The regions in the dataset are broadly equivalent to the NUTS2 or NUTS3 level in the Eurostat nomenclature for most countries.8 The NUTS nomenclature is based primarily on the institutional divisions currently in force in the Member States (normative criteria), although socio-economic or geographic homogeneity was also taken into account (analytic criteria).9 The regional level is fairly aggregated in some countries, such as Belgium or the UK. For example Belgium is divided into Brussels, Flanders, and Wallonia; UK regions include, amongst others, Wales, Scotland, Northern Ireland, London, and the South East. We suppose that even these large regions present some degree of population homogeneity, and thus can be appealed to as potential reference groups. For the few regions where the number of sample observations was very small, we merged with neighbouring regions. We finally obtain 274 regions for the 26 countries in the regression sample.10 These regions are described in Table 5. There is considerable variation in religious activities across regions in a number of countries, as shown in the regional box and whisker plots in Figure 2. As our regressions include country dummies, it is this variation which enables us to identify religious spillovers. The extent of this variation does not mechanically reflect the number of regions within a particular country (see e.g. Greece and Poland, where there is little variation in religious behaviour across a relatively larger number of regions).
7
One way of getting around this difficulty is to appeal to experimental methods, where information about the reference group can be controlled directly by the experimenter: see Charness and Kuhn (2007) and Clark et al. (2009).
8
NUTS Statistical Regions: see http://europa.eu.int/comm/eurostat/ramon/nuts/splash_regions.html. 9
The basic principles behind the creation and development of NUTS regions are presented at
http://europa.eu.int/comm/eurostat/ramon/nuts/basicnuts_regions_en.html. 10
There is no regional level data for Iceland, and Luxembourg, and there is no information on denominations for Bulgaria and on education level in Cyprus, leading these countries to be excluded from the analysis.
Regression model
Bearing in mind the imperfect match between religious denomination and activity that was apparent in the cross-tabulations, our regression analysis of subjective well-being will control for three different aspects of religiosity: denomination, churchgoing and prayer. We limit our specific analysis to the major religious denominations, including Roman Catholics, Protestants and those who say that they do not belong to any religion. The sample size is generally too small to look at other religions in detail.
We use ordered logit estimation to analyse the relationship between individual life satisfaction on the one hand, and own and regional religiosity on the other. This estimation technique takes into account the ordinal nature of the life satisfaction measure. We control for a number of personal characteristics, apart from personal religiosity, which we expect to be correlated with life satisfaction: sex, age, income, labour market status, health, educational level, and number of children. The country dummies pick up any differences in cultural context (e.g. the way in which subjective questions are answered) and other institutional factors. The religious effect is then identified from differences in religiosity between regions within the same country.
The basic regression estimated is:
LIFE SATISFACTIONit = f(INDIVIDUAL RELIGit, REGIONAL RELIGit, INCOMEit, LABOURMARKETSTit,, HEALTHit, MARITAL STATUSit, Xit)
In this equation, LIFE SATISFACTIONit is satisfaction with life for individual i at wave t. and REGIONAL RELIGit variously measures the regional share of a particular denomination, regional religious activity (churchgoing or prayer), or whether a particular religion is dominant in the region. The variable INDIVIDUAL RELIGit takes three different forms as described above: whether the individual identifies with a particular denomination, is a regular churchgoer, and whether she prays regularly. We will in particular consider interactions between own and regional religiosity: does the effect of others’ religion on my life satisfaction depend on whether I am religious myself? The other right-hand side variables include INCOMEit, measured as the income quartile within the country, based on annual household income corrected for household size,11 labour market status, health conditions, marital status, and Xit, which includes the other personal characteristics and the country and year fixed effects.
11
Equivalent household income is calculated using a scale based on e=0.7. By using equivalent income we attach decreasing weight to each additional household member, e.g. 1 for the first, 0.6 for the second, and 0.5 for the third. We thus take into account economies of scale and the lower consumption of children.
4 Results
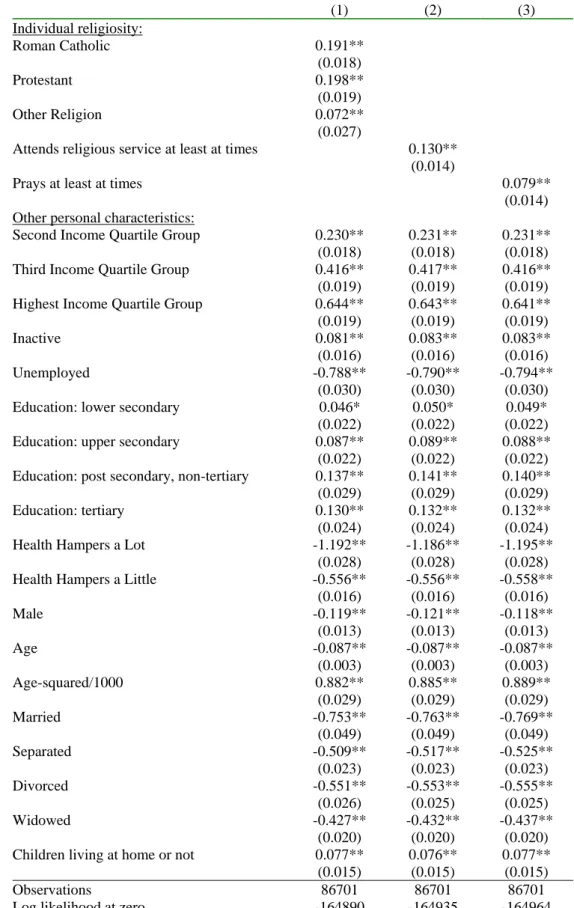
Personal religiosity is positively correlated with life satisfaction. The results in Table 7 show that the religious, by whatever measure, report higher levels of life satisfaction in Europe, even after controlling for age, income, education, labour market status, marital status and country. The estimated coefficients on Roman Catholic and Protestant are both positive and very significant, and are similar in size.12 Churchgoing and personal prayer, in columns 2 and 3 respectively, are also associated with higher life satisfaction, attracting positive and significant estimated coefficients. The positive correlation between religion and well-being is already known in the psychological and sociological literatures, although often from unrepresentative small samples, or only as a bivariate correlation, with attendant spurious correlation problems from omitted variables. The results in Table 7 bring robust confirmation of these earlier findings. What is less well-known is whether my own well-being is affected by others’ religiosity, and whether the extent of the spillover depends on whether I am religious myself. The remainder of this section addresses this issue.
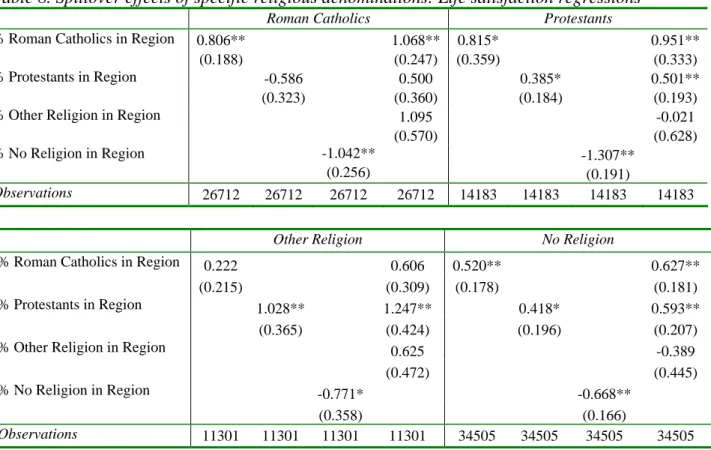
We first test whether the religious denomination of a region affects the well-being of its inhabitants. We consider both “intra-group” and “inter-group effects” (or, in the terminology of Section 1, insiders and outsiders). Table 8 presents the regression coefficients in which we are particularly interested in this context.13 There are four panels in Table 8, corresponding to our four different religious groups (Catholic, Protestants, Other Religions, and No Religion). Each panel corresponds to life satisfaction regressions estimated only on the religious group in question. Within each panel, we include four regional religious variables: the percentage of Catholics, Protestants, Other Religion, and No Religion in the region. The first column includes the percentage of Catholics, the second the percentage of Protestants, the third the percentage of No Religion. The last column in each panel includes variables for the percentage of Catholics, Protestants and Other Religion together. The standard errors are clustered at the regional level.
We first consider insiders, or within-group spillovers. As expected, there are positive spillover effects of religion within the same denomination. Roman Catholics report higher life satisfaction when there are more Roman Catholics in the region, controlling for income, age and so on. In the top-right panel, Protestants similarly benefit from the greater prevalence of
12
There is no significant difference between the two estimated coefficients. 13
All of the regressions estimated in this paper include the non-religious personal controls and country and year dummies in Table 7.
Protestants in the region. The coefficients on both of these religious spillover variables are positive and significant at the 1% level. However, the “insider” spillover from those with no religion in the bottom right panel of Table 7 actually works the other way around: far from being more satisfied in less-religious regions, those with no religion are actually less satisfied as the percentage with no religion rises.
This distinction continues to apply when we consider between-group spillovers. Roman Catholics report lower life satisfaction as the percentage of Protestants rises in column 2 (at the ten per cent level). However, column 4 shows that this partial correlation results because more Protestants corresponds to fewer Catholics in the data. When we hold the percentage of Catholics constant, the coefficient on percentage of Protestants is positive but insignificant. Column 3 shows that the life satisfaction of Catholics is lower in less-religious regions.
The results for Protestants in the top-right panel of Table 8 are analogous to those for Catholics, with the exception that Protestants are also more satisfied in more Catholic regions, even holding the percentage of Protestants constant. This is consistent with Protestants seeing only a permeable distinction between Catholicism and Protestantism (although this religious osmosis is not shared by Catholics in the top-left panel of Table 8).
Those who report belonging to Other Religions are more satisfied as the percentage of Protestants increases, but, as for all religions, less satisfied in less religious regions. The non-religious also report lower levels of life satisfaction in less-non-religious regions, as already noted above for the within-group spillovers. They are however more satisfied as the percentage of either Catholics or Protestants rises.
Overall, Table 8's results suggest that regional religiosity positively affects both those who are of the same denomination, and those who are not religious. Equally, atheists induce negative spillover effects for the religious and the non-religious alike. The religious spillover is therefore generic in nature, and not specific to the respondent’s own religiosity.14
We expect the spillovers from denomination to be the strongest of our three measures, since denomination reflects the institutional aspect of religiosity. Churches set up schools and social support institutions. These may benefit particularly those who identify themselves with that particular church (although this depends on the “targeting” or “exclusivity” of the church itself). This may well be behind the within-group spillover effects.
14
As opposed to the results in Clark (2003), where greater regional unemployment increased the well-being of the unemployed, but reduced the well-being of the employed.
The fact that we also find inter-group spillover effects is consistent with a number of different readings:
• Religious institutions are not exclusive to their members, but rather benefit those outside the religion as well;
• There is a “moral” element to religiosity (as in Smith15
), which gives a positive signal to all others;
• Religiosity as such is positively correlated with pro-social behaviour In Section 5 below we will try to test these different explanations explicitly.
We next carry out an analogous analysis for regional religious activity, calculating the regional percentage of respondents who go to church or pray. The results are summarised in Table 9, where the left-hand panel refers to churchgoing, and the right-hand panel to prayer.
Table 9 shows that greater regional churchgoing or prayer has positive spillover effects on everyone, independently of whether they themselves indulge in the activity or not. The coefficients of both the regional percentage of churchgoers and of prayers are positive and significant at better than the one per cent level for all of the spillovers (churchgoing or prayer; within-group or between group). As for religious denominations in Table 8, there are generic positive spillover effects from religious activity.
Robustness Tests
We can test the robustness of these results via an alternative measure of well-being, self-reported happiness. The ESS also contains information on how individuals rate their overall happiness (“Taking all things together, how happy would you say you are?”). Happiness is rated on the same 0 to 10 scale as overall life satisfaction. As the life satisfaction and overall happiness questions are not adjacent in the questionnaire, the latter can be used as a test of reliability and inter-temporal stability of the former. All of our main life satisfaction results above continue to hold with happiness as the dependent variable.
We also test for heterogeneity in these religious spillovers by re-estimating Table 9 separately for women and men: the results are shown in Table 10. Both religious activities continue to have positive spillover effects, both within and between groups, for both men and women. One intriguing difference is that the spillovers from regional churchgoing churchgoing (praying) are greater for religious women than non-religious women. This
15
Adam Smith believed that religious participation could be explained by its positive effect on human capital: religion increases the capital value of reputation by providing moral information about individuals (see Anderson, 1998).
distinction is not found for men, where everyone benefits equally from regional religiosity. The positive within-group returns from religion, whatever these represent, then seem to be greater for women. Alternatively, religious social comparisons are stronger for women, who are either more likely to define their reference group by religion, or whose well-being is more strongly affected by such comparisons. Separate work on the ESS data has found similar gender differences in the role of religion during difficult life events (Clark and Lelkes, 2008): women are helped more (or in certain cases “punished” more) by their religion in hard times than were men.
The analysis so far has used linear measures of regional religiosity (the percentage). However, it may not be the sheer size of religious groups which matters as such, but rather there may be a critical cut-off point, above which these spillover effects occur. Religious communities may then be expected to have greater impact once they reach a critical size, in order to establish and operate institutions, or possibly have a “visible/tangible” impact on social norms. We therefore explore the effect of belonging to the dominant denomination in the region.
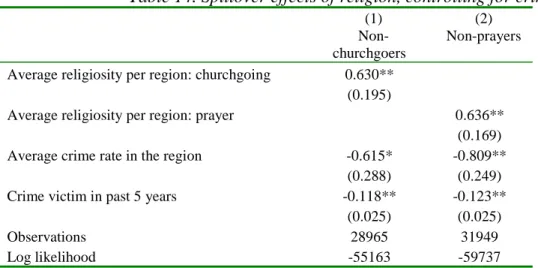
We interact religious dominance, defined as being the largest religious group (including “no religion”), with the individual’s own religion. This allows us to ask questions like: Do Protestants suffer if they live in a dominantly Catholic area? Do “atheists” enjoy the company of the religious, as we found above, even when these people constitute a majority? Table 11 presents the regression results including dummy variables for Catholic majority region and Protestant majority region, estimated separately for the four same religious groups as in Table 8. Roman Catholics are more satisfied when their own church dominates, while Protestants report higher life satisfaction when either Protestantism or Catholicism is the dominant religion. The other religions, including Eastern Orthodox, Muslims and Jews, are not significantly affected by these dominant religion variables. In the last column, those with no religion are more satisfied living in regions where religion dominates, be it Catholic or Protestant.
Why do the Protestants benefit equally from being in the majority and in the minority (when the dominant religion is Catholic)? We have a number of tentative explanations which are consistent with this pattern, although we cannot provide direct tests of any of them.
A first suggestion is that this result is consistent with greater religious tolerance of Protestantism. Protestants might be used to being a minority church in some regions, so they may simply benefit from the positive spillover effects of institutional religion, be it Catholic or Protestant. This might also reflect the different institutional structure of these churches:
while Protestantism is more decentralised, with local communities enjoying a greater autonomy, the Roman Catholic Church is still overall more hierarchical. In short, as Protestants do not have a “Rome”, their own local religious environment plays a greater role in how they experience their own religion. Last, the Catholic Church may operate more institutions (schools, hospitals, etc.) which are more open to non-Catholics than are Protestant institutions.
5 Explanations of Inter-group Religious Spillovers
While within-group spillovers might be expected to a certain extent, the finding of inter-group spillovers is perhaps more surprising: why does religion benefit those who are not of the same religion, or even not religious at all? We list three ideas below:
• Religious institutions are not exclusive to their members, but rather create social capital in which all share;
• Religion reduces crime.
• There is a “moral” element of religiosity (as argued by Adam Smith), which produces a positive signal to others, enabling Pareto-superior outcomes to be realised;
We are able to explore all three of these, using the ESS data.
A) Social Capital
It is true that religious people are more likely to be altruistic and create social capital (using measures which show whether the individual has social contacts, helps others, participates in organizations, carries out voluntary work, or donates money), controlling for other personal characteristics, country and year. This holds for all three measures of religiosity: churchgoing, prayer and religious denomination.
Individuals value these social outcomes, reporting higher life satisfaction in regions where social capital is higher. The obvious ensuing question is then whether these good outcomes explain the positive spillovers from religion. This is what we examine in Table 12. As we are considering inter-group spillovers here, we look at the effect of living in a churchgoing region on those who do not go to church (carrying out the same analysis using prayer, rather than churchgoing, produces the same results).
We introduce the five social capital variables in turn to see whether they affect the size of the regional churchgoing coefficient: with the standard set of controls in the first column of Table 9, this was estimated to be 0.757, and significant at the one per cent level. In each
column, we introduce both the individual’s own participation in the activity, and the regional rate of the activity.
All of the estimated coefficients on own social activities are positive, although that on own donation of money to voluntary organizations is not significant at conventional levels.16 We are not making a strong statement about causality here, but want to be sure that the regional social capital variables are not just acting as instruments for own social capital. The regional social capital variables are mostly positive, although not significant. The exception is the regional rate of social contacts, which attracts a negative and significant coefficient. It is possible that there are social comparisons in terms of these kinds of social activities, so that one’s own social activity is judged in the light of what others are doing: in this case others’ social activities also produce overspills, but this time negative.17
The key result from Table 12 is that none of these five types of social capital significantly alters the size of the regional churchgoing variable in the first line of the life satisfaction regression, which remains significant at the one per cent level with a coefficient varying between 0.789 and 0.684.
B) Crime
Crime and religion are negatively correlated, which might explain the inter-group spillover. In the ESS data, individuals are less likely to say that they have been a victim of crime in more religious regions (where a greater percentage of individuals are churchgoers, prayers, or Catholic or Protestant), controlling for other personal characteristics. Table 14 shows the effect of regional churchgoing on non-churchgoers, and the effect of regional prayer on non-prayers, once we control for criminality.
The results are qualitatively identical across the two regressions. The regional crime rate is negatively associated with life satisfaction, as is the fact of having been a crime victim oneself in the past five years. However, these criminality measures have no significant impact on the regional religiosity variables, which remain positive and significant at all conventional levels.
16
These are the partial correlations for non-churchgoers; those for churchgoers are very similar. 17
Contrary to popular belief, suicides, which reflect an extreme form of low well-being tend to peak in the spring and early summer. One explanation is that other people’s social activities (which make one’s own look worse) are more visible in these seasons.
C) Trust
Religious people may be seen as more trustworthy, which enables everyone (including the non-religious) to achieve better outcomes. In the ESS, we do have a measure of whether individuals trust others. Respondents are asked whether “Most people can be trusted or you
can't be too careful”, with responses on a 0-10 scale, with higher values indicating greater
trust. The majority of people give replies of 5 to 8 on this scale, but substantial numbers give lower scores too. Adding this variable to a standard life satisfaction equation, such as that in Table 7, produces positive and very significant coefficients, while not affecting the significance of the own religion variables.
Equally, the trust variables also attract positive significant coefficients when added to the regional religious overspill equations reported in Tables 8 and 9. Crucially, however, others’ religion continues to be positively associated with life satisfaction, even controlling for the individual’s self-reported trust towards others.
In sum, while all of social capital, crime and trust are eminently sensible ideas (and all “work” in the right direction) none of them explain the positive spillovers from others’ religion on the non-religious. There must therefore be some other proximate mechanism via which living in the proximity of the religious is valuable, not only for the religious but also for the non-religious. These alternative mechanisms might include preferences for marriage (own and one’s children’s) within one’s own faith (as in Bisin et al., 2004), or the presence of religious institutions (e.g. schools, kindergartens and hospitals). We do not have direct information on such public goods (nor on the degree to which they are actually public). We did experiment with seeing whether the effect of others’ religion was greater for those in poor health, or with children living at home, neither of which produced significant estimates. Finer-grained datasets allowing local public goods (church-run and otherwise) would be a valuable addition to this research.
6 Conclusion
The religious are more satisfied with their lives in pooled multi-country European data, even after controlling for age, income, education, labour market status, health condition, marital status and country. This holds for religious denomination, churchgoing and personal prayer. The estimated coefficients on Roman Catholic and Protestant are both positive and significant at the one per cent level in a life satisfaction equation, and are similar in size. Equally, religious activities, both churchgoing and prayer, attract positive and significant
estimated coefficients. These results are consistent with those in the existing psychological and sociological literatures, although these latter are often based on unrepresentative small samples, or come from bivariate correlations.
Our finding on the spillover effects of regional religiosity are more unusual. In particular, we show that average religious activity in the reference group (here the region) is positively correlated with the well-being of both those who are religious and those who are not. These findings prevail for all three measures of religion used here: denomination, churchgoing and prayer. By way of contrast, a higher regional share of “atheists” (those who say they do not currently belong to any religious denomination) has negative spillover effects, reducing the subjective well-being of the religious and the non-religious alike.
There are strong inter-group spillovers between the religious and atheists. There are also asymmetric spillover effects between Roman Catholics and Protestants: while Protestants are happier when there are more Catholics in the region, the reverse is not true. This is consistent with Protestants having perhaps a broader view of the church than Catholics.
While our results broadly suggest positive spillovers from others’ religiosity, we have identified one area in which the interaction is negative. We asked whether individuals are more satisfied when they live in a region in which their own religion is dominant. Roman Catholics are indeed more satisfied when they are in the dominant religion; Protestants are indifferent to the dominance or otherwise of Protestantism in the region. The negative religious spillover here would result from an increasing number of individuals who belong to other religions who could potentially make Catholics lose their dominance. This kind of non-linearity in interactions is only rarely analysed, with most work being based on linear-in-means models,18 and likely merits further work.
The positive relationship between regional religiosity and the life satisfaction of the non-religious is particularly intriguing. We have explicitly tried to model the transmission mechanism by considering social capital, crime and trust. All of these both increase life satisfaction and are positively correlated with religion. While the estimated coefficients on these variables are as expected in life satisfaction regressions, the positive spillover of religion for the non-religious remains. Alternative explanations might include local religious public goods (e.g. schools, kindergartens and hospitals) which provide services to the non-religious.
Overall, the positive effect of religion on well-being would seem to have been underestimated if anything by the existing literature, which has not taken into account the
18
effect that my own religious behaviour has on others around me. These spillovers are often positive and significant. One intriguing aspect of them is that they avoid the typical endogeneity problems that plague estimation of subjective well-being equations. While my own happiness might lead me to go to church (to give thanks perhaps), my own happiness is far less likely to affect others’ religious decisions.
It remains possible that the regional results reflect an omitted variable, which is both positively associated with religion and which increases individuals’ well-being, although we do not have a firm idea of what this might be. Equally, if we believe in the interaction results, it would be useful to identify more precisely the channels through which they work. With the data at hand we have been able to look at social capital, crime and trust. All of these are indeed important correlates of individual well-being, but do not explain why people are better-off with religious neighbours, whether they be religious themselves or not. The standard call for future research seems more than usually apposite in this case.
The current paper has concentrated on the benefits from religion, perhaps because we have not been able to clearly identify any costs, either at the individual or the more aggregated level. At least in terms of life satisfaction, religion is the opium of the people. However, having identified a correlation does not necessarily mean that we can do anything about it. It might be extraordinarily difficult, financially or morally, to make people more religious. Churches are often subsidised: a fully worked-out analysis of this subsidy should take into account the religiosity-subsidy elasticity, and the effect of religion on well-being, but also the opportunity cost of not having some other public expenditure which would likely also have been valued (see Bjørnskov et al. 2007). The use of subjective well-being data to inform optimal policy in a wide variety of domains such as this will likely remain an intriguing subject for research.
Table 1. Measures of religiosity in 26 European countries, 2003-2007
Total sample Regression
sample
% of total N % of total N
1) Churchgoer (Attends religious service at least at times) 64.7 79,105 64.2 55,693 2) Prays (Prays at least at times) 64.3 77,683 63.9 55,382 3) Denomination:
Roman Catholic 33.3 40,053 32.5 28,141
Protestant 11.4 13,642 11.8 10,206
Other 17.9 21,546 18.3 15,822
No Religion 37.4 44,896 37.5 32,532
Notes: Pooled cross-sections from the ESS (2003, 2005 and 2007). N=120137 (total sample); N=86701 (regression sample). Weighted frequencies. The “total sample” covers the original ESS sample restricted to individuals between the ages of 16 and 80, and excludes Bulgaria, for which there is no denomination information.
Table 2. Churchgoing and prayer by religious denomination (%)
Churchgoer Prays Roman Catholic 85.6 85.9 Protestant 80.2 79.1 Other 80.9 88.0 No Religion 32.7 28.3 Total 64.2 63.9
Notes: Pooled cross-sections from the ESS (2003, 2005 and 2007). N=86701 (regression sample). Weighted frequencies.
Table 3. Prayer and churchgoing
Churchgoing No Yes Total No 72.7 15.8 36.1 Prayer Yes 27.3 84.2 63.9 Total 100.0 100.0 100.0
Notes: Pooled cross-sections from the ESS (2003, 2005 and 2007). N=86701 (regression sample). Weighted frequencies.
Table 4. The distribution of life satisfaction in European countries Life satisfaction score Freq. Percent
Extremely dissatisfied (0) 2.658 3.1 1 1.601 1.9 2 2.679 3.1 3 4.695 5.4 4 4.560 5.3 5 11.812 13.6 6 8.085 9.3 7 13.990 16.1 8 19.443 22.4 9 9.362 10.8 Extremely satisfied (10) 7.816 9.0 Total 86.701 100.0 Mean 6,5 Median 7,0
Notes: Pooled cross-sections from the ESS (2003, 2005 and 2007). N=86701 (regression sample). Weighted frequencies.
Table 5. Level and size of regions by country
Number of
regions
Cell size of smallest region
Cell size of largest region Austria 9 92 519 Belgium 3 178 2699 Czech Republic 14 104 354 Denmark 14 144 497 Estonia 4 304 810 Finland 4 or 5* 189 761 France 9 334 606 Germany 16 53 1075 Greece 13 48 1254 Hungary 7 384 858 Ireland 3 or 8* 205 874 Israel 7 51 454 Italy 11 27** 75 Netherlands 12 59 1028 Norway 7 426 1065 Poland 16 88 594 Portugal 5 133 1243 Russia 10 77 318 Slovakia 8 166 292 Slovenia 12 69 729 Spain 7 132 779 Sweden 8 245 1036 Switzerland 7 56 735 Turkey 9 66 236 Ukraine 25 44 231 United Kingdom 12 101 466 * The size of regions varies by survey year.
** Regions with fewer than 40 observations were merged, except Sardinia, which is an island. Here, the number of observations is 27.
Notes: Pooled cross-sections from the ESS (2003, 2005 and 2007). N=86701 (regression sample). Weighted frequencies.
Level of regions: NUTS1 or NUTS2, see http://europa.eu.int/comm/eurostat/ramon/nuts/splash_regions.html. In some cases, regions were merged, due to the small number of observations.
Figure 1. Religious denominations in European countries 0 ,2 ,4 ,6 ,8 1 P ro p or ti on of a s p ec ifi c r e lig ion TR GR PL PT IE UA IT SK ES AT IL FI CH DK DE HU SI NO RU FR GB BE NL SE CZ EE R oman Catholic Protestant
Other Religion
Notes: Pooled cross-sections from the ESS (2003, 2005 and 2007). N=86701 (regression sample). Weighted frequencies. Measure of religiosity: self-reported identification with a particular religion or denomination
Figure 2. Average regional religiosity in European countries ,2 ,4 ,6 ,8 1 A ver a g e r e lig ios ity p e r r e g ion : c h ur c hgo in g GR PL IE IT UA SK PT FI SI AT CH IL TR EE DK NO ES HU SE RU DE GB FR BE NL CZ
Churchgoing
,2 ,4 ,6 ,8 1 A ver a g e r e lig ios ity p e r r e g ion : pr a y e r TR GR PL IE IT PT SK UA CH FI AT HU ES SI IL GB DE RU NL BE NO FR DK SE EE CZPrayer
Notes: Pooled cross-sections from the ESS (2003, 2005 and 2007). N=86701 (regression sample). Weighted frequencies. Box and Whisker plots: horizontal line in the box=median; lower hinge=25th percentile; upper hinge=75th percentile; horizontal lines outside the box=lower or upper adjacent values; dots=outside values.
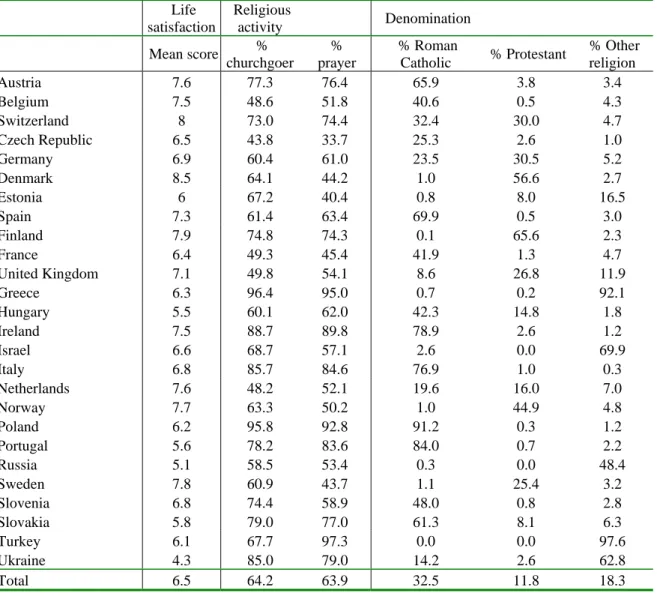
Table 6. Life satisfaction and religiosity by country Life satisfaction Religious activity Denomination Mean score % churchgoer % prayer % Roman Catholic % Protestant % Other religion Austria 7.6 77.3 76.4 65.9 3.8 3.4 Belgium 7.5 48.6 51.8 40.6 0.5 4.3 Switzerland 8 73.0 74.4 32.4 30.0 4.7 Czech Republic 6.5 43.8 33.7 25.3 2.6 1.0 Germany 6.9 60.4 61.0 23.5 30.5 5.2 Denmark 8.5 64.1 44.2 1.0 56.6 2.7 Estonia 6 67.2 40.4 0.8 8.0 16.5 Spain 7.3 61.4 63.4 69.9 0.5 3.0 Finland 7.9 74.8 74.3 0.1 65.6 2.3 France 6.4 49.3 45.4 41.9 1.3 4.7 United Kingdom 7.1 49.8 54.1 8.6 26.8 11.9 Greece 6.3 96.4 95.0 0.7 0.2 92.1 Hungary 5.5 60.1 62.0 42.3 14.8 1.8 Ireland 7.5 88.7 89.8 78.9 2.6 1.2 Israel 6.6 68.7 57.1 2.6 0.0 69.9 Italy 6.8 85.7 84.6 76.9 1.0 0.3 Netherlands 7.6 48.2 52.1 19.6 16.0 7.0 Norway 7.7 63.3 50.2 1.0 44.9 4.8 Poland 6.2 95.8 92.8 91.2 0.3 1.2 Portugal 5.6 78.2 83.6 84.0 0.7 2.2 Russia 5.1 58.5 53.4 0.3 0.0 48.4 Sweden 7.8 60.9 43.7 1.1 25.4 3.2 Slovenia 6.8 74.4 58.9 48.0 0.8 2.8 Slovakia 5.8 79.0 77.0 61.3 8.1 6.3 Turkey 6.1 67.7 97.3 0.0 0.0 97.6 Ukraine 4.3 85.0 79.0 14.2 2.6 62.8 Total 6.5 64.2 63.9 32.5 11.8 18.3
Notes: Pooled cross-sections from the ESS (2003, 2005 and 2007). N=86701 (regression sample). Weighted frequencies.
Table 7. Life satisfaction and individual religiosity. Ordered logit regressions (1) (2) (3) Individual religiosity: Roman Catholic 0.191** (0.018) Protestant 0.198** (0.019) Other Religion 0.072** (0.027) Attends religious service at least at times 0.130**
(0.014)
Prays at least at times 0.079**
(0.014)
Other personal characteristics:
Second Income Quartile Group 0.230** 0.231** 0.231**
(0.018) (0.018) (0.018)
Third Income Quartile Group 0.416** 0.417** 0.416**
(0.019) (0.019) (0.019)
Highest Income Quartile Group 0.644** 0.643** 0.641**
(0.019) (0.019) (0.019)
Inactive 0.081** 0.083** 0.083**
(0.016) (0.016) (0.016)
Unemployed -0.788** -0.790** -0.794**
(0.030) (0.030) (0.030)
Education: lower secondary 0.046* 0.050* 0.049*
(0.022) (0.022) (0.022)
Education: upper secondary 0.087** 0.089** 0.088**
(0.022) (0.022) (0.022)
Education: post secondary, non-tertiary 0.137** 0.141** 0.140**
(0.029) (0.029) (0.029)
Education: tertiary 0.130** 0.132** 0.132**
(0.024) (0.024) (0.024)
Health Hampers a Lot -1.192** -1.186** -1.195**
(0.028) (0.028) (0.028)
Health Hampers a Little -0.556** -0.556** -0.558**
(0.016) (0.016) (0.016) Male -0.119** -0.121** -0.118** (0.013) (0.013) (0.013) Age -0.087** -0.087** -0.087** (0.003) (0.003) (0.003) Age-squared/1000 0.882** 0.885** 0.889** (0.029) (0.029) (0.029) Married -0.753** -0.763** -0.769** (0.049) (0.049) (0.049) Separated -0.509** -0.517** -0.525** (0.023) (0.023) (0.023) Divorced -0.551** -0.553** -0.555** (0.026) (0.025) (0.025) Widowed -0.427** -0.432** -0.437** (0.020) (0.020) (0.020)
Children living at home or not 0.077** 0.076** 0.077**
(0.015) (0.015) (0.015)
Observations 86701 86701 86701
Log likelihood at zero -164890 -164935 -164964
Notes. Reference categories: no religion, lowest income quartile group, paid work, primary education or below, health does not hamper, never married. The models include personal controls and country and year dummies. Standard errors in parentheses. * significant at 5%; ** significant at 1%
Table 8. Spillover effects of specific religious denominations: Life satisfaction regressions
Roman Catholics Protestants
% Roman Catholics in Region 0.806** 1.068** 0.815* 0.951** (0.188) (0.247) (0.359) (0.333) % Protestants in Region -0.586 0.500 0.385* 0.501**
(0.323) (0.360) (0.184) (0.193)
% Other Religion in Region 1.095 -0.021
(0.570) (0.628)
% No Religion in Region -1.042** -1.307**
(0.256) (0.191)
Observations 26712 26712 26712 26712 14183 14183 14183 14183
Other Religion No Religion
% Roman Catholics in Region 0.222 0.606 0.520** 0.627** (0.215) (0.309) (0.178) (0.181) % Protestants in Region 1.028** 1.247** 0.418* 0.593** (0.365) (0.424) (0.196) (0.207)
% Other Religion in Region 0.625 -0.389
(0.472) (0.445)
% No Religion in Region -0.771* -0.668**
(0.358) (0.166)
Observations 11301 11301 11301 11301 34505 34505 34505 34505
Notes. Ordered logit estimates. The models include personal controls and country and year dummies. Robust standard errors in parentheses. * significant at 5%; ** significant at 1%
Table 9. Spillover effects of religious activities: Life satisfaction regressions
Not Churchgoer Churchgoer Not Prayer Prayer
% Churchgoers in Region 0.757** 1.105** (0.189) (0.149)
% Prays in Region 0.855** 0.711**
(0.167) (0.174)
Observations 29017 57684 54699 32002
Notes. Ordered logit estimates. The models include personal controls and country and year dummies. Robust standard errors in parentheses. * significant at 5%; ** significant at 1%.
Table 10. Spillover effects of religious activities by gender
Men Not Churchgoer Churchgoer Not Prayer Prayer
% Churchgoers in Region 0.864** 0.891** (0.195) (0.194)
% Prays in Region 0.755** 0.629**
(0.197) (0.211)
Observations 15477 25441 18722 22196
Women Not Churchgoer Churchgoer Not Prayer Prayer
% Churchgoers in Region 0.642* 1.266** (0.255) (0.167)
% Prays in Region 0.653** 0.990**
(0.240) (0.185)
Observations 13540 32243 13280 32503
Notes. Dependent variable: self-reported life satisfaction. Ordered logit estimates. The models include personal controls and country and year dummies. Robust standard errors in parentheses. * significant at 5%; ** significant at 1%
Table 11. Spillover effects of the dominant denomination
Roman Catholics Protestants Other Religion No Religion
Dominant Religion in Region is Catholic 0.109* 0.350** 0.027 0.116** (0.044) (0.072) (0.121) (0.043) Dominant Religion in Region is Protestant -0.003 0.257** 0.167 0.186**
(0.079) (0.048) (0.136) (0.044)
Observations 26712 14183 11301 34505
Notes: Dominant denomination defined at the regional level. Dependent variable: self-reported life satisfaction. Ordered logit estimates. The models include personal controls and country and year dummies. Standard errors in parentheses. * significant at 5%; ** significant at 1%
Table 12. Spillover effects of religion on the non-religious: the role of social capital (1) Social contacts (2) Help others (3) Participate in organizations (4) Donation (5) Voluntary work Average religiosity per region: churchgoing 0.789** 0.764** 0.726** 0.733** 0.684**
(0.192) (0.188) (0.187) (0.185 (0.189
% in the region who meets with friends or
relatives at least once a month -0.287**
(0.109) Meets friends, relatives or colleagues at least
once a month 0.149**
(0.008)
Regional % who help others 0.129
(0.131)
Help other more than once a month (not
counting voluntary work) 0.141**
(0.037)
Regional % who participate in voluntary
organizations 0.278
(0.318)
Participated in voluntary organization
activities in the last year 0.097*
(0.039)
Regional % who donate money to voluntary
organizations 0.461
(0.453
Donated money to voluntary organizations in
the last year 0.061
(0.040
Regional % who do voluntary work 1.050
(0.715
Voluntary work in the last year 0.129**
(0.049 Observations 28967 29017 29017 29017 2901 Log likelihood -54979 -55283 -55287 -55289 -55284 ) ) ) ) ) ) 7
Notes. Dependent variable: self-reported life satisfaction. Ordered logit estimates on the sub-sample of individuals who never go to church. The models include personal controls and country and year dummies. Standard errors in parentheses. * significant at 5%; ** significant at 1%
Table 14. Spillover effects of religion, controlling for crime (1) Non-churchgoers (2) Non-prayers
Average religiosity per region: churchgoing 0.630**
(0.195) Average religiosity per region: prayer 0.636**
(0.169)
Average crime rate in the region -0.615* -0.809**
(0.288) (0.249)
Crime victim in past 5 years -0.118** -0.123**
(0.025) (0.025)
Observations 28965 31949
Log likelihood -55163 -59737
Notes. Dependent variable: self-reported life satisfaction. Ordered logit estimates. The regressions are estimated on the sub-sample of those who never go to church (column 1) and those who never pray (column 2). The models include personal controls and country and year dummies. Standard errors in parentheses. * significant at 5%; ** significant at 1%
References
Anderson, G. M., (1998). “Mr. Smith and the preachers: the economics of religion in the wealth of nations”. Journal of Political Economy, 96, 1066-1088.
Bisin, A., Topa, G. and Verdier, T. (2004). “Religious Intermarriage and Socialization in the United States”. Journal of Political Economy, 112, 615-664.
Bjørnskov, C., Dreher, A. and Fischer, J. (2007). “The Bigger the Better? Evidence of the Effect of Government Size on Life Satisfaction around the World”. Public Choice, 130, 267-292.
Blanchflower, D.G. and Oswald, A.J. (2004). “Well-being over time in Britain and the USA”.
Journal of Public Economics, 88, 1359-1386.
Charness, G. and Kuhn, P. (2007). “Pay Inequality, Pay Secrecy, and Effort: Theory and Evidence”. Journal of Labor Economics, 25, 693-723.
Clark, A.E. (1996). “L'utilité est-elle relative? Analyse à l'aide de données sur les ménages”.
Economie et Prévision, 121, 151-164.
Clark, A.E. (2003). “Unemployment as a Social Norm: Psychological Evidence from Panel Data”. Journal of Labor Economics, 21, 323-351.
Clark, A.E. and Etilé, F. (2008). “Happy House: Spousal Weight and Individual Well-Being”. PSE, mimeo.
Clark, A.E., Frijters, P. and Shields, M. (2008). “Relative Income, Happiness and Utility: An Explanation for the Easterlin Paradox and Other Puzzles”. Journal of Economic
Literature, 46, 95-144.
Clark, A.E. and Lelkes, O. (2008). “Deliver Us From Evil: Religion as Insurance”. PSE, mimeo.
Clark, A.E. and Lohéac, Y. (2007). “It wasn't me, It was them! A Study of Social Influence in Risky Behaviour by Adolescents”. Journal of Health Economics, 26, 763-784.
Clark, A.E., Masclet, D. and Villeval, M.-C. (2009). “Effort and Comparison Income”,
Industrial and Labor Relations Review, forthcoming.
de Vaus, D. and McAllister, I. (1987). “Gender differences in religion: A test of the structural location theory”. American Sociological Review, 52, 472-481.
Graham, C. and Felton, A. (2006). “Inequality and happiness: Insights from Latin America”.
Journal of Economic Inequality, 4, 107-122.
Helliwell, J.F. (2003). “How's Life? Combining Individual and National Variables to Explain Subjective Well-Being”. Economic Modelling, 20, 331-360.
Helliwell, J.F. and Huang, H. (2009). "How’s the Job? Well-Being and Social Capital in the Workplace". Industrial and Labor Relations Review, forthcoming.
Iannaccone, L.R. (1998). “Introduction to the economics of religion”. Journal of Economic
Literature, 36, 1465-1495.
Jowell, R. and the Central Co-ordinating Team, E.S.S. (2003). “Technical Report”. Centre for Comparative Social Surveys, City University, mimeo.
Kingdon, G. and Knight, J. (2007). “Community, Comparisons and Subjective Well-being in a Divided Society”. Journal of Economic Behavior and Organization, 64, 69-90.
Krueger, A. and Schkade, D. (2008). “The Reliability of Subjective Well-Being Measures”.
Journal of Public Economics, 92, 1833-45.
Lelkes, O. (2006). “Tasting Freedom: Happiness, religion and economic transition”. Journal
of Economic Behavior and Organization 59, 173-194.
Luttmer, E. (2005). “Neighbors as Negatives: Relative Earnings and Well-Being”. Quarterly
Journal of Economics, 120, 963-1002.
Moore, S. and Shepherd, J. (2007). “The Elements and Prevalence of Fear”. The British
Journal of Criminology, 47, 154-162.
Platt, S., Micciolo, R. and Tansella, M. (1992). “Suicide and Unemployment in Italy: Description, Analysis and Interpretation of Recent Trends”. Social Science & Medicine,
34, 1191-1201.
Powdthavee, N. (2007a). “Are There Regional Variations in the Psychological Cost of Unemployment in South Africa?” Social Indicators Research, 80, 629-652.
Powdthavee, N. (2007b). “I Can't Smile Without You: A Multi-level and Fixed Effects Simultaneous Equations Analysis of Spousal Correlation in Life Satisfaction”. Institute of Education, Mimeo.
Powdthavee, N. (2009). “Ill-Health as a Social Norm: Evidence from Other Peoples' Health Problems”. Social Science and Medicine, forthcoming.
Winkelmann, R. (2005). “Subjective Well-Being and the Family: Results from an ordered probit model with multiple random effects”. Empirical Economics, 30, 749-761.