HAL Id: cea-03177557
https://hal-cea.archives-ouvertes.fr/cea-03177557
Submitted on 23 Mar 2021HAL is a multi-disciplinary open access archive for the deposit and dissemination of sci-entific research documents, whether they are pub-lished or not. The documents may come from teaching and research institutions in France or abroad, or from public or private research centers.
L’archive ouverte pluridisciplinaire HAL, est destinée au dépôt et à la diffusion de documents scientifiques de niveau recherche, publiés ou non, émanant des établissements d’enseignement et de recherche français ou étrangers, des laboratoires publics ou privés.
Tests with the same non-linear specimen to evaluate the
performance of the european shaking tables
J. Queval, R. Bairrao, T. Payen
To cite this version:
J. Queval, R. Bairrao, T. Payen. Tests with the same non-linear specimen to evaluate the performance of the european shaking tables. SMiRT 18 -18th International Conference on Structural Mechanics in Reactor Technology, Aug 2005, Beijing, China. pp.3457-3468. �cea-03177557�
18th International Conference on Structural Mechanics in Reactor Technology (SMiRT 18) Beijing, China, August 7-12, 2005 SMiRT18- K12-3
1 Copyright © 2005 by SMiRT18
TESTS WITH THE SAME NON-LINEAR SPECIMEN TO EVALUATE
THE PERFORMANCE OF THE EUROPEAN SHAKING TABLES
J.C. QUEVAL
CEA-Saclay France
Phone:+33(0)169086652, Fax: 8331
E-mail:
[email protected]
R.BAIRRAO
LNEC-Lisbon Portugal
Phone: +351218443824, Fax: 3035
E-mail:
[email protected]
T. PAYEN
CEA-Saclay France
Phone:+33(0)169087986, Fax: 8331
E-mail:
[email protected]
ABSTRACTPrevious studies within former European Consortia of Earthquake Shaking Tables, have investigated and compared how well the different shaking tables of these consortia could execute the same task using identical elastic test pieces. It has resulted in a control enhancement at all the facilities. Being then necessary that similar comparison tests be developed with extension to non-linear behavior, the largest possible specimen, specifically designed for that purpose, was built and tested on three very different shaking tables. This test specimen was designed to reproduce the global non-linear behavior of a concrete building while being damaged during an earthquake, concerning a typical global stiffness reduction. This system, being able to simulate a sudden collapse or a progressive degradation, can reproduce, in a repetitive and accurate way, the same non-linear conditions. In the present paper the design of the test specimen is discussed and the results of the first tests are presented. Keywords: Shaking tables - Controllers.
1. INTRODUCTION
A concerted effort has been made, since the beginning of the nineties, by the main partners of the NEFOREEE project (New Fields of Research in Earthquake Engineering Experimentation) to study the way in which shaking tables, and later reaction walls, really behaved. That is to say, the fidelity with which a specified input could actually be applied to a test-specimen, bearing in mind the mechanical and control imperfections.
In fact, several studies concluded in the framework of previous European Consortia of Earthquake Shaking Tables (ECOEST) have investigated and compared the performances of the main European shaking tables and how well they could execute the same task using identical elastic test specimens Refs. [1,2].
The partners of these consortia were the Laboratory for Earthquake Engineering of the National Technical University of Athens (NTUA), Greece, the Earthquake Engineering Research Center of the University of Bristol, U.K., the Laboratorio Nacional de Engenharia Civil (LNEC), in Lisbon, Portugal, the Commissariat a l’Energie Atomique (CEA), in Saclay, France and Enel.Hydro s.p.a., in Seriate, Italy. Later, the former ECOEST partners have created a new consortium named ECOLEADER (European Consortium of Laboratories for Earthquake and
2 Copyright © 2005 by SMiRT18 Dynamic Experimental Research) and including the new reaction wall facility constructed at the Ispra Joint Research Centre, in Italy.
These activities have induced an enhanced control at all the facilities of the consortia but have also highlighted the need to carry out a new project in view of further benchmark tests with extension to non-linear behavior.
In this paper are presented the first tests of a particular task of this new project consisting on the comparison of the performances of three shaking tables (CEA, LNEC and NTUA) of the consortium ECOLEADER. These three laboratories are running important European shaking tables, from 4x4 m to 6x6 m platform, from a dead-weight of 10 tons to 40 tons and allowing horizontal dynamic forces between 300 kN and 2000 kN, thus comprising a wide spread of seismic experimental activities.
The characteristics of a common specimen being able to be tested by these three laboratories were defined. These characteristics take into account the performances and dimensions of this three representative shaking tables. The specimen will be tested successively on each table (the same specimen will be transported by truck among the laboratories), under uniaxial input signals, and the results will be compared.
This test specimen was designed to reproduce the global non-linear behavior of a concrete building while being damaged during an earthquake, concerning a typical global stiffness reduction. It is important to highlight that it was conceived in order to allow consecutive similar tests in spite of its non-linear behavior.
This system, being able to simulate a sudden collapse or a progressive degradation, can reproduce, in a repetitive and accurate way, the same non-linear conditions. It is possible to change its stiffness during the seismic tests whenever it is wanted and for an adjustable duration. Consequently, it also allows a comparison of the earthquake simulators behavior concerning the change of the control conditions and the influence of the intrinsic characteristics of each specific facility.
2. TESTING PROGRAM
A testing program has been defined by the three laboratories. This program consists in seismic tests performed in each laboratory on a model where the characteristics can change very fast during the excitation to simulate for example the collapse of a building during an earthquake. The model was dimensioned in order to be able to be tested on the three shaking table of the CEA, LNEC, and LTUA having characteristics very different the ones from the others and with repetitive testing conditions. The model is tested in its plan.
3. TESTING FACILITIES 3.1 CEA testing facility
The CEA testing facility, TAMARIS infrastructure, includes the AZALEE 6m x 6 m shaking table. It allows testing of specimen with a mass up to 100 tons in 3 directions and has 6 degrees of freedom (translations and rotations). Independent excitations of any kind: (sinusoidal, random, shock, seismic...with a 0 -100 Hz frequency range) may be applied. Three other tables (VESUVE, TOURNESOL and MIMOSA), each having about 10 tons capacity, optimize the use of the facility. The tables are completed by a pit (IRIS) which allows testing of specimen up to 25m long with a diameter of about 4m;
All equipments are connected to the acquisition system for recording and processing of 142 channels The Laboratory is connected to a scientific computing system with finite element code (Cast3M).
The Laboratory is working on different national and international (Europe, Japan,..) programs related to the seismic behavior of equipment, components and structures.
Main activities are devoted to
- Industrial and nuclear equipment such as electrical cabinets, tanks, storage racks, piping systems, to understand and codify their seismic behavior, and to evaluate the margins of current design methodologies.
- Civil engineering structures: analysis and testing of structural element (shear walls, frames…) or full structures in order to evaluate the margins of design methods or to improve them and to quantify the effect of construction details (joints, bond slip, lap splices,..) and soil structure interaction
The tests are carried out on the triaxial shaking table (Horizontal + Vertical) Azalée of laboratory EMSI. This table, 6 m X 6 m, can support specimens of a mass being able to reach 100 Tons.
3 Copyright © 2005 by SMiRT18 It is actuated by 8 electro hydraulic jacks of 1000 kN each one (4 jacks into horizontal and 4 into vertical). Four pneumatic static supports placed under the table make it possible to take again a part of the actual weight (model + table) during the tests. The figure N° ** presents a view of the table
The shaking table is controlled by a bay of control associated with a PC with piloting DELL Precision 410, i. For seismic tests, the program of piloting I_PSCn Version 4.5.1.2 developed by the company DATA PHYSICS is used. It allows the control from 1 to 6 degrees of freedom according to the table used. It makes it possible to determine the transfer functions of the testing facility according to all degrees' of freedom and corrects the signals of control sent in loop open on each axis of the table. A Spectrum of Response of Oscillators (SRO) of table is calculated starting from the acceleration measured on the table. It is compared during the preliminary tests with the spectrum of reference. Corrections on the transfer functions can be carried out if necessary to approach as well as possible acceleration and the desired spectrum. For the controller, the sampling rate is equal to 200 Hz. All the signals are filtered to 50 Hz. For the other acquisition channels, the sampling rate of the signals is 200 Hz (PC DELL Dimension V400).
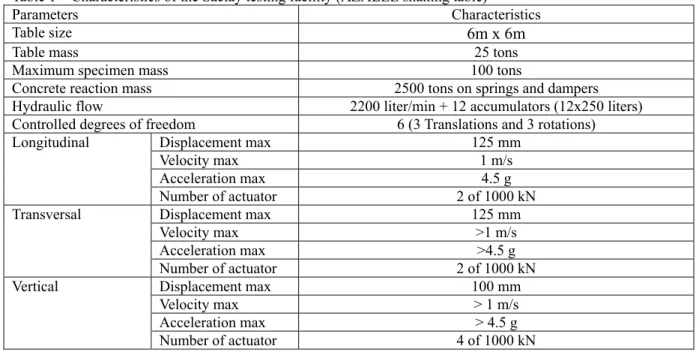
Table 1 – Characteristics of the Saclay testing facility (AZALEE shaking table)
Parameters Characteristics
Table size 6m x 6m
Table mass 25 tons
Maximum specimen mass 100 tons
Concrete reaction mass 2500 tons on springs and dampers
Hydraulic flow 2200 liter/min + 12 accumulators (12x250 liters)
Controlled degrees of freedom 6 (3 Translations and 3 rotations)
Displacement max 125 mm Velocity max 1 m/s Acceleration max 4.5 g Longitudinal Number of actuator 2 of 1000 kN Displacement max 125 mm Velocity max >1 m/s Acceleration max >4.5 g Transversal Number of actuator 2 of 1000 kN Displacement max 100 mm Velocity max > 1 m/s Acceleration max > 4.5 g Vertical Number of actuator 4 of 1000 kN
3.2 LNEC testing facility
The infrastructure is constituted by the seismic testing facilities installed at the LNEC (National Laboratory for Civil Engineering). It is operated by the NESDE (Seismic Engineering and Structural Dynamics Division) of the LNEC Structures Department. Its main equipment is a triaxial shaking table that has started its activity in 1993. Two smaller, uniaxial, shaking tables are also available.
The main table has three independent translation degrees of freedom, with the rotational degrees of freedom minimized by torque tube systems. Under the horizontal cranks it can be inserted either passive gas actuators, to cope with the dead weights of the shaking table and of the testing specimen, or rigid blocks eliminating the vertical motion of the table. An important upgrade of its hydraulic performance was recently accomplished, by means of an additional bank of nitrogen accumulators and replacement of the existing servo-valves by higher capacity ones in order to enable the table to reach peak velocities of 70 cm/s.
The shaking tables are located in a large testing hall with floor to ceiling height of 10 m enabling the testing of tall structures. Furthermore, around the triaxial shaking table there are 3 moderate capacity reaction walls that increase the ability of the facility to support diversified testing set-up.
4 Copyright © 2005 by SMiRT18 construction, installation and removal of large specimens from the table.
The equipment is operated by the NESDE, which provides a strong scientific environment, both in experimental and analytical terms, related to research in Earthquake Engineering. Besides the shaking tables themselves and their power stations this infrastructure includes also three specifically dedicated rooms, two devoted to control and one devoted to data acquisition and processing.
An informatic network is established within NESDE providing immediate access from all office rooms to the data acquisition systems. Command and control of the shaking table is fully digital with capability to simulate specific motions expressed either as a response spectra or a time-history of motion. The acquisition system, a state of the art proprietary program, allows up to 154 channels for measuring pressures, forces, accelerations, displacements (LVDTs and optical), strains, etc.
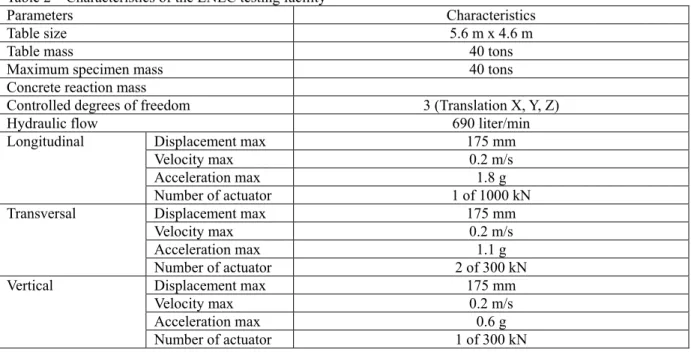
Table 2 – Characteristics of the LNEC testing facility
Parameters Characteristics
Table size 5.6 m x 4.6 m
Table mass 40 tons
Maximum specimen mass 40 tons
Concrete reaction mass
Controlled degrees of freedom 3 (Translation X, Y, Z)
Hydraulic flow 690 liter/min
Displacement max 175 mm Velocity max 0.2 m/s Acceleration max 1.8 g Longitudinal Number of actuator 1 of 1000 kN Displacement max 175 mm Velocity max 0.2 m/s Acceleration max 1.1 g Transversal Number of actuator 2 of 300 kN Displacement max 175 mm Velocity max 0.2 m/s Acceleration max 0.6 g Vertical Number of actuator 1 of 300 kN
3.3 NTUA testing facility
A mechanical shaking table was existing at Athens’ National Technical University since 1965. Based on this experience, and by the destructive earthquakes that occurred in the major cities of Greece during the period 1978-1981, a new shaking table was realized in 1985. This 6 DOF shaking table with its control system was unique in the word, at that time. The steel table was constructed in Athens, as well as other minor items of the facility. The main characteristics of the earthquake simulator may be summarized as follows:
A specific analogue unit with which the user has the possibility of independent or simultaneous performance of each degree of freedom is controlled the shaking simulator. The unit can produce and combine: sinusoidal, quadrangular, signals with specified spectra or other characteristics created at the Laboratory, etc vibrations for each direction independently or simultaneously. External recordings of other receivers can be used to provide input to the analogue unit. Special procedure is performed in order to minimize the deviation between the desired and achieved input signal. The recorded data are stored in the computer, through D/A converters. Recently, and as a result of the CESTADS project the control has been tremendously ameliorated, bringing up the whole fidelity of the facility to the top in world class
5 Copyright © 2005 by SMiRT18 Table 3 – Characteristics of the NTUA testing facility
Parameters Characteristics
Table size 4m x 4m
Table mass 10 tons
Maximum specimen mass 10 tons
Concrete reaction mass 2500 tons on the ground
Controlled degrees of freedom 6 (3 Translations and 3 rotations)
Hydraulic flow 1248 liter/min
Displacement 100 mm Velocity 1 m/s Acceleration 2 g Longitudinal Number of actuator 2 of 160 kN Displacement 100 mm Velocity 1 m/s Acceleration 2 g Transversal Number of actuator 2 of 160 kN Displacement 100 mm Velocity 1 m/s Acceleration 4 g Vertical Number of actuator 4 of 160 kN
3.4 Comparison between the testing facilities
The table below shows the principal characteristics of the shaking tables. Table 4: Comparison on the size of the shaking tables
Site of the test facility Dimensions of the shaking table Degrees of freedom Empty mass of the table (tons)
Maximum payload (tons) Electronic controller CEA/Saclay 6 m x 6 m 6 25 (aluminum alloy) 100 MTS
LNEC 4.5 m x 5.3 m 3 (steel) 30 INSTRON
NTUA 4 m x 4 m 6 10 (steel) 10 à 15 MTS
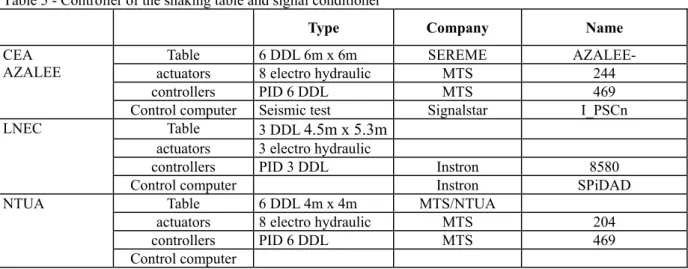
Table 5 - Controller of the shaking table and signal conditioner
Type Company Name
Table 6 DDL 6m x 6m SEREME AZALEE-
actuators 8 electro hydraulic MTS 244
controllers PID 6 DDL MTS 469
CEA AZALEE
Control computer Seismic test Signalstar I_PSCn
Table 3 DDL 4.5m x 5.3m actuators 3 electro hydraulic
controllers PID 3 DDL Instron 8580
LNEC
Control computer Instron SPiDAD
Table 6 DDL 4m x 4m MTS/NTUA
actuators 8 electro hydraulic MTS 204
controllers PID 6 DDL MTS 469
NTUA
6 Copyright © 2005 by SMiRT18
4. TESTED MOCK-UP
4.1 Characteristics of the mockup
The model consists of a frame with an oscillating mass wedged between inflatable cushions (see figure #**). This oscillating mass is characterized by stiffness and damping in order to simulate the response of a model equivalent at a building. It is possible to change the characteristics into a more or less long time in order to simulate degradation due to a seismic test. The frequency is adjusted by the pressure in the cushions and damping is ensured by the Gerb shock absorbers. The change of frequency is done by a partial depressurization through gauged diaphragms.
After dialogue between the three laboratories, the characteristics of the model were defined as follows: - Lower maximum mass: 14 tons,
- Mass of the oscillating part approximately 6 to 7 tons, - Initial frequency about 7 Hz,
- Final frequency about 3 Hz,
- Duration to pass from 7 to 3 Hz between 5 and 0.1secondes,
- All the configurations must be reproducible several times on the same table and in different laboratories. Two diaphragms of larger (60 mm) and smaller (10 mm) opening are tested for validation of the durations of discharges. The diaphragm of 60 mm diameter of opening lasts one discharge of 0.1second and that of 10 mm of diameter lasts 5 second.
4.2 Instrumentation of the mockup and shaking tables
The instrumentation on the table and the mock-up consists in:
- Accelerometers (3) to measure accelerations on the level, table, masses additional and frame. - Displacement sensors to measure the displacement of the additional masses.
Different signals from the shaking table controller and the position of the valves are also recorded: - Velocity, force and displacement of the table along the excited axis
-Displacement and force from roll and pitch degrees of freedom
- Displacement, intensity and delta Pressure on the level of a servo valve of one actuator - Driver signal send to the servo valve
- Opening and closing commands of the valves. - Opening or closing Response of the valves.
5. SEISMIC TESTS
Preliminary tests have been performed to calibrate the pressure in the airbag to obtain the required frequencies. With pressurized airbags the frequency of the steel mass in the frame is 6.73 Hz. Without pressure, the minimum frequency of the mass is measured at 3.4 Hz.
5.1 SEISMIC TESTS IN CEA-Saclay
Several series of seismic tests were carried out with increasing level of acceleration 0.1g, 0.4g and 0.6g. For each series of tests, the durations of variation of the characteristics of the model were changed (diaphragms): 5 seconds and 0.1 second.
For some tests, the piloting of the table is made in acceleration and/or displacement with one or three variables. The table below gathers the whole of the seismic tests carried out on Azalée shaking table
In order to see whether the table behave in the same way with tests with or without depressurization one compares the response of the sensor of table "axtab" with a test with and without depressurization of the model, under the same condition of configuration of the table and on the same level of excitation.
Our results are first of all based on the response of the sensor "axtab" because it measures the acceleration of the table, and because it is placed at the bottom of model.
We can notice, that, the Azalée table answers in acceleration (figures #1 to 3) at very similar with and without depressurization for all test levels and especially for high level. There is effect, due to the variation of stiffness on the response of the table.
7 Copyright © 2005 by SMiRT18 Table 6 - List of the seismic tests realized on AZALEE shaking table
diaphragm 0 mm without discharge diaphragm 10 mm discharge in 5 seconds diaphragm 60 mm discharge in 0.1 seconds Correct°
RRS Temporal Correct° Correct° RRS Temporal Correct° Correct° RRS Temporal Correct
0.1 g X X X X X 0.4 g X X X X X 3 variables control (acceleration) (acceleration signal) 0.6 g X X X X X 0.48 g X X 3 variables control (direct) (displacement signal) 1.13 g X X 0.1 g X X 0.4 g X 1 variable control (direct) (acceleration signal) 0.6 g X 0.55 g X X 1 variable control (direct) (displacement signal) 1.19 g X X
From the acceleration signals, the response spectra of the shaking table have been calculated (figure # 4). The comparison of the response spectra shows, for tests with and without depressurization, there is not a great difference, which still proves that the Azalée shaking table controller ins not affected by the behavior of the non linear model.
5.2 SEISMIC TESTS IN LNEC
The same tests (as Saclay) have been performed with the same initial conditions for the mock-up. The base signal was filtered to a frequency band ranging from 0.1 to 33 Hz and adapted to achieve 0.6G in the table. During tests the adapted base signal was scaled to achieve the desired peak acceleration level. In all tests applicable the trigger action to open the relief valves occurred 5s after signal start.
The slow discharge (approximately 5s) was obtained by using the plate with a 10mm aperture; while the fast discharge (approximately 0.1 s) was obtained by using the plate with a 60 mm aperture.
The following table gives the list of the tests.
The figures #5 and 6 show the comparison to the required signals for displacements and acceleration measured at 0.6 g for the three configurations without discharge and with 5s and 0.1 s discharge. No significant effect can be observed.
8 Copyright © 2005 by SMiRT18 Table 7 - List of the seismic tests realized at LNEC
Peak level (G) Configuration
0.1 diaphragm 0 mm without discharge 0.4 diaphragm 0 mm without discharge 0.6 diaphragm 0 mm without discharge 0.8 diaphragm 0 mm without discharge 0.1 diaphragm 10 mm discharge in 5 seconds 0.4 diaphragm 10 mm discharge in 5 seconds 0.6 diaphragm 10 mm discharge in 5 seconds 0.8 diaphragm 10 mm discharge in 5 seconds 0.1 diaphragm 60 mm discharge in 0.1 seconds 0.4 diaphragm 60 mm discharge in 0.1 seconds 0.6 diaphragm 60 mm discharge in 0.1 seconds 0.8 diaphragm 60 mm discharge in 0.1 seconds 1.0 diaphragm 60 mm discharge in 0.1 seconds 1.2 diaphragm 60 mm discharge in 0.1 seconds
5.3 SEISMIC TESTS IN NTUA
The tests in NTUA have been performed during the spring. The tests results are not available today.
6. CONCLUSION
The tests carried out on the LNEC and CEA shaking table and the analysis of the results, show that the control of the tables is not affected by the fast decrease of stiffness of the mock-up.
For the tests performed in Saclay and Lisbon, the mock-up is relatively small by comparison with the masses of the shaking tables.
It is not the same case for the tests performed in Athens. Probably, some effects will be measured. The last series of tests will be presented and explained in a future article.
REFERENCES
[1] Crewe, A. et al., Standardization of Shaking Tables, Series of ECOEST/PREC8 reports, General Editors Severn, R. and Bairrao, R., Vol. 1, 1997.
[2] Stoten, D., Magonette, G. et al., Developments in the Automatic Control of Experimental Facilities, Series of ECOEST2/ICONS reports, General Editors Severn, R. and Bairrao, R., Vol. 9, 2001.
9 Copyright © 2005 by SMiRT18 Photography 1 – View of the mock-up on the AZALEE shaking table
10 Copyright © 2005 by SMiRT18 Figure # 1 - CEA-Saclay – test at 0.1 g
Figure # 2 - CEA-Saclay – test at 0.4 g
Figure # 3 - CEA-Saclay – test at 0.6 g
Test on AZALEE shaking table - Comparison for three level of 0.1 g, 0.4 g 0.6 g, with and without discharge
5.00 10.00 -0.70 -0.50 -0.30 -0.10 0.10 0.30 0.50 s Re al , g f_t,axtab ¤ f_t,axtab f_t,axtab X=6.86 Y=-0.31 5.00 10.00 -0.50 -0.40 -0.30 -0.20 -0.10 0 0.10 0.20 0.30 s Re al , g f_t,axtab ¤ f_t,axtab f t,axtab X=6.75 Y=-0.29 5.00 10.00 -0.15 -0.10 -0.05 0 0.05 0.10 0.15 s Re al , g f_t,axtab ¤ f_t,axtab f_t,axtab X=4.96 Y=-0.03
11 Copyright © 2005 by SMiRT18 Figure # 4 - CEA-Saclay – Spectrums – Comparison with and without discharge at 0.6 g
5 5.5 6 6.5 7 7.5 8 8.5 9 9.5 10
50 0 50
Position 5 s after trigger - Peak 0.6 G
Time [s] Amplitude [mm] 60 60 Target nfr_6f nfr_6tf nfr_6ff 10 5 t
Figure # 5 - LNEC - Displacement of the shaking table – Comparison with and without discharge at 0.6 g (Discharge performed at time 5s at the beginning of the curve)
5 5.5 6 6.5 7 7.5 8 8.5 9 9.5 10
1 0.5 0 0.5
1 Accel. 5 s after trigger - Peak 0.6 G
Time [s] A cceleration [G ] 0.551 0.602 Target nfr_6f nfr_6tf nfr_6ff 10 5 t
Figure # 6 - LNEC - Acceleration of the shaking table – Comparison with and without discharge at 0.6 g (Discharge performed at time 5s at the beginning of the curve)
0.50 1.00 10.00 100.00 0.20 0.40 0.60 0.80 1.00 1.20 1.40 1.60 1.80 Hz Re al , g SRS (f_t,axtab) ¤ SRS (f_t,axtab) niveau 0,6g