HAL Id: in2p3-00397563
http://hal.in2p3.fr/in2p3-00397563
Submitted on 22 Jun 2009
HAL is a multi-disciplinary open access
archive for the deposit and dissemination of
sci-entific research documents, whether they are
pub-lished or not. The documents may come from
teaching and research institutions in France or
abroad, or from public or private research centers.
L’archive ouverte pluridisciplinaire HAL, est
destinée au dépôt et à la diffusion de documents
scientifiques de niveau recherche, publiés ou non,
émanant des établissements d’enseignement et de
recherche français ou étrangers, des laboratoires
publics ou privés.
Phase and amplitude measurement for the SPIRAL2
accelerator
C. Jamet, W. Le Coz, C. Doutressoulles, T. André, E. Swartvagher
To cite this version:
C. Jamet, W. Le Coz, C. Doutressoulles, T. André, E. Swartvagher. Phase and amplitude measurement
for the SPIRAL2 accelerator. 9th European Workshop on Beam Diagnostics and Instrumentation for
Particle Accelators (DIPAC 2009), May 2009, Basel, Switzerland. pp.1-2, 2009. �in2p3-00397563�
PHASE AND AMPLITUDE MEASUREMENT
FOR THE SPIRAL2 ACCELERATOR
C. Jamet, W. Le Coz, C. Doutressoulles, T. Andre, E. Swartvagher, GANIL, Caen, France
Abstract
The SPIRAL2 project is composed of an accelerator and a radioactive beam section. Radioactive ions beams (RIBs) will be accelerated by the current cyclotron CIME and sent at GANIL experimental areas. The accelerator, with a RFQ and a superconducting Linac, will accelerate 5 mA deuterons up to 40MeV and 1 mA heavy ions up to 14.5 MeV/u. A new electronic device has been evaluated at GANIL to measure phase and amplitude of pick-up signals. The principle consists of directly digitizing pulses by under-sampling. Phase and amplitude of different harmonics are then calculated with a FPGA by an I/Q method. Tests and first results of a prototype are shown and presented as well as future evolutions.
SPIRAL2 ACCELERATOR
DESCRIPTION
Figure 1: Accelerator Layout.
The accelerator is divided in 3 main parts, an injector, a superconducting linac and a high energy line. The injector part is composed of a deuteron/proton line, an ion line (LEBT), a RFQ and a MEBT line. Two kinds of superconductivity cavity are used for the Linac (β=0.07,
β=0.12).
Table 1: Beam Intensity and Power
BEAM ENERGY MEASUREMENT
During the RFQ and the MEBT commissioning, an Injector Test Bench (BTI) will be used to qualify beam characteristics. Beam energy will be measured at the exit of the RFQ by the “time of flight” method. Another beam energy measurement by TOF is foreseen in the HEBT at the exit of the superconducting LINAC.
Table 2: Phase Measurement Accuracy
Energy Accuracy Distance (mm) Phase Accuracy IBT 3
10
− 1500 +/-0.2 +/-0.5° HEBT 310
.
5
− 5000 +/-2 +/-2 °Intensity dynamic (50 µ A < Ibeam < 5mA) Beam ratio (CW to 100µs/100ms)
Phase measurement gives the possibility to subtract the offset, an advantage compared to the time measurement.
INJECTOR TEST BENCH PICK-UP
3 pick-ups will be used to measure beam energy. The third pick-up allows determining the bunch number between two first pick-ups.
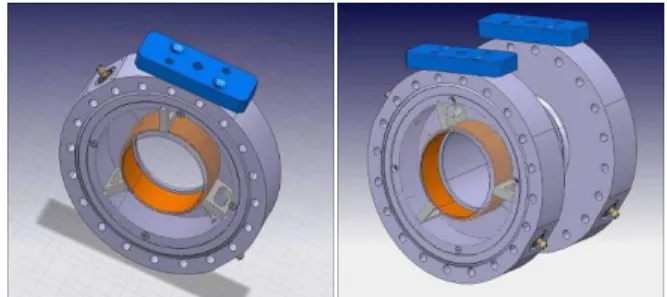
Figure 2: Pick-up Design. Diameter: 80 mm, Length: 30 mm.
PICK-UP SIGNAL SIMULATIONS
Figure 3: MEBT Pick-up Signal Simulation. Signal amplitudes
- 1mA ions Q/A =1/3: Vh1 = 50 mV - 5mA deuterons : Vh1 = 230 mV Ratio h1/h2 = 13
Intensity Energy Power
LEBT1 (ions) 1 mA 20 keV/A 60 W
LEBT2 (deut.) 5 mA 40 keV 200 W
MEBT 5 mA 750 keV/A 7.5 kW
HEBT 5 mA 20 MeV/A 200kW
Pick-up Signal Simulation in the SPIRAL2 MEBT
-0,3 -0,2 -0,1 0 0,1 0,2 0,3
-1,E-08 0,E+00 1,E-08 2,E-08 3,E-08 4,E-08 5,E-08 6,E-08
Time (sec) P ic k -u p s igna l ( V )
1mA Ions Q/A=1/3 5mA Deutons
Proceedings of DIPAC09, Basel, Switzerland TUPD17
07 Hadron Accelerator Instrumentation
Figure 4: HEBT Pick-up Signal Simulation. Signal amplitudes
- 1mA Ions Q/A= 1/3: Vh1= 27mV Vh2= 44mV - 5mA Deuterons : Vh1= 136mV Vh2= 220mV Ratio h1/h2 = 0,62
PHASE MEASUREMENT METHOD
Figure 5: Assembly Scheme.
Three pick-up signals and the accelerator frequency signal will be connected directly to the FPGA phasemeter.
Under-sampling
Every signal is digitized at a sampling frequency lightly different from the signal frequency.
Figure 6: Under-sampling Timing.
Nb: number of samplings to reconstruct a signal period
Under-sampling uses ADCs at a lower frequency than a classical digitalisation frequency. The sample period is higher and allows digital signal processing directly by FPGA. The ADC accuracy increases and improves the dynamic measurement. The reference is also under-sampled and used in the FPGA digital signal processing.
I/Q Method
Figure 7: I/Q Diagram.
Digital signals are processed by an I/Q method in a FPGA. A synchronisation input is foreseen for pulsed beam, which indicates the beam presence.
Under-sampling and digital process simplify the analogic chain and remove mixers used classically with an I/Q method.
FPGA BOARD PROTOTYPE
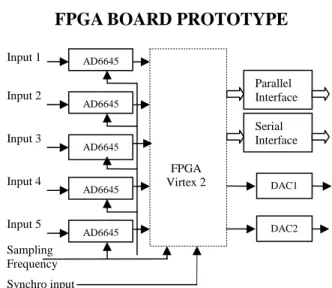
Figure 8: Board Diagram.
The FPGA board prototype is composed of analog to digital converters AD6645 Analog Devices (14 bits), a FPGA Virtex2 Xilinx, a double digital to analog converter AD9765, a parallel and a serial interface.
AD6645 Sampling Frequency FPGA Virtex 2 Synchro input AD6645 AD6645 AD6645 AD6645 DAC1 DAC2 Parallel Interface Serial Interface Input 1 1 Input 2 1 Input 3 1 Input 4 1 Input 5 1 Ref . X(t) Y(t) φ h1 Pick-up Signal A D C Sampling Frequency A D C 90° 2 2 1 1 ) ( tan Y X k h X Y + = = − ϕ
FPGA digital signal processing Synchro ⎪ ⎪ ⎩ ⎪⎪ ⎨ ⎧ + = = − 2 2 1 2 1 ) ( tan Y X A h X Y ref ϕ ⎪ ⎪ ⎩ ⎪⎪ ⎨ ⎧ = = ) sin( 2 ) cos( 2 ϕ ϕ ref sig ref sig A A Y A A X
Signal Period Tsig
Δt S(t) t Sampling Period Tsampl FPGA Phasemeter Pick-up1 Accelerator Frequency 88,05 MHz (Reference) Sampling Frequency Pick-up2 Pick-up3 Synchro 1 + = Nb Nb Fsig Fsamp Tsig Tsamp t= − Δ t Tsig Nb Δ =
Pick-up Signal Simulation in the Spiral2 LHE
-1 -0,8 -0,6 -0,4 -0,2 0 0,2 0,4 0,6 0,8 1
-5,00E-09 0,00E+00 5,00E-09 1,00E-08 1,50E-08 2,00E-08 2,50E-08 3,00E-08
Time (sec) P ic k -up s igna l ( V )
1mA Ions Q/A=1/3 σ phase = 1,2° 5mA Deutons σ phase = 1,2°
TUPD17 Proceedings of DIPAC09, Basel, Switzerland
07 Hadron Accelerator Instrumentation
TEST BENCH DESCRIPTION
Tests and measurements are realized at a GANIL frequency (7MHz). The goal is to compare the measures in laboratory and on the accelerator.
CW Sinusoidal Signal
Figure 9: Test Bench Diagram.
Synthesizer R&S and splitters generate references and signals. FPGA Phase and module values are compared with the lock-in amplifier measures (SR 844 Stanford Research). The reference frequency is calculated to have 256 values per period in the FPGA process. Programmable Delay lines change the signal phase from 0° to 360°. Tests consist of measuring phase and module variations between FPGA and SR844 with shifting the signal phase. A variable attenuator decreases module signal from 0dB to 60 dB and allows comparing results with different signal levels.
RESULTS
Figure 10: Phase and Module Variations.
Results are the same with a duty cycle (1ms/100ms), measurement time increases proportionally to the ratio.
CW Pulse Signal
A pulse generator (Avtech AVM-1-C) is installed in front of the attenuator. The pulse width is about 10 ns.
Figure 11: Phase Variations.
Main variations are due to the h2 and h3 harmonics of the reference signal. Results will be improved after filtering the reference by process.
CONCLUSIONS AND EVOLUTIONS
Under-sampling and numerical processing by I/Q method gives good results in laboratory. On a great dynamics (60dB), FPGA phasemeter is able to measure sinusoidal signal phase precisely (+/-0.1°). With pulse signals, improvements must be done to filter the reference signal and optimize the accuracy.
Pick-up signal digitalization gives also the possibility to calculate module and phase of different harmonics. This electronics can also give the opportunity to follow beam intensity on line.
The next step consists in using FPGA phasemeter on the GANIL accelerator, measuring the time of flight with two pick-ups, calculating the beam energy and comparing this value with the spectrometer measure.
A new prototype is also in development to improve analog input adaptation, sampling frequency distribution, integration with the FPGA.
REFERENCES
[1] P. Ausset & al, SPIRAL2 Injector Diagnostics, DIPAC09, Basel, MOPD27
[2] C. Jamet & al, Injector Diagnostic Overview of SPIRAL2 Accelerator, DIPAC07, Venice
[3] T. Junquera & al, Status of the Construction of the SPIRAL2 Accelerator at GANIL, LINAC08, Victoria [4] T. Junquera & al, The high intensity superconducting Linac for the SPIRAL2 project at Ganil, LINAC06, Knoxville,
[5] P. Bertrand, JL Biarrotte and D. Uriot, Beam dynamics studies for the Spiral2 project, EPAC06 Phase variations between FPGA and SR measurements
-0,10 -0,08 -0,06 -0,04 -0,02 0,00 0,02 0,04 0,06 0,08 0,10 -180,00 -130,00 -80,00 -30,00 20,00 70,00 120,00 170,00 FPGA phase (°) diff phase (° ) 0 dB -20dB -40dB -60dB
Module variations between FPGA and SR devices
0,9980 0,9985 0,9990 0,9995 1,0000 1,0005 1,0010 1,0015 -180,00 -130,00 -80,00 -30,00 20,00 70,00 120,00 170,00 FPGA phase (°) modu le FPGA/module S R 0 dB -20dB -40dB -60dB
h1 phase variations between FPGA and SR
122,10 122,20 122,30 122,40 122,50 122,60 122,70 -180,00 -130,00 -80,00 -30,00 20,00 70,00 120,00 170,00 FPGA phase(°) pha se di ff e re n ce ( °) Vpulse =0,3v Vpulse=30mV Delay Synthe R&S F=7 MHz Att Lock-in Amplifier SR844 Fsampl PC FPGA Process board Serial link Signal Reference GPIB Reference Signal Synthe Marconi F=6972763 Hz +10dBm
Proceedings of DIPAC09, Basel, Switzerland TUPD17
07 Hadron Accelerator Instrumentation