HAL Id: hal-03244902
https://hal.archives-ouvertes.fr/hal-03244902
Submitted on 1 Jun 2021
HAL is a multi-disciplinary open access
archive for the deposit and dissemination of
sci-entific research documents, whether they are
pub-lished or not. The documents may come from
teaching and research institutions in France or
abroad, or from public or private research centers.
L’archive ouverte pluridisciplinaire HAL, est
destinée au dépôt et à la diffusion de documents
scientifiques de niveau recherche, publiés ou non,
émanant des établissements d’enseignement et de
recherche français ou étrangers, des laboratoires
publics ou privés.
Radionuclide distribution in tidal flat sediments of the
Westerschelde estuary
S. Schmidt, P. M.J. Herman, J.L. Reyss
To cite this version:
S. Schmidt, P. M.J. Herman, J.L. Reyss. Radionuclide distribution in tidal flat sediments of the
West-erschelde estuary. Radioprotection, EDP Sciences, 2002, 37 (C1), pp.C1-789-C1-794.
�10.1051/radio-pro/2002204�. �hal-03244902�
Radionuclide distribution in tidal flat sediments
of the Westerschelde estuary
S. Schmidt, P.M.J. Herman and J.L. Reyss
EDF, Laboratoire National d'Hydraulique et Environnement, 6 quai Watier, 78401 Chatou cedex, France
Abstract. Depth profiles of the particle-reactive radionuclides J I 0P b , n 7C s and 7B e were established in sediments of
a tidal flat in the Westerschelde. Cores were collected at different seasons at selected sites with contrasting characteristics. Accumulation rates estimated from 1 3 7C s profiles are consistent between the five sites with values
comprised between 1.1 at the marginal sites and 2.5 cm y'1 for the central part. Although the very low level of
excess 2 1 0Pb limits the precision of this method, profiles of 2 1 0P b „ with depth allow calculating a range of
sedimentation rates equivalent to those derived from 1 3 7C s data. At the muddy site, the vertical distribution of
radionuclides revealed the existence of an important accumulation layer of fine particles at a depth of around 10 cm at the muddy site, may be in relation with biological and physical processes. The vertical distribution of 7Be in the
top 6 cm exhibits wide variability on seasonal scale, with the highest inventories and bioturbation rates observed in summer. This trend is clearly related to the seasonal variation of silt content of surface sediments.
1. INTRODUCTION
Estuaries play an important role in the transformation of carbon, nutrients and pollutants carried by the rivers towards the coastal sea. On short time scales, estuarine sediments can therefore act either as sources or sinks for carbon and other chemical species. On longer time scales, net accumulation usually occurs. Moreover, the material being buried may differ from that deposited due to degradation, transformation and preferential resuspension [1]. Chronologies of contaminant input are dependent on the ability to establish the depositional history of the sediment [2].
In order to assess such processes, a better knowledge of the rates of particle reworking and sedimentation is required. Combining natural and artificial radionuclides with different half-live and input, it is possible to reconstruct a detailed picture of sediment mixing and geochronology over the 10-to 100- year time [3, 4]. We report here depth profiles of 7Be, 2 1 0P b in excess, Cs and granulometry of a
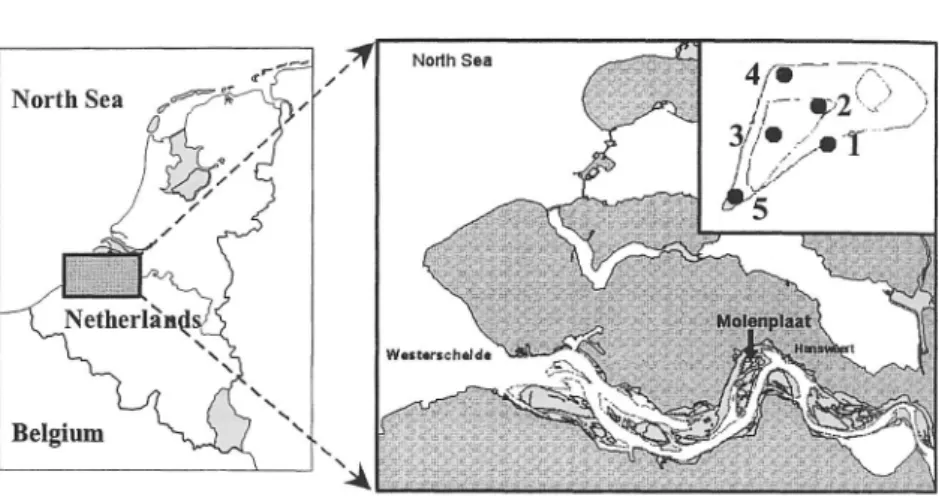
tidal flat, the Molenplaat, in the lower part of the estuary of the Westerschelde (Figure 1). Well-defined flood and ebb channels characterise this lower part, which is extending from the sea to 50 km from the mouth. Tidal range is around 5 m, depending on the spring-neap tidal cycle and the wind. The period of exposure varies between 4.5 h and 8 h per tidal cycle. The objectives of this work were to quantify the rates of deposition and sediment vertical mixing of this tidal flat in relation with environmental conditions.
2. M E T H O D
Molenplaat tidal flat, five sites of contrasting characteristics were selected: sites 2 and3aren^tbe central area of the flat, sites 1 and 4 near the gully, site 5 in the southernmost corner of the tlat l « g " « })• The sites differ in the granulometry of the sediment and in the composition of the dominant i a u n a . ^ main field campaigns have been held at the Molenplaat: June and September 1996, March Juneana September 1997. At low tide cores were taken using a hand-driven tube (1.2 m length x lu cm inner diameter). The sediments were then sliced in 1 or 2 cm increments after upward extrusion ot me cores
and dried at 60°C. , , t n
About 10-g aliquots of sediment were measured directly by non-destructive gamma spectronietry zo
determine activities of interest. Due to the low radionuclide levels, measurements were earned out using a low-background high-efficiency well-type y-detector (EURISYS Mesures, germanium crystal volumeof 430 cm3) at the underground laboratory of Modane, French Alps [5]. The standards used to calibrate the
ï-detector are mixtures of marine sediment with US NBS U and J h standards at 1000 ppm for U and Th-teay series, and 1 3 7Cs, purchased from ORIS for 1 3 7Cs. Excess 2 1 0P b (2'°Pb«,non 2 2 6Ra supportedIFb} is
calculated by subtracting the activity of its parent 2 2 6R a from the total 2 1 0Pb activity. Measured be
activities are decay corrected for the time elapsed between sampling and measurement.
Article published by EDP Sciences and available at http://www.radioprotection.org or http://dx.doi.org/10.1051/radiopro/2002204
Cl-790 RADIOPROTECTION - COLLOQUES
Granulometric composition was determined on the dried sediment samples with a Malvern partiels sizer, using laser diffraction. Focal length was 300 mm, and particle sizes in the range 0-500 urn w e r e
resolved. These analyses were performed on the top 18 cm of the sediment cores at station 2.
1: Map of sampling sites.
4-'BO M I T e 3->
2-<
1- 0-0 137. Cs •A 10 20 30 10 20 < 16 um fraction (%) < 16 urn fraction (%)Figure 2:1 3 7Cs and mPb„ activities vs. percentage of clay fraction (< 16 um).
3. RESULTS
There is a clear correlation between radionuclide activities and particle size.
Mostof, 3 7Cs,2 , 0Pb> sand№
activities are contained in the sediment fraction smaller than 16 um (Fig. 2). This behaviour was alreao] reported in estuarine system [6]. Such correlations between silt fractions and radionuclide activities are be expected because these fine particles with their high surface area are the main carriers oi tn radionuclides.
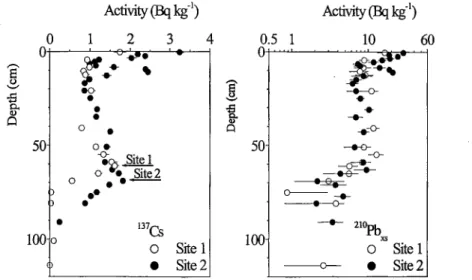
-Excess 2 l 0P b activities were relatively low with maximum values up to 30 Bq kg" (Figure J),
base of the core at about 1 m depth. The profile for site 2 was different with a rapid decrease of 2 I DPb
activities to a minimum at 6 cm depth, followed by a peak at 10-12 cm depth. For the sites 4 and 5 at the edges of the tidal flat, total Pb activities were close to the supported activity (< 10 Bq kg"')
l37Cs data were rather similar between the different sites of the Molenplaat (Figure 3) The 1 3 7Cs
profile at site 2 again has higher surface activities, up to 3.5 Bq k g1, and a sub-surface peak at about 10
cm, as already reported for Pb Apart from this sub-surface maximum, common 1 3 7Cs trends were low
activities overall, around 1 Bq kg", with the appearance of a single peak at depth. The position of this deep peak varied between 34 and 82 cm, depending on the site.
Activity (Bq kg"1) Activity (Bq kg"1) •6 Q 50 100 9 * • o
•
—w•
o * " • O v Sitel „ o *• Site 2 ) • ! 3 7Cs 0 o Sitel•
Site 2Figure 3: Profiles of 1 3 7C s and 2 1 0P bM with depth in the sediment: examples of sites 1 and 2. Arrows on profiles indicate
p e a k o f, 3 7C s .
At the muddiest site 2 ,7B e have been always detected in the surface of all the cores. The activities
decrease smoothly with depth and become undetectable below 6 cm. These profiles suggest some bioturbation effects on the top of the sediment. In addition 7Be presents a increase of activities from
spring to late summer. 4. DISCUSSION
4.1 Long-term sedimentation
For the determination of long-term sedimentation rates, we used the natural isotope 2 1 0Pb and the artificial
"7Cs. The 2 l 0Pb method is based on the measurement of the excess or unsupported activity Pb, which is
incorporated rapidly into the sediment from atmospheric fallout. Once incorporated into the sediment, unsupported 2 l 0Pb decays with depth, equivalent to time, in the sediment column according to itstaown
half-live [7]. Under the assumption constant flux and constant sediment accumulation rate ( C t : method) [8], the decrease of 2 1 0P b „ activities with depth is described by the following relation: [ P b J2
-! Pb Jo exp[- • z / S], where [2 l SP bx s]0 z are the activities of excess 2 1 < !Pb at surface, or base of the mixed
layer, and depth z, • is the decay constant of the nuclide, and S is the sediment accumulation rate in contrast to 2 lT b , l 3 7Cs do not occur naturally: it is a product of nuclear weapons testing and power plant
accidents. The first occurrence in the environment resulted from fallout of atmospheric nuclear weapons tests in the early 1950s, with a maximum input in 1963. More recently, in northern Europe, the Chernobyl accident in spring 1986 introduced a new 1 3 7Cs input [9]. As a consequence of these distinct input events,
«is possible to date sediments [10]. , . , , t n ,n
At site 2, both 2 1 0P b in excess and , 3 7C s exhibit sub-surface maxima, which correspond to an
equivalent peak in granulometry profiles. Therefore this trend can be ascribed to a local fine particle accumulation. For instance there is no clear explanation of this feature observed only at site z. u n e hypothesis is a preferential displacement of fines particles from the layer around 6 cm by a bio logical species, like Hydro-master followed by an excretion on surface or deeper. A second hypothesis could be a
Cl-792 RADIOPROTECTION - COLLOQUES
winnowing processes in two steps: accumulation of fines particles in preferential deposition area followed by their vertical migration link to water displacement in surficial sediment during tide. Equivalent phenomena was reported for the Thau pond where Monna et al. displayed a winnowing trend of fines particles due to ripple effect in shallow waters.
Deeper in the core 2, at about 68 cm, only the Cs profile present a second peak, w h i c h clearly corresponds to an input of Cs. A difference between weapon test and Chernobyl inputs is the occurrence of 1 3 4Cs associated with the Chernobyl event. Indeed weapon test 1 3 4Cs, with its period of 2 years, have
now completely disappeared after more than 30 years. The dating of this Cs peak had implied to concentrate Cs from a large amount of sediment of the corresponding layer. The absence of 1 3 4C s allowed
to attribute the deep peak to the introduction of Cs by the weapon tests in the early s i x t i e s . This is confirmed by the rapid disappearance of Cs in the deepest part of the core. There is in fact no apparent record of the Chernobyl input at the Molenplaat. But this fallout presented a large patchiness over the northern Europe [9]. Locally Martin et al [12] observed a low transfer of Cs to the lower Westerschelde estuary.
1 3 7Cs profile at site 2 leads to a mean sedimentation rate of about 2 cm per year. Deep c o r e s (40 -120
m) have been studied the same for the other sites (1, 3, 4, 5) of the Molenplaat. Profiles o f '"Csare relatively flat with the presence of the deep peak activity in depth. According to the site, this peak is observed at depth comprised between about 40 to 85 cm, which indicates l 3 7Cs-derived sedimentation
rates comprised between 1.1 and 2.4 cm yr"1 (Table 1)
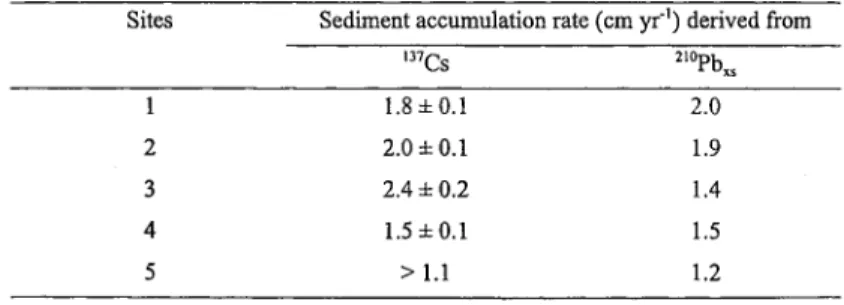
Table 1: Mean sedimentation rates at each site of the Molenplaat tidal flat, derived using 1 3 7C s and 2 l 0P bx, data.
Sites Sediment accumulation rate (cm yr"') derived from
, 3 7C s 2 , 0P bx s 1 1.8 ± 0 . 1 2.0 2 2.0 ± 0 . 1 1.9 3 2.4 ± 0.2 1.4 4 1.5 ± 0 . 1 1.5 5 > 1.1 1.2
As a test for the Cs-denved sedimentation rates obtained for the Molenplaat tidal flat, we applied an independent time marker, the 2 , 0P b . The major problem was the low activities in the sediment of (lie
Molenplaat (<30 Bq kg ) by comparison with previous tidal flat studies [13]. For example, about 20 km upstream m the Westerschelde estuary, Zwolsman et al. [14] reported levels of 2 l 0P b up to 200 B q k g ' o n
salt-marsh sediments. It must be pointed out that measurements have been only possible because of the low-background facilities of the underground laboratory, especially for sites 4 and 5. Nevertheless sediment accumulation rates derived from 2 1 0P bx s present comparable values when compared to tee
derived from Cs dating, with values between 1.2 to 2 cm per year (Table 1).
The sedimentation rates of the Molenplaat tidal flat, derived from radionuclide dating, are consistent with values comprised between 1.1 and 2.5 cm y1. The central sites, 2 and 3, present the higher rates, and
the marginal sites, 1 and 4, the lower values. A mean sedimentation rate of the flat was estimated independently, based on volume differences, corrected for the subsidence due to compaction, tectonics and isostasy This physical estimate gives an average depositional rate for the whole tidal flat of 1.3 ±0.1
S11 *í i i 6 5 y e a r S c o mPa t i b le with the radionuclide dating. Organic carbon burial rates at
the Molenplaat stations, based on organic carbon content and sedimentation rates of the sediment cores, vary between 10 and 105 gC m"2 y\ which is about 30 - 40 % of the total yearly carbon input into the
sediments [16]. 3 3
4.2 Short-term sedimentation
The cosmonucleide 7Be, with its short half-live (t1 / 2 = 53 days) is more suitable for the study of short-term
sedimentation In order to describe the fate of recently deposited particles, it is possible to calculate inventones and bioturbation coefficients from 7Be profiles.
There is a significant variation of 7Be activities in the uppermost sediments, with values increasing
from around 1 Bq kg in spring to up to 13 Bq k g1 late summer. 7Be, as 2 , 0P b and 1 3 7Cs, is mainly earned
fine-particle deposition is the most important factor affecting the accumulation pattern and vertical distribution of 7Be in estuarine systems. The low 7Be inventories in March may indicate the disappearance
of the finest fraction of the sediment (by erosion or drainage) in winter (Figure 4). On the contrary the increase of 7Be inventories in summer would indicate an increase of the concentration of fine particles in
the sediment. a" o
I
. 1 m 01/06/96 01/12/96 01/06/97 01/10/97 Period of the yearFigure 4: Temporal evolution of 7B e inventory (dark points) and bioturbation rate (dark star) in the top 6 cm cores at site 2 of
be Molenplaat tidal flat.
The simplest way to calculate bioturbation (Db) assumes bioturbation as a diffusive process
occurring at a constant intensity within a surface mixed layer [18]. Under these assumptions, evolution of 'Be with depth in sediment can be describe as: 7B e ]z = 7B e ]0 exp (- (•/Db)'/ l z), where 7B e ]0 z are the
activities of Be respectively at the sediment-water interface and at the depth z, • is the radioactive decay constant and Db the bioturbation rate coefficient. Applied to 7Be profiles obtained at the Molenplaat,
bioturbation rates varied from 6 in spring (March and June, 1997) to 52 cm2 yr"1 end summer (Sept. 97)
(Figure 4). As for 7Be inventories and silt content in upper sediments, Db presents a seasonal signal. This
may indicate the influence of biological activity on fine particle redistribution. Indeed the biomass of suspension feeders on this tidal flat, highest at places with low bottom shear stress, present seasonal variation. The evolution of the silt content at site 2 could be also the result of biodeposition by these animals. Inventories of 7Be associated with 7Be derived bioturbation rate seems to indicate two processes
influencing fines particles distribution in upper sediments: - erosion in winter and - bioaccumulation in summer.
5. CONCLUSION
This study clearly illustrates the interest of radionuclides as tracers of sedimentary pattern in estaanne environment. In particular the simultaneous use of radionuclides of different input and haü-üte allows to describe in details processes like sediment accumulation, bioturbation, erosion / deposition at amerem tae scales. When considering the long-term sedimentation, using 1 3 7Cs and 2 1 0P b profiles, it is concluded
that the Molenplaat tidal flat is accreting at a relatively constant rate, without strong disturbance oyer me past decades. But results on short-time scale point out the strong seasonality of particle deposition, m relation with erosion and biodeposition. The combination of these processes led at present: to• a nei accumulation for the Molenplaat tidal flat. But clearly this situation could drastically change it Balance is displaced toward erosion due to change in environmental forcing (effect of sea level, cnange in fequency/intensity of floods, biomass reduction of deposit feeders by accidental pollution • • • / • ^n an
event would release material stored in tidal flat sediments, such fine particles, bound-particle elements or organic carbon.
Cl-794 RADIOPROTECTION - COLLOQUES
Acknowledgments
This work was a part of the ECOFLAT (Eco-Metabolism of a Tidal Flat, ENV4CT960216) project sponsored by the EU European Union ELOISE programme. We thank the underground laboratory (LSM CNRS - CEA) and the captain and crew of the R.V. Luctor for logistic support. This is LSCE contribution 694.
References
[I] Middelburg J.J., Klaver G., Nieuwenhuize J. and Vlug T., Hydrobiol. 311 (1995) 57-69.
[2] Cochran J.K., Frignani M., Salamanca M., Belluci L.G. and Guerzoni S., Mar. Chem. 62 (1998) 15-29.
[3] Santschi P.H., Wen L.-S. and Guo L., Mar. Chem. 73 (2001) 153-171.
[4] Schmidt S., van Weering Tj.C.E. and de Stigter H.C., Mar. Geol. 173 (2001) 55-67.
[5] Schmidt S. and Reyss J.L., J. Geophys. Res. 101 (1996) 3589-3596.
[6] Baskaran M. and Naidu A.S., Geochim. Cosmochim. Acta 59 (1995) 4435-4448.
[7] Appleby P.G. and Oldfield F., "Application of lead-210 to sedimentation studies", Uranium-series disequilibrium: Application to Earth, Marine, and Environmental Sciences (Clarendon Press, Oxford. 1992) pp. 731-778.
[8] Krishnaswamy, Lai D., Martin J.-M. and Meybeck M., Earth Planet. Sci. Lett. 11 (1971) 407-414,
[9] Callaway J.C., DeLaune R.D. and Patrick Jr. W.H., Limnol. Oceanogr. 41 (1996) 444-450.
[10] Robbins J.A, Edgington D.N. and Kemp A.L.W, Quarter. Res. 10 (1978) 256-278.
[II] Monna F., Lancelot J., Bernat M. and Mercadier H., Oceanologica Acta 20 (1997) 627-638.
[12] Martin J.-M., Wollast R., Loijens M., Thomas A., Mouchel J.M. and Nieuwenhuize J., Mar. dim.
46(1994) 189-202.
[13] Cundy A.B. andCroudace I.W., Mar. Chem. 51 (1995) 115-132.
[14] Zwolsman J.J.G., Berger G.W. and Van Eck G.T.M., Mar. Chem. 44 (1993), 73-94.
[15] Schmidt S., Friend P. and Herman P.M.J., "Estimate of sedimentation rates of a tidal flat: a comparison between physical and internal methods", ELOISE - European Land-Ocean Interaction Studies, 3rd Open Science Meeting Noordwijkerhout, The Netherlands, 1-4 December 1999. [16] Schmidt S., Herman P.M.J., Middleburg J.J. and Reyss J.L., Mar. Chem. (submitted).
[17] Olsen C.R., Larsen I.L., Lowry P.D., Cutshall N.H. and Nichols M.M., J. Geophys Res. 91 (1986) 896-908.